
Mode Help
Query and analyze data
Datasets
Overview
Datasets are curated tables of data that can be reused across multiple reports. They are created by writing a SQL query and transforming the results of that query into a reusable asset. Datasets can then be shared across your organization. This allows multiple reports to be created off of the initial query, which can be set to refresh on a schedule. Reports created from Datasets will be able to consume the fresh data when available to ensure accuracy of the reporting over time.
The data in a Dataset is cached in Helix, which enables more efficient data usage and improved performance for reports created from Datasets. Rather than each individual report hitting the warehouse, only the single Dataset hits the warehouse when it refreshes. That data then cascades to all associated reports.
What are the benefits of using Datasets?
Datasets can help make maintaining and scaling access to data efficient and cost-effective. They create a new layer between your data warehouse and reports in Mode, which in practice allows for more control over governance, centralized logic, and data usage.
Key benefits of Datasets:
- Centralize logic and data quality: Datasets can power multiple reports, allowing analysts to write or update one query that cascades down across multiple reports.
- Manage data stack complexities: Datasets introduces a new way data moves through Mode, creating a middle governance later that can centralize logic and make scaling easier.
- Improve efficiency and performance: With data cached in Helix, this provides incremental performance gains for each report refresh that doesn't have to hit the data warehouse.
- Cost savings: Datasets are positioned between reports and warehouses for more efficient data usage and controlled warehouse hits.
- Confident self service access: Datasets can be an approved source for teams within an organization to confidently build reports without writing any code, knowing the dataset has been published by the data team.
- Data accessibility: Datasets can be organized in collections and browsed when creating reports. Datasets are subject to permissions just like reports.
When should you use Datasets?
Datasets are a great option for creating data assets that are reusable in nature. There are a couple of ways to think about reusability:
- Creating Datasets with a single query on a specific topic. End users can explore the data in a report, as well as add additional datasets to the report to create a more cohesive story of the data.
- A report that will be referenced regularly, such as a finance report for example. This report may contain multiple queries, which can all be combined into a Dataset with a single refresh schedule.
- A Dataset with a more broad data view, such as a Dataset created to answer questions about product engagement. The Dataset would be the source of truth for asking ad hoc questions on this topic.
Check out our Mode University learning path, Building Self-Serve Infrastructure with Datasets, to learn more about developing a Datasets strategy.
Creating a Dataset
The easiest way to create a reusable dataset is directly from a query in a Report. Alternatively, you can create one from scratch.
1. From a query in a report
You can create a dataset directly from a SQL query in an existing report, as long as the query has run successfully and returned a non-zero number of rows.
-
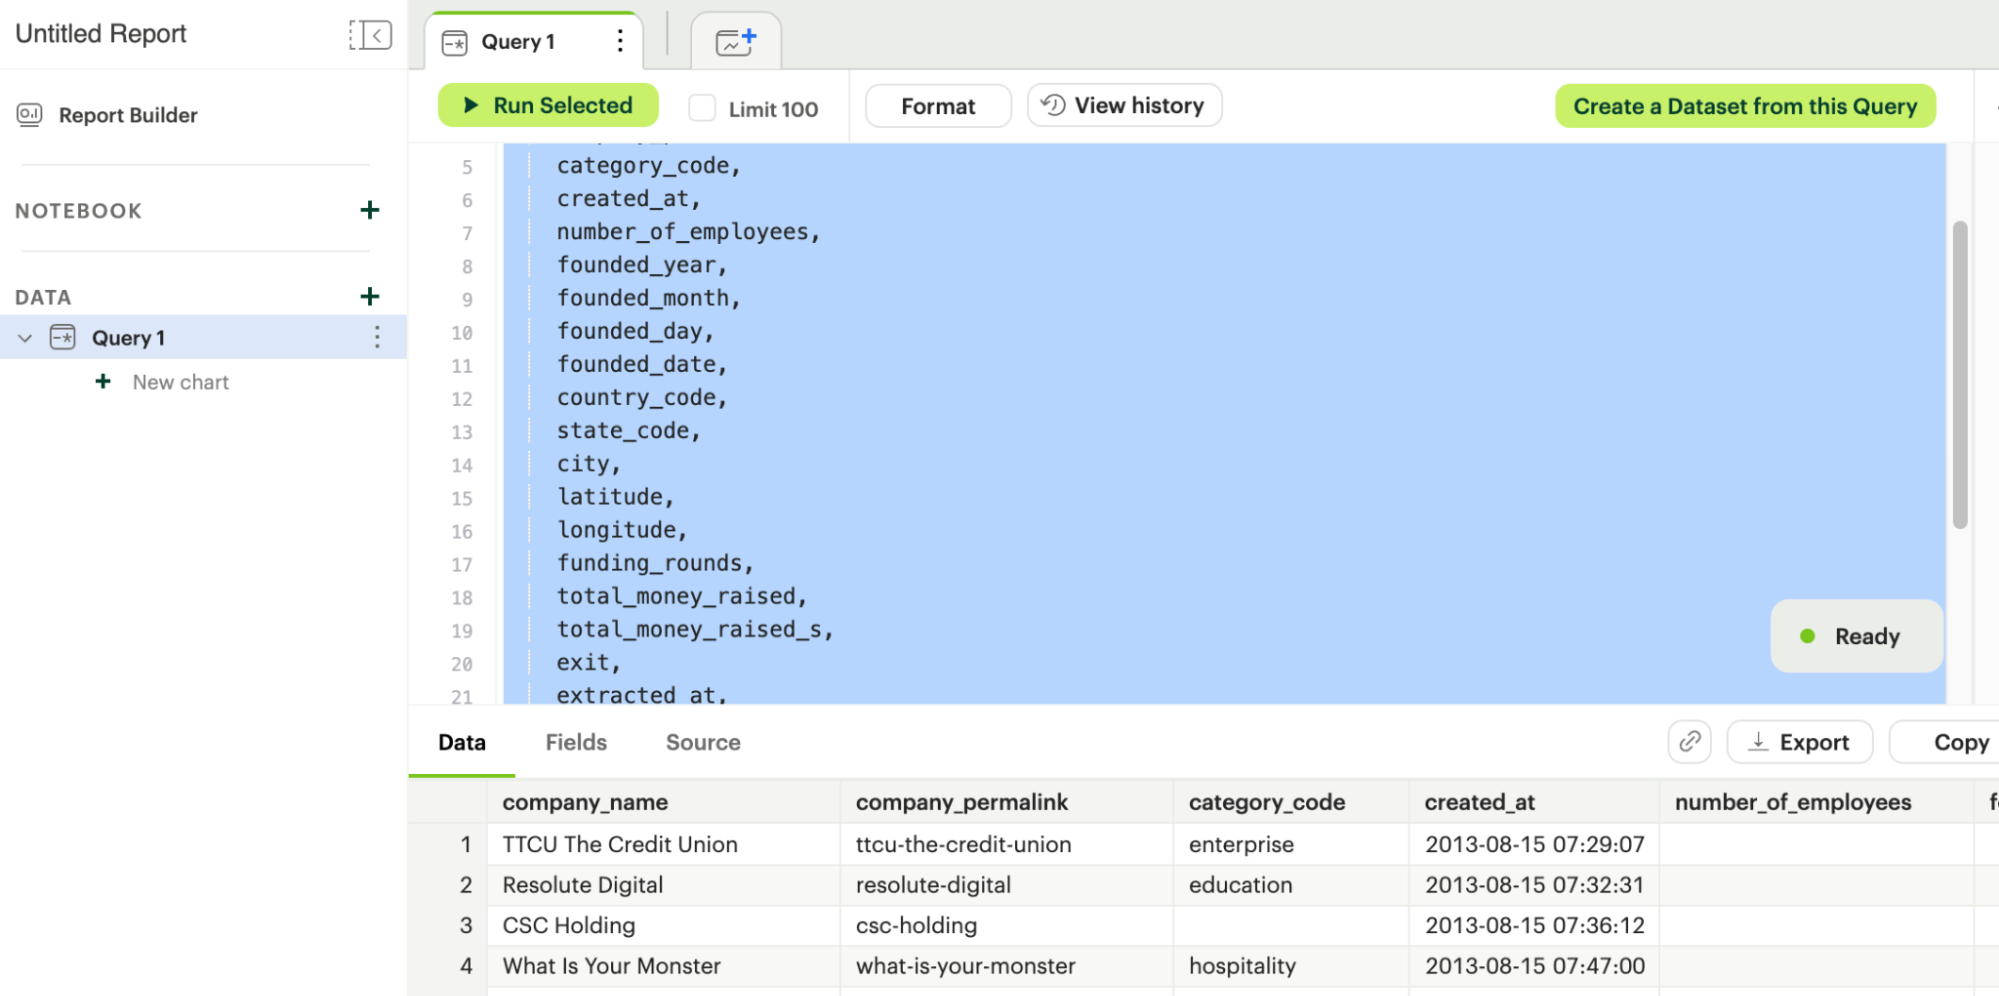
In your report, write and run your SQL query.
-
Click Create a Dataset from this Query at the top right of the query pane. This opens a modal where you can name your dataset and select a collection.
-
Click Promote
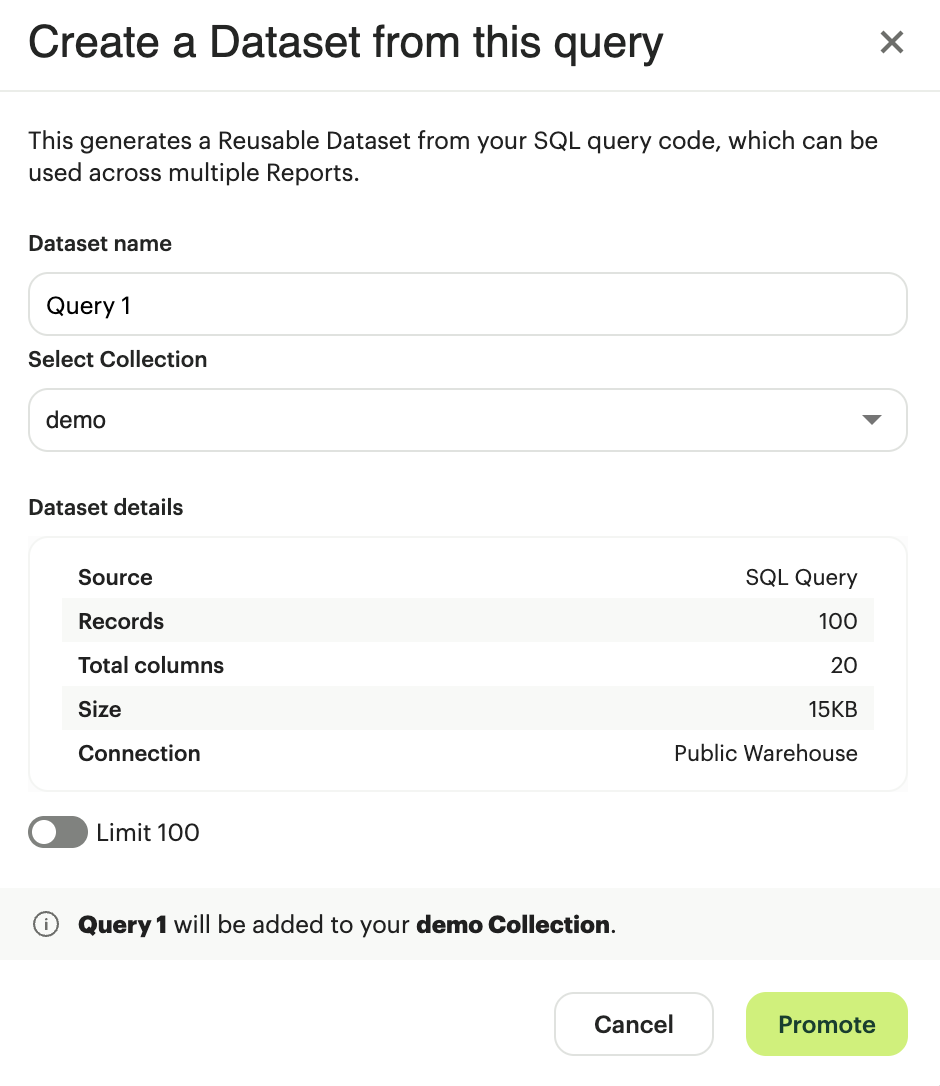
This process takes a snapshot of your SQL query and saves and executes it as a reusable dataset. Each time you click Create a Dataset from this Query, a new snapshot is created.
2. Build it from scratch
From the home screen, click New, then select Make a reusable Dataset.
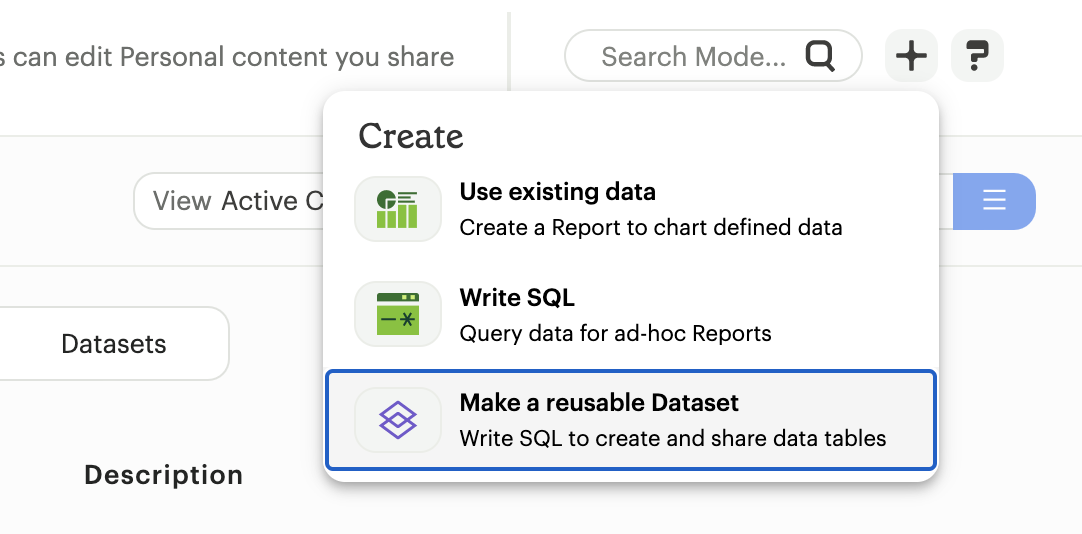
This will open up the Datasets editor where you can write a new SQL query or insert SQL snippets using Definitions.
Previewing your Dataset
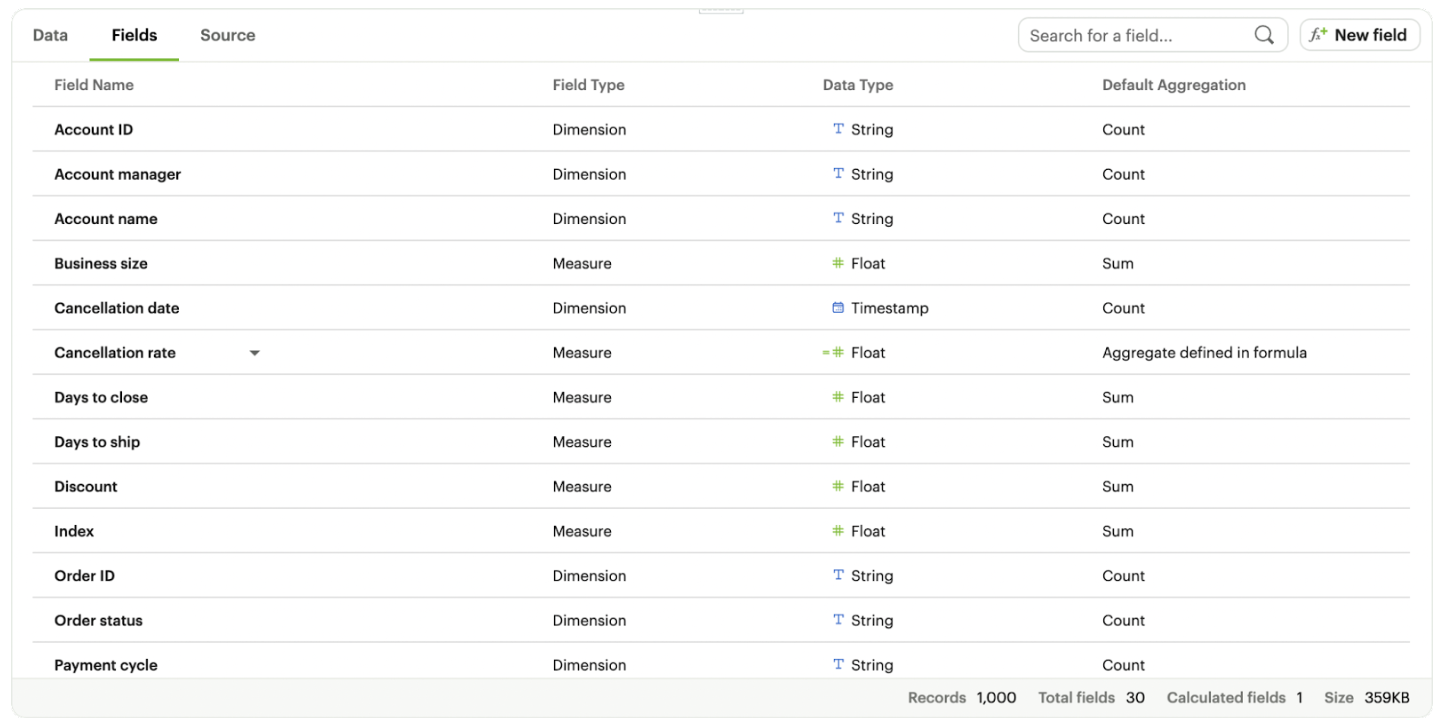
Once you run the query you will be able to see the results below in the data view. This shows you the columns that were generated from the SQL query.
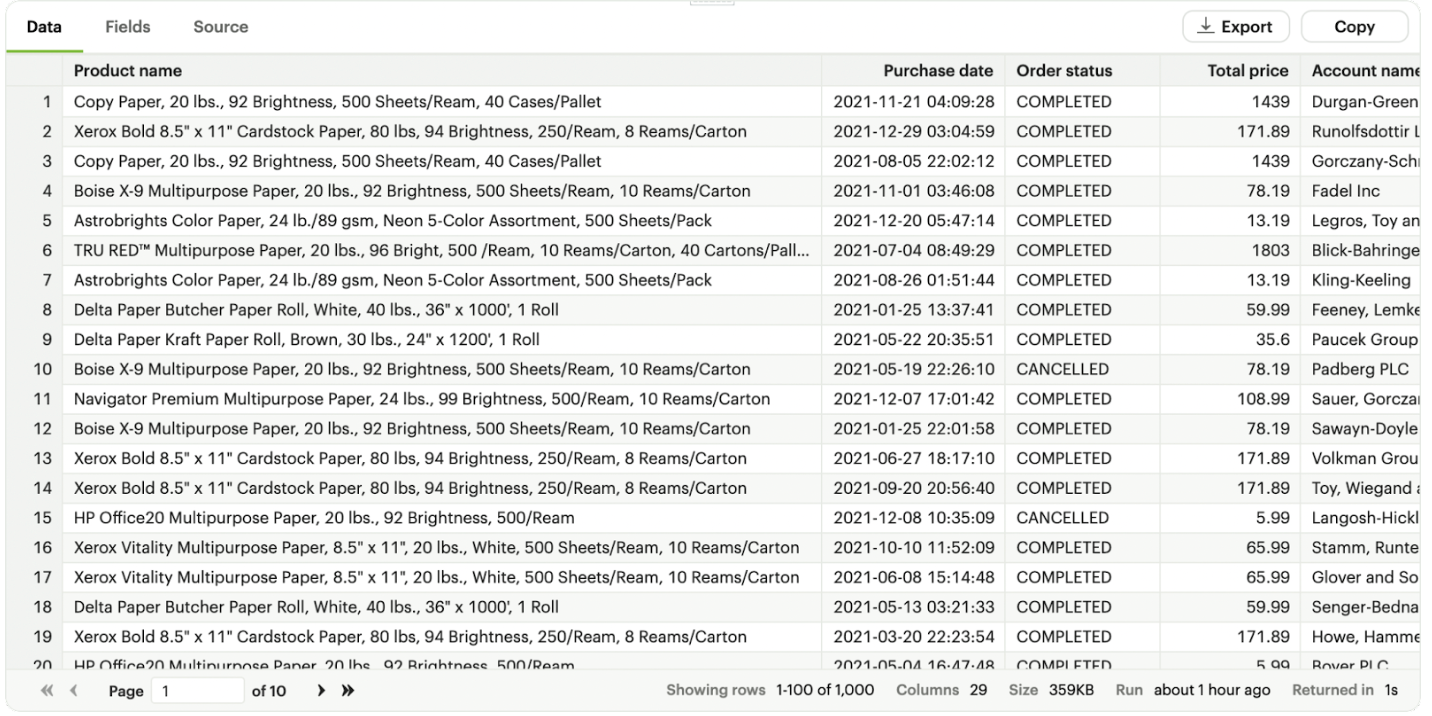
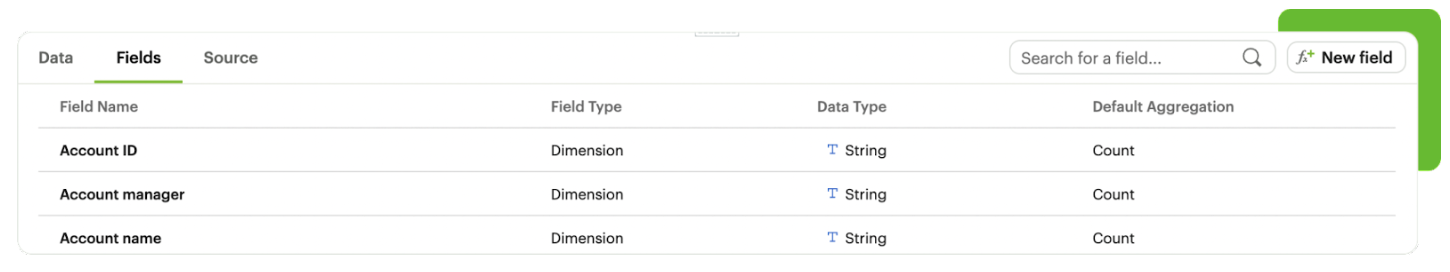
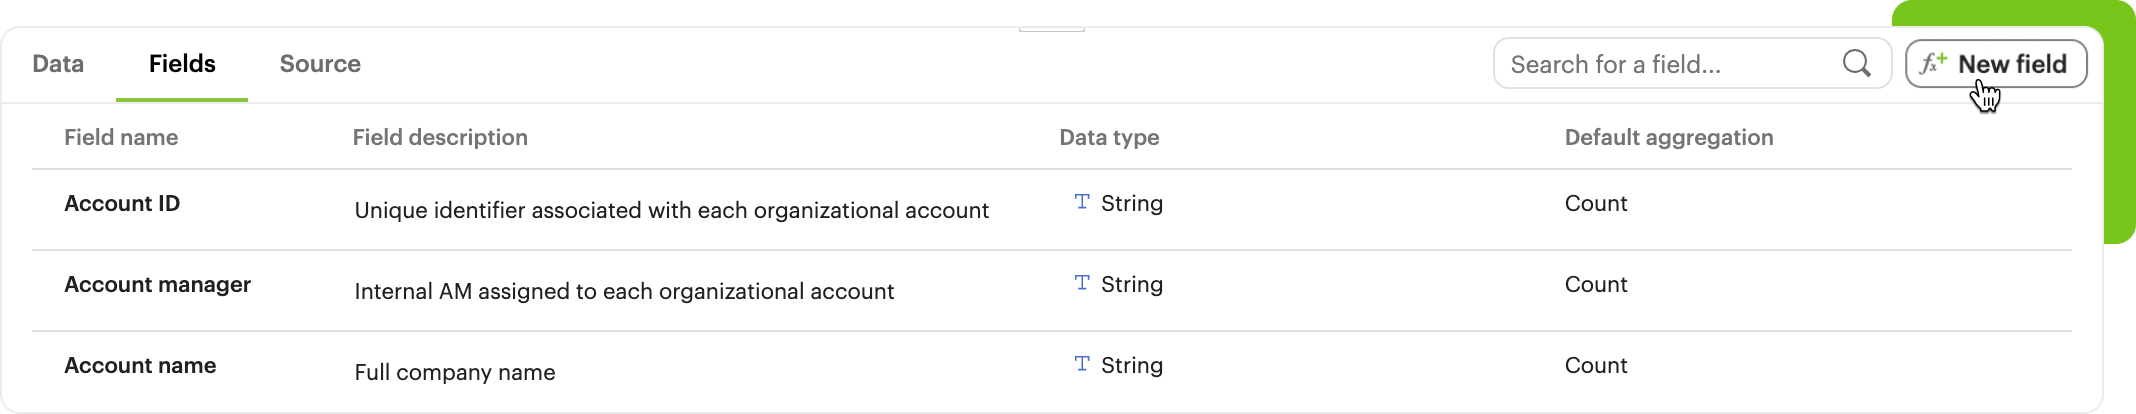
You can see a list of all of the available fields in the dataset from the Fields tab.
Describing the fields in your Dataset
We recommend adding field descriptions to all Workspace Datasets to build shared understanding around business and logic definition.
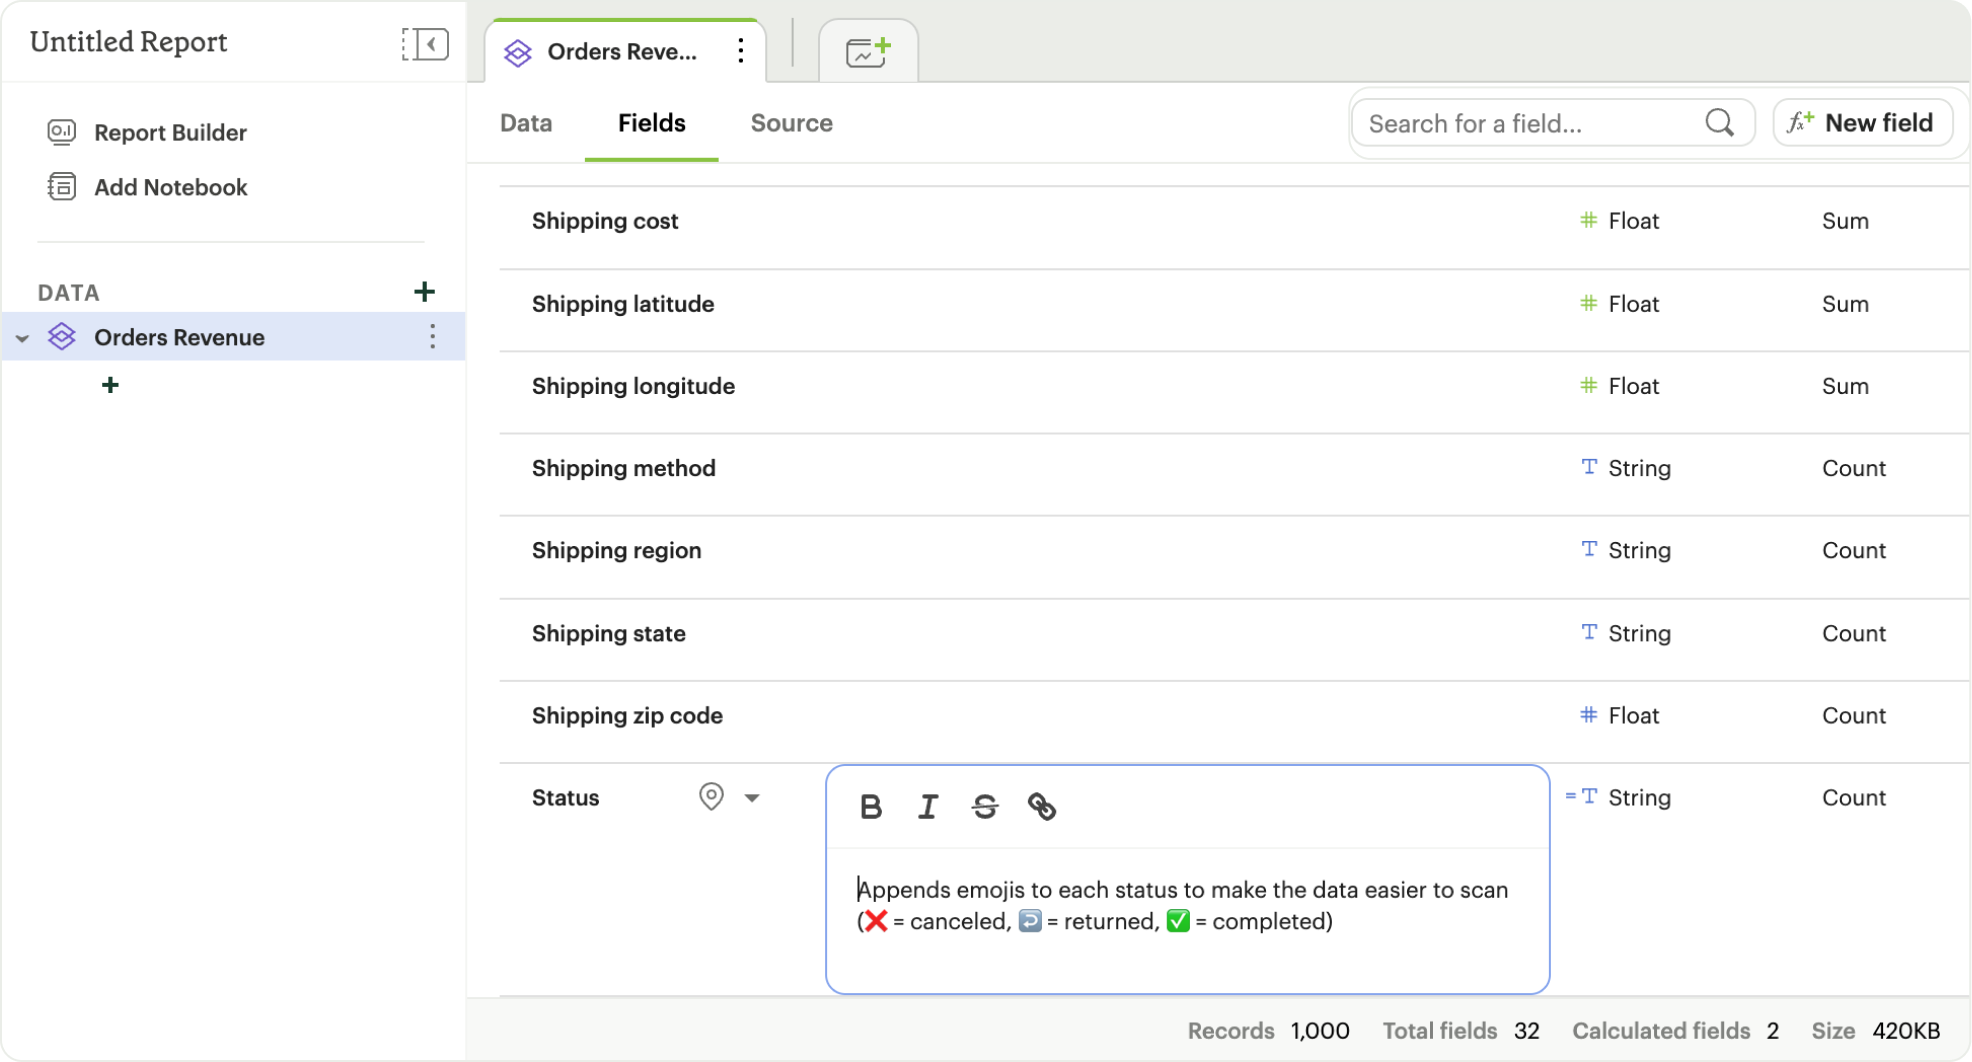
To add a new field description, edit any Dataset and navigate to its Fields tab. From here, double click on the row you’d like to edit. Descriptions support up to 350 characters, and text formatting such as bolding, italicizing, emojis, line breaks, and hyperlinks.
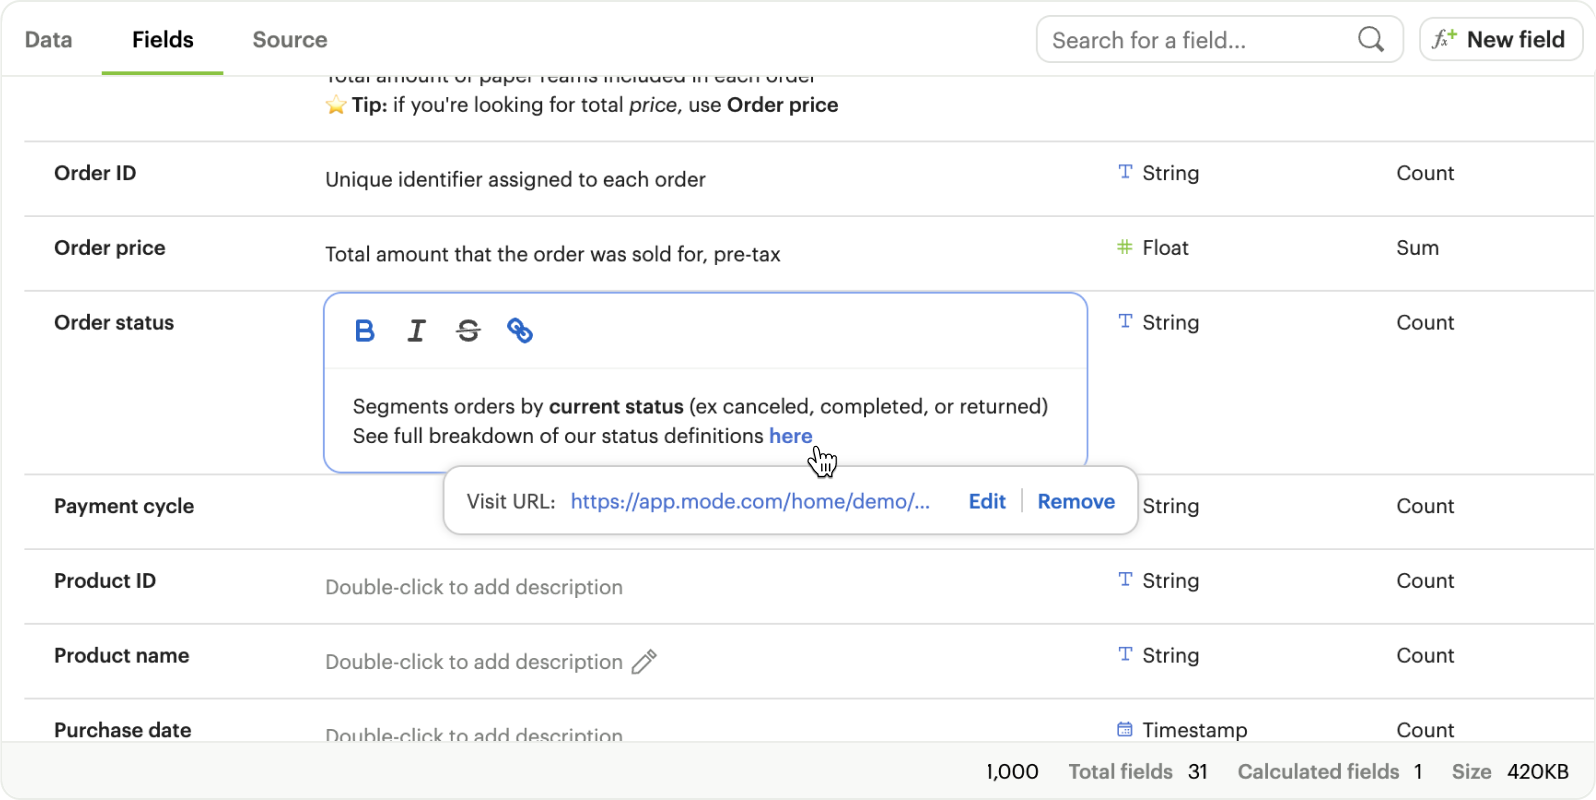
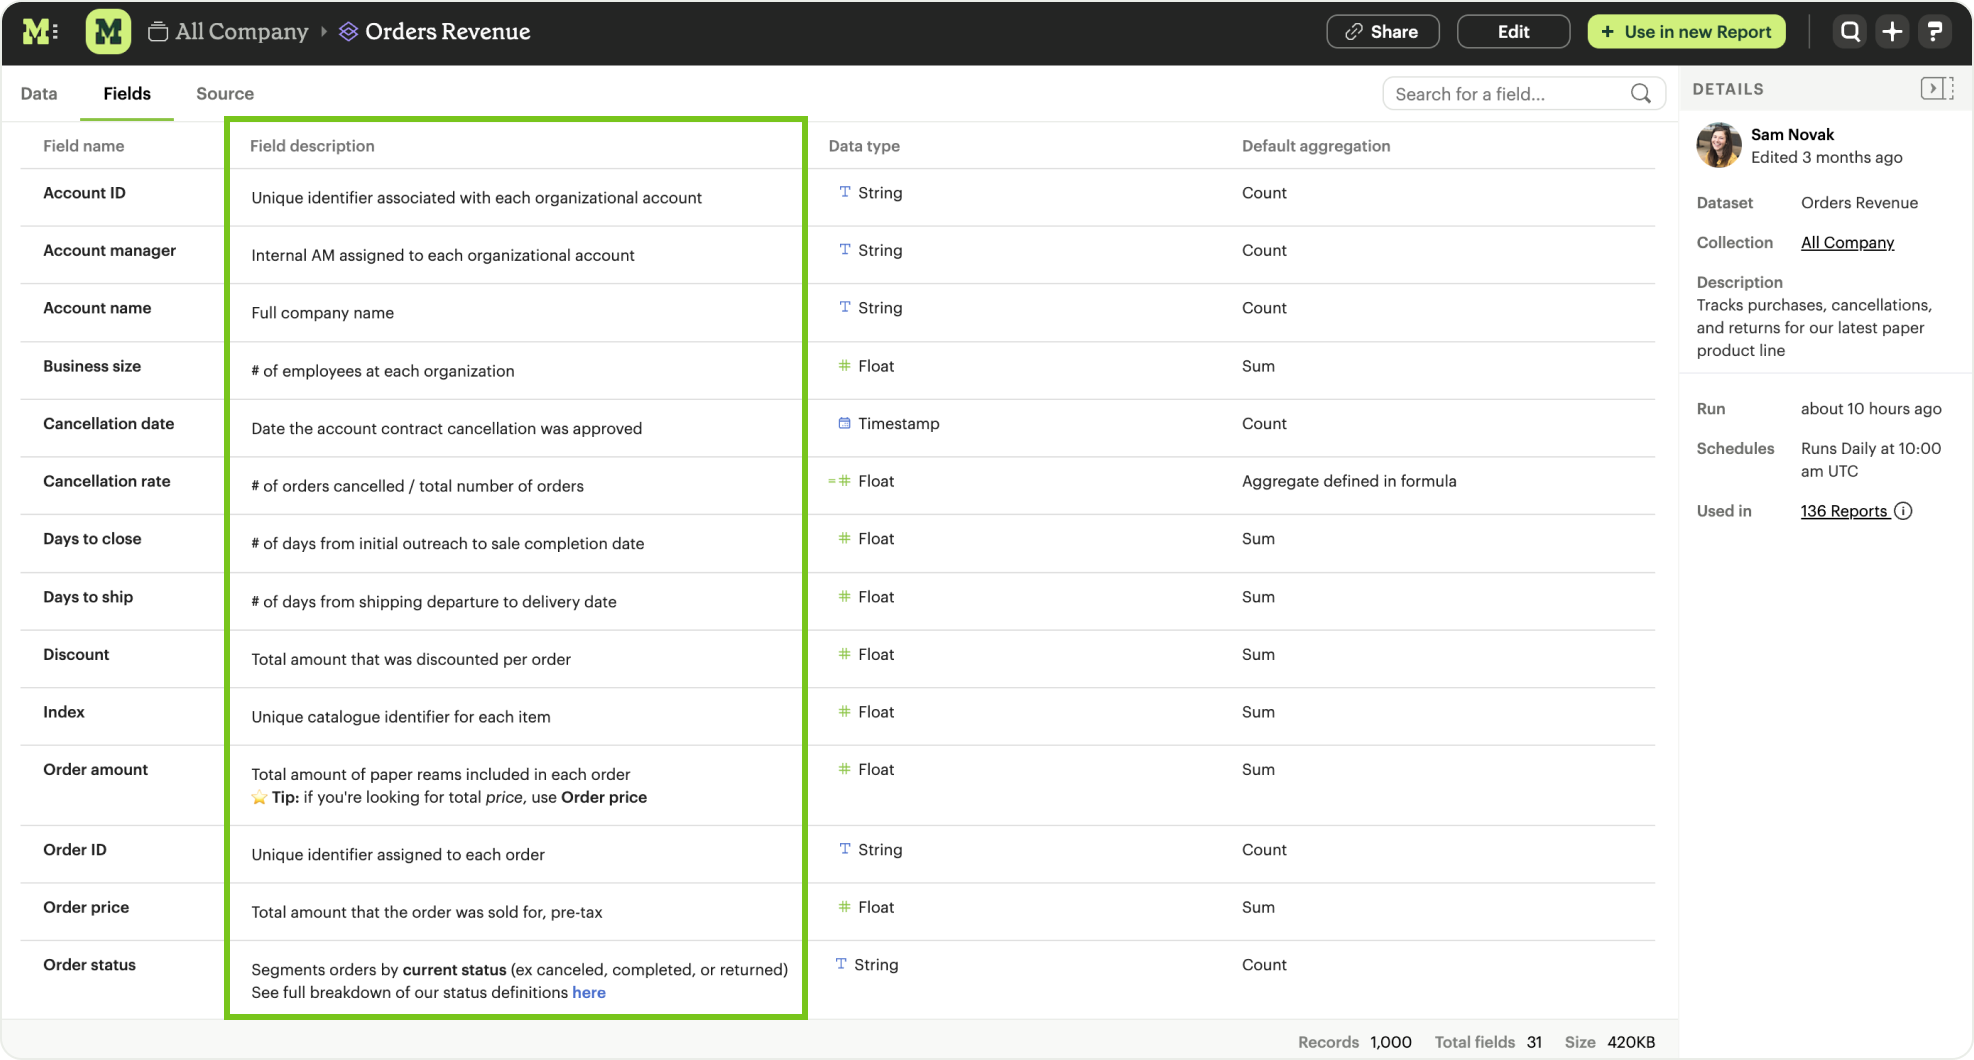
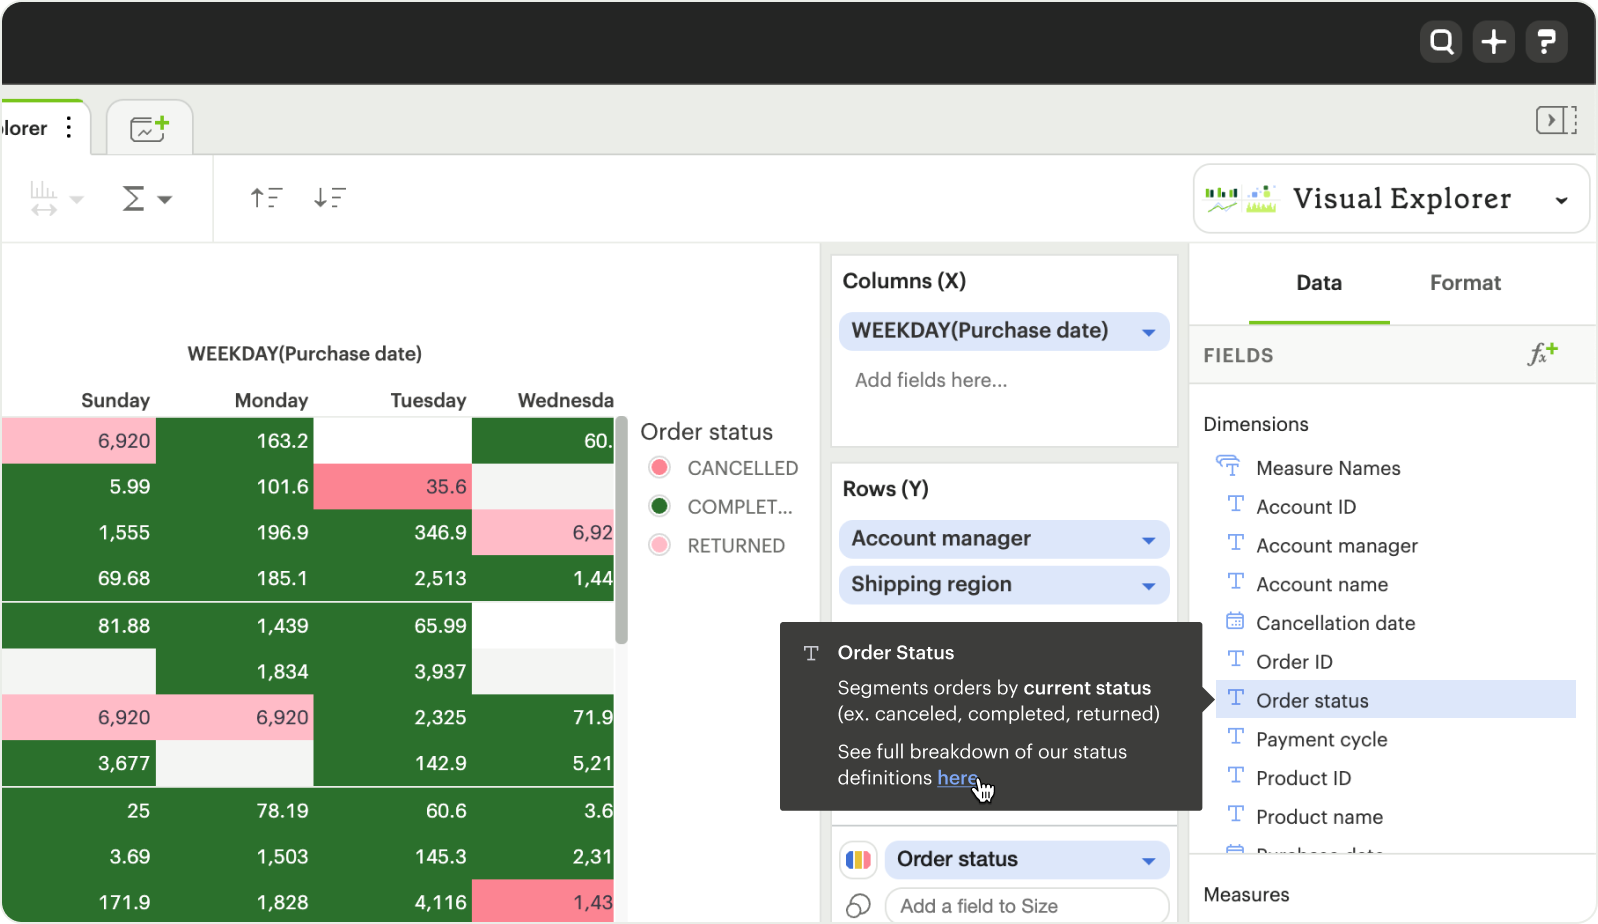
Once added, field descriptions will appear in the Fields tab of a Dataset and when hovering over the fields list in the chart builder.
Here are some use cases to think about when adding field descriptions to Dataset fields:
| Use case | Sample field | Sample Description |
|---|---|---|
| Shared understanding Codify business definitions and logic, especially when using calculated fields | Engagement rate | Calculates the % of users who are engaged, where engaged is defined as any user who has logged in and taken >1 action in the past 14 days |
| Expectation setting & data previews List out the possible values you’d expect the field to return | Order status | Segments orders by canceled, completed, or returned |
| Disambiguation Help colleagues quickly discern between fields with similar names or meaning, ex. Organization (business) vs Customer (user) | Order amount | Total amount of order supply placed per order, ex. 8 units of paper ⭐️ Tip: if you're looking for Total price, use Order price |
| Education Provide best practice and how-tos when charting. Consider including links out to sample Reports or charts | Total signups | Shows the total number of signups by week for every single row. ⚠️ Note: be careful when using to not overcount total signups. Use this field only when you have the data aggregated by week. See example chart here |
Adding calculated fields to the Dataset
You can add new calculated fields to the Dataset from the Fields tab. Doing so will add the calculated field to the list of available fields, and also make it available in any reports created from the Dataset.
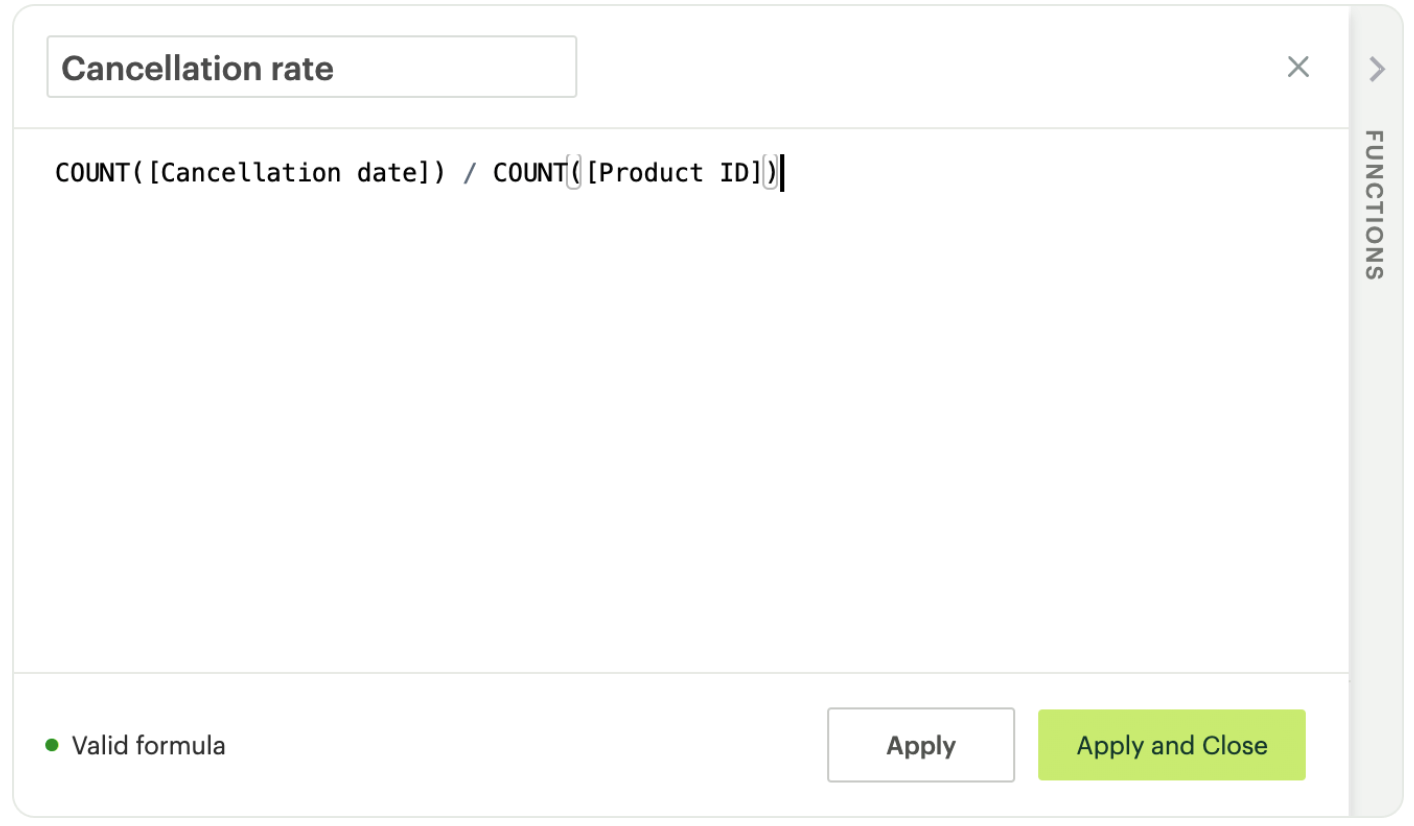
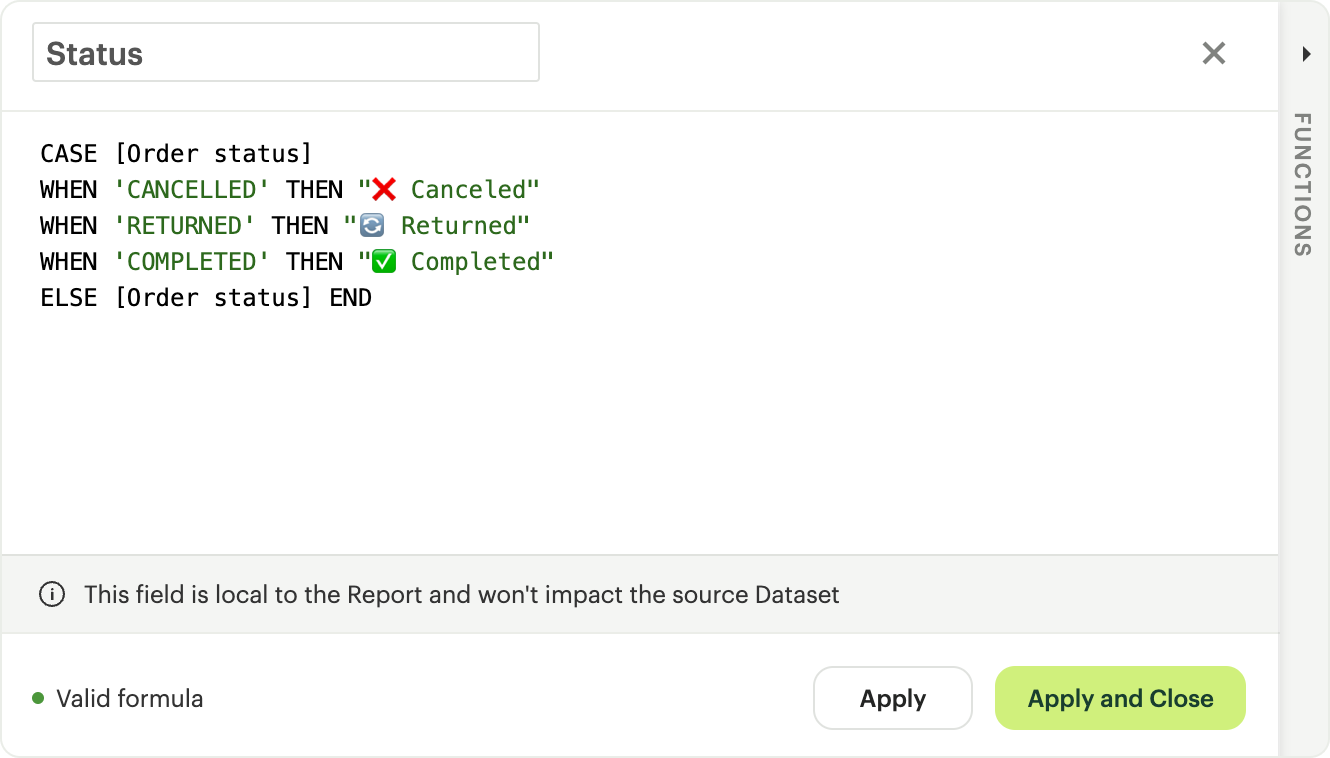
To add a new calculated field, first select the New field button.
Then enter the formula for your calculated field, along with adding a name. To save the calculated field, select the Apply & Close button.
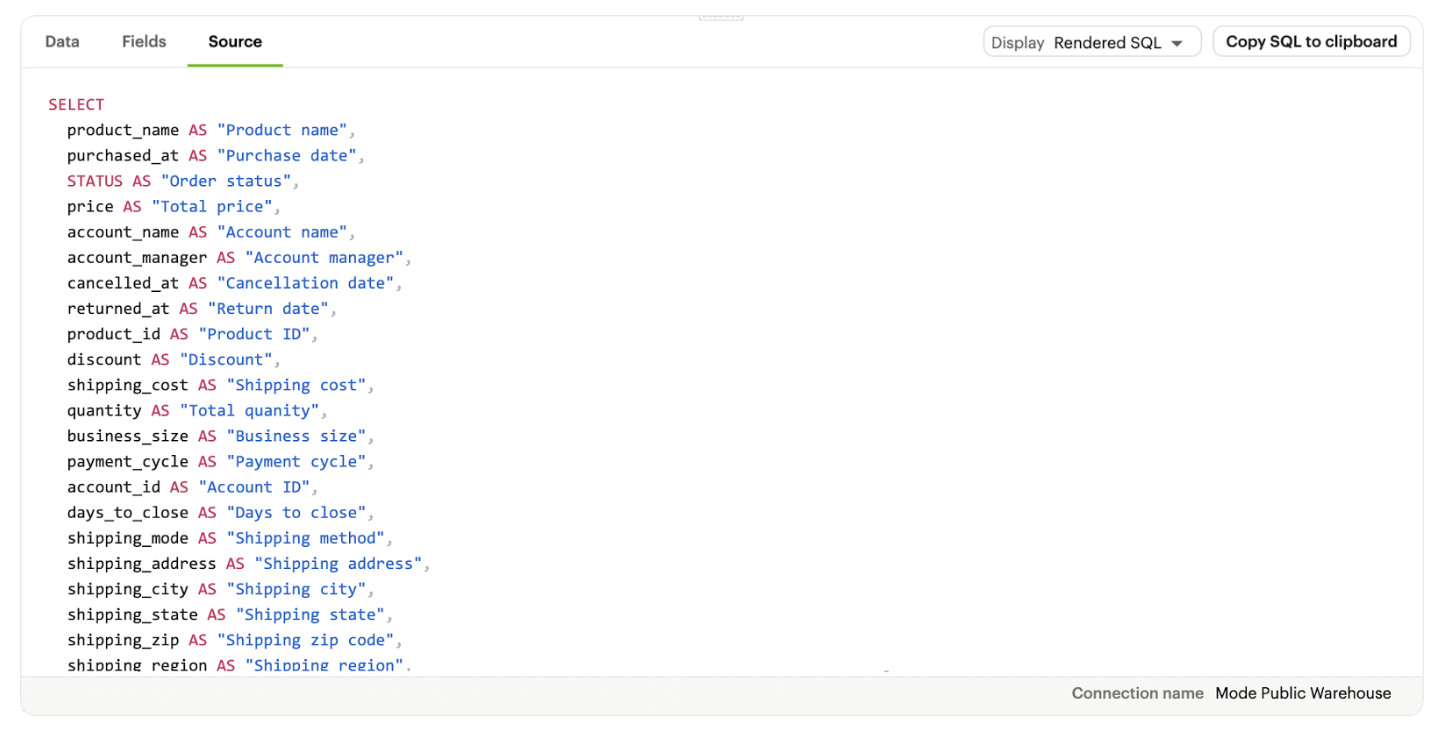
Viewing the source syntax
The source syntax of the query run can be accessed from the Source tab.
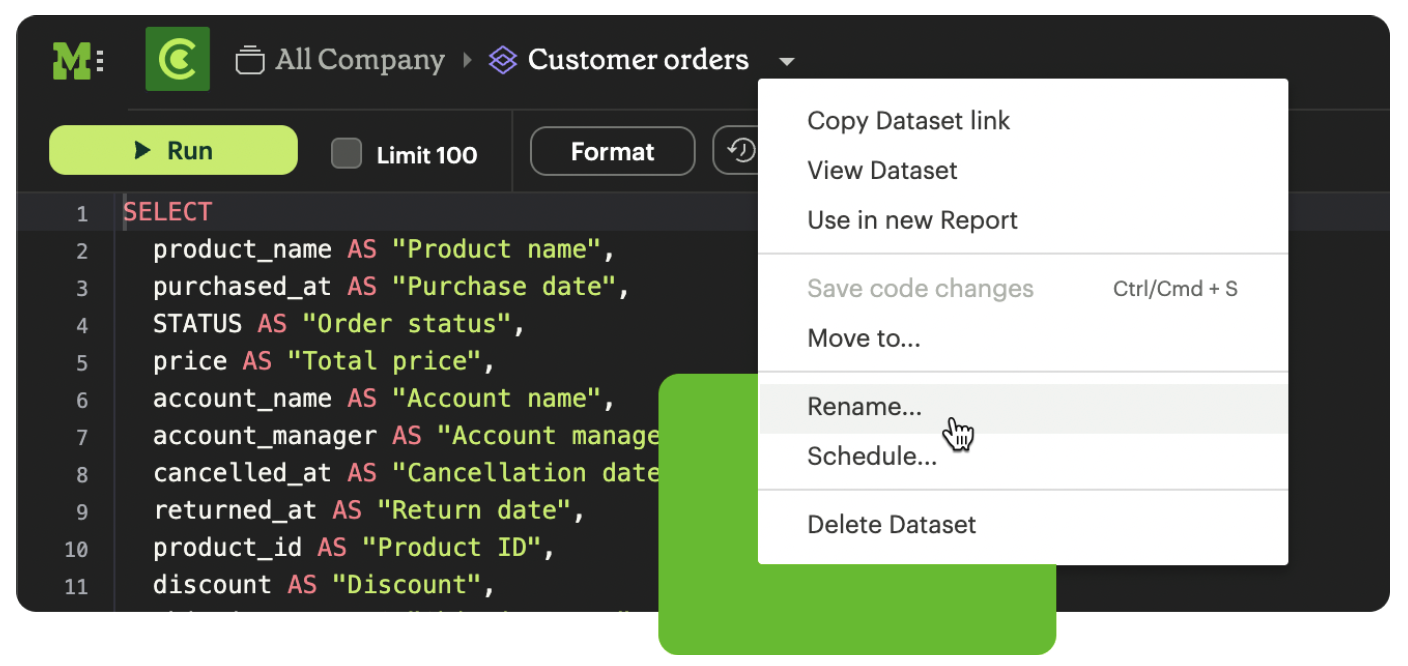
Adding a name & description to the Dataset
You can add a name and description to the Dataset. To do so, select the caret next to the placeholder name, “Untitled Dataset.” From the dropdown, select Rename.
Enter the desired Dataset name and description. Then select Save.
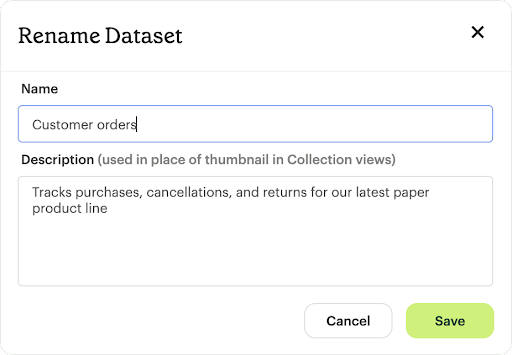
We recommend using consistent naming conventions and adding detailed descriptions to your datasets. Doing so will help other team members find and understand how to use the Dataset.
Scheduling a Dataset
You can set a schedule for your Dataset to refresh. When a dataset refreshes, all associated reports built using that dataset will receive a prompt to pull in the fresh data.
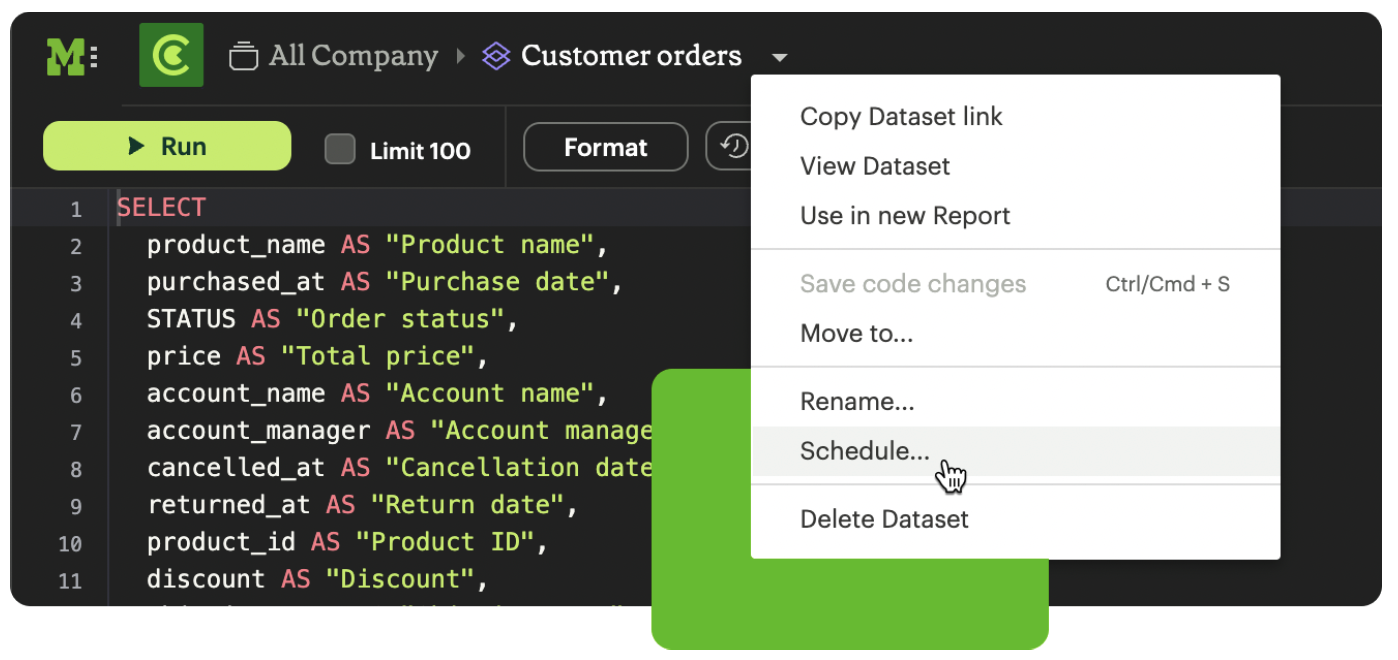
To create a new schedule, select the caret next to the dataset name and choose Schedule.
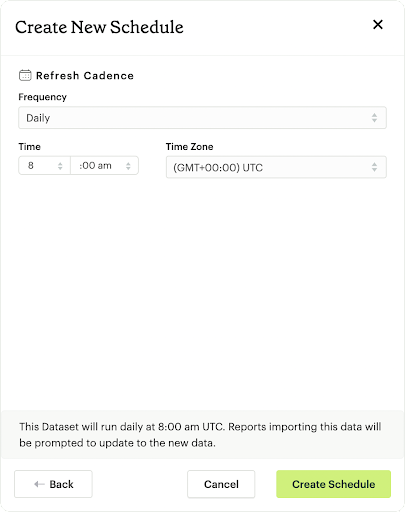
Then, select Create New Schedule to open the scheduling options. From here, you can set the refresh frequency, as well as the specific time and timezone.
Moving a Dataset to a Collection
The final step to create a dataset is to move the dataset into a Collection. You can think of this action as publishing the dataset, as it makes the dataset available for other team members to access and use it.
To move the dataset to a Collection, select the Move to a Collection button in the top right corner of the screen.
This will open a modal displaying all of the available Collections.
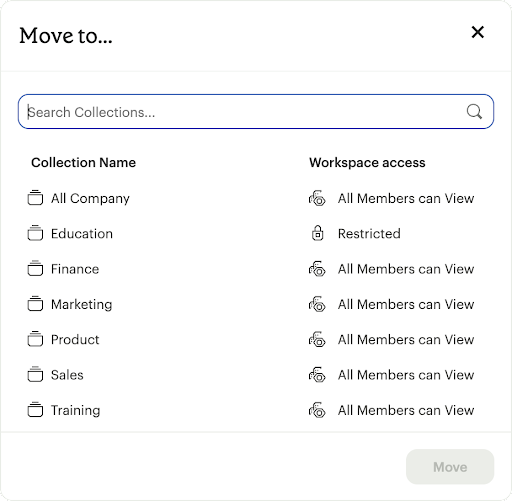
Select the Collection you want to add the dataset to, then select Move.
Viewing a created Dataset
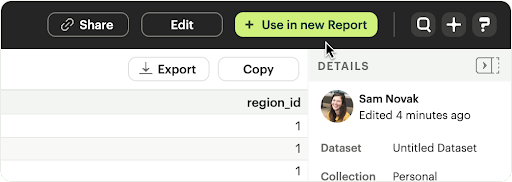
To view a dataset you’ve just created, select the View button in the top right corner of the screen.
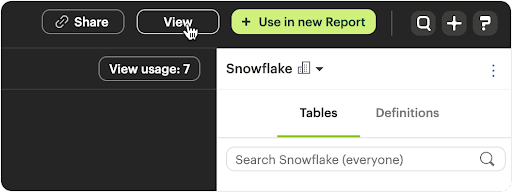
You will be able to view the Data, Fields and Source tabs, Dataset details, as well as export or copy the data from this view.
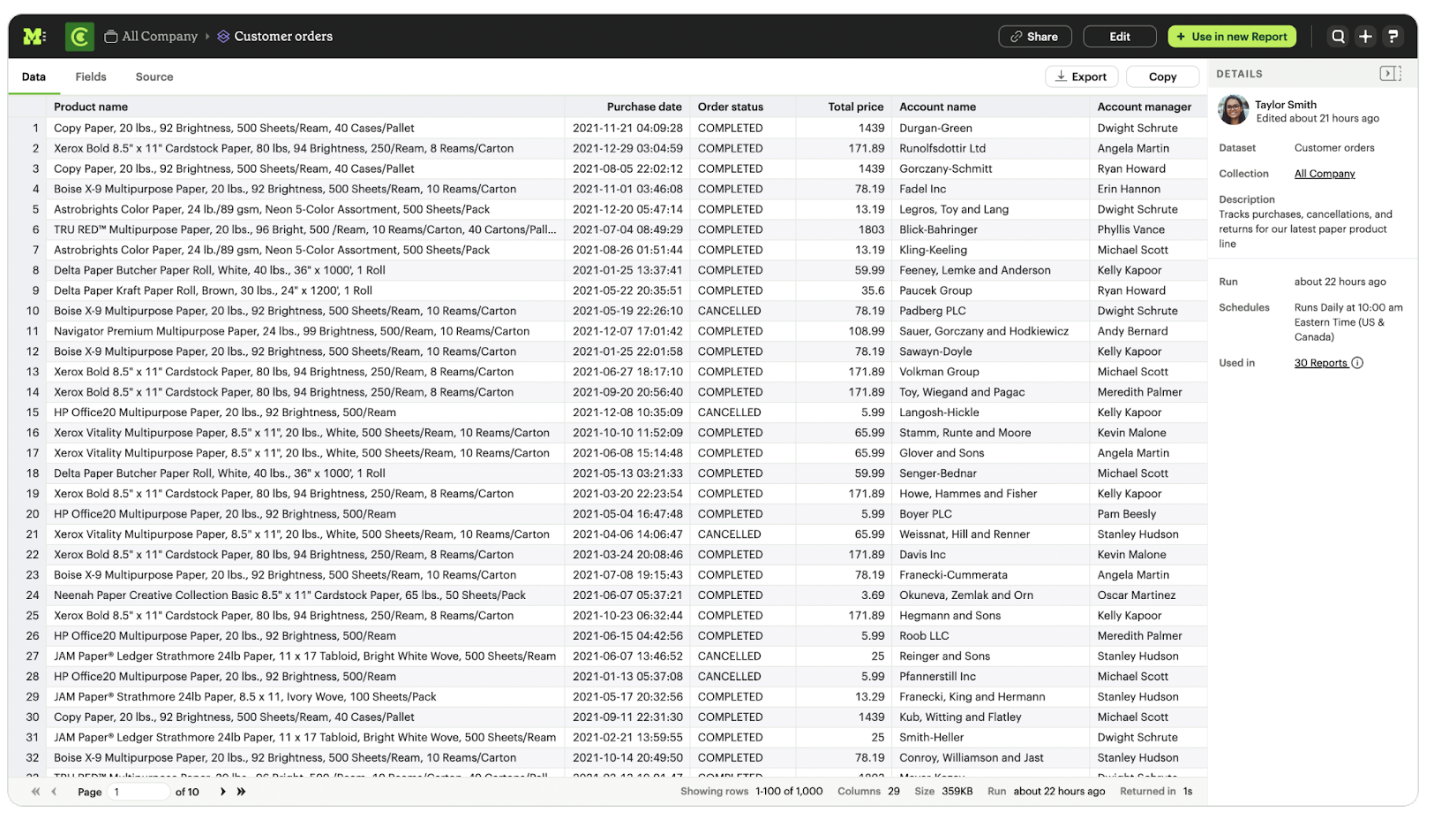
In the Details pane, you can see information about the Dataset including the Collection it lives in, description, when it was last run, any schedules it runs on, and which Reports are built from the Dataset. To view a list of Reports created from the Dataset, select the Used in link to open a modal displaying all child Reports.
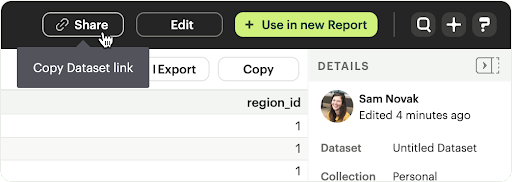
You can share the dataset with others on your team by selecting the Share button.
Or, if you’re ready to create a new report using this dataset, select the Use in new Report button.
This will create a new report with a flat table visualization added by default. You can filter and sort the data on the table visualization or create additional visualizations using the data in the dataset.
Dataset Permissions
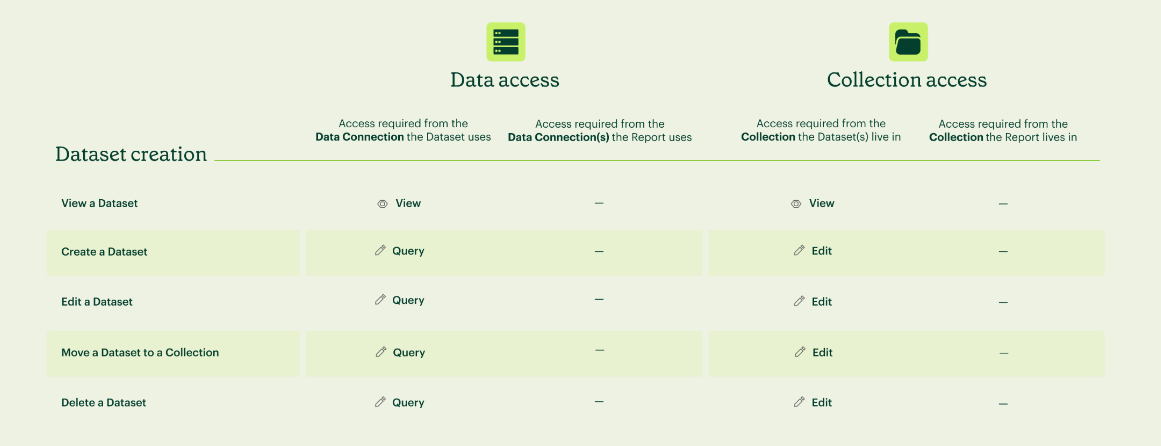
The following matrix explains how permissions and access to Connections and Collections effectively create permissions around Datasets.
Dataset access for creation
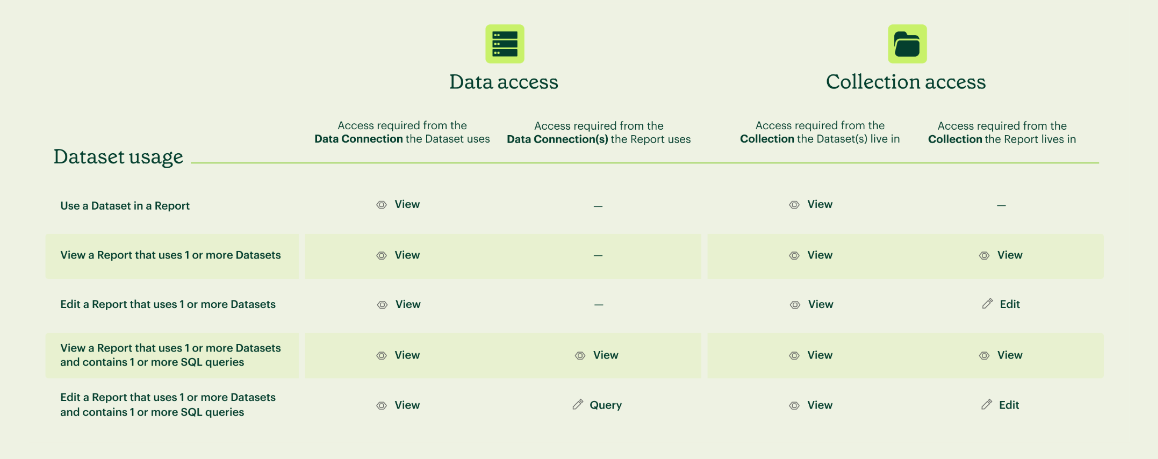
Dataset access for usage
You can learn more about creating a Dataset access and permissions strategy in this Mode University course, Dataset organization & permissions best practices.
Using Datasets in Reports
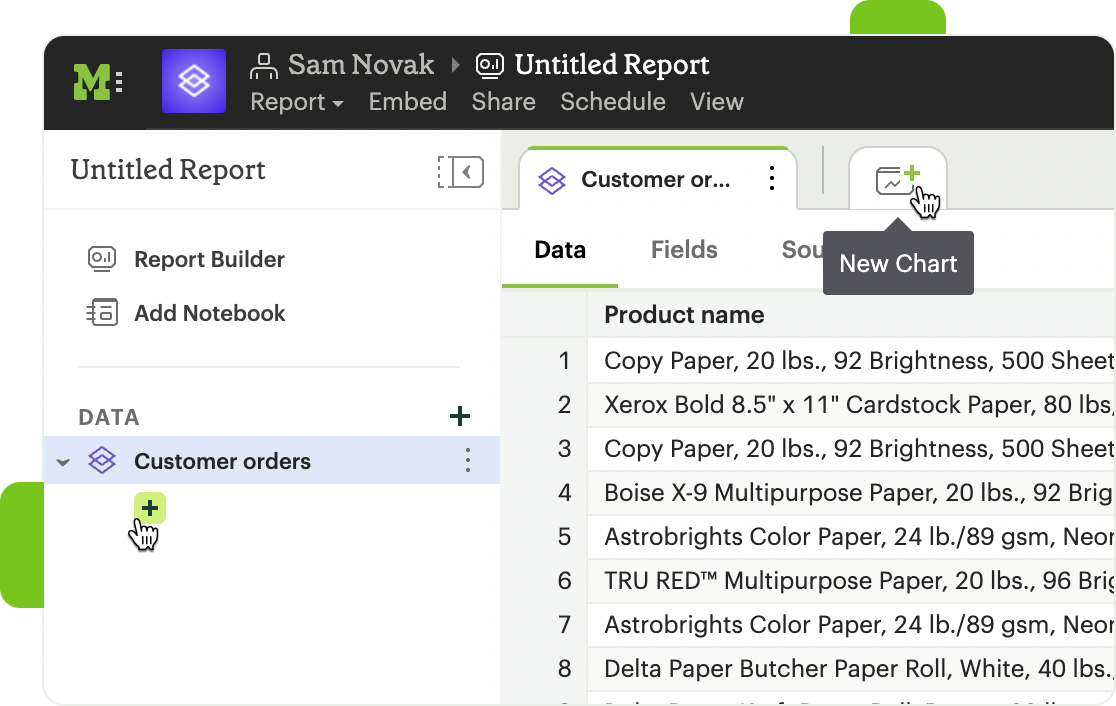
You can add a Dataset to any Report for which you have edit access. This is true whether the report was initially started with a SQL query, or another Dataset. To do so, open any Report in Edit mode and select the Add Data button from the left-side menu.
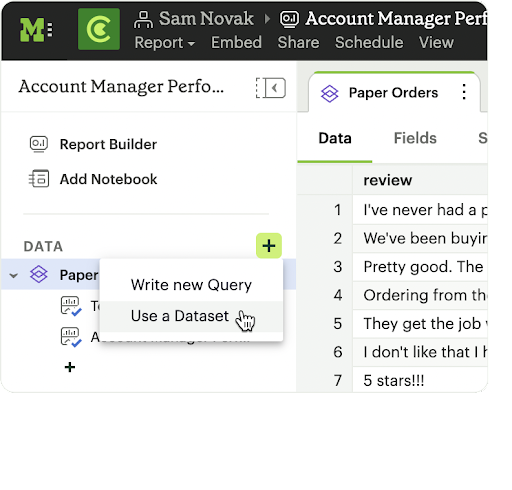
This will provide the options to add additional data via a new query, or using a Dataset. Select Use a Dataset.
This will open up a modal that allows you to browse existing Datasets to add to your Report.
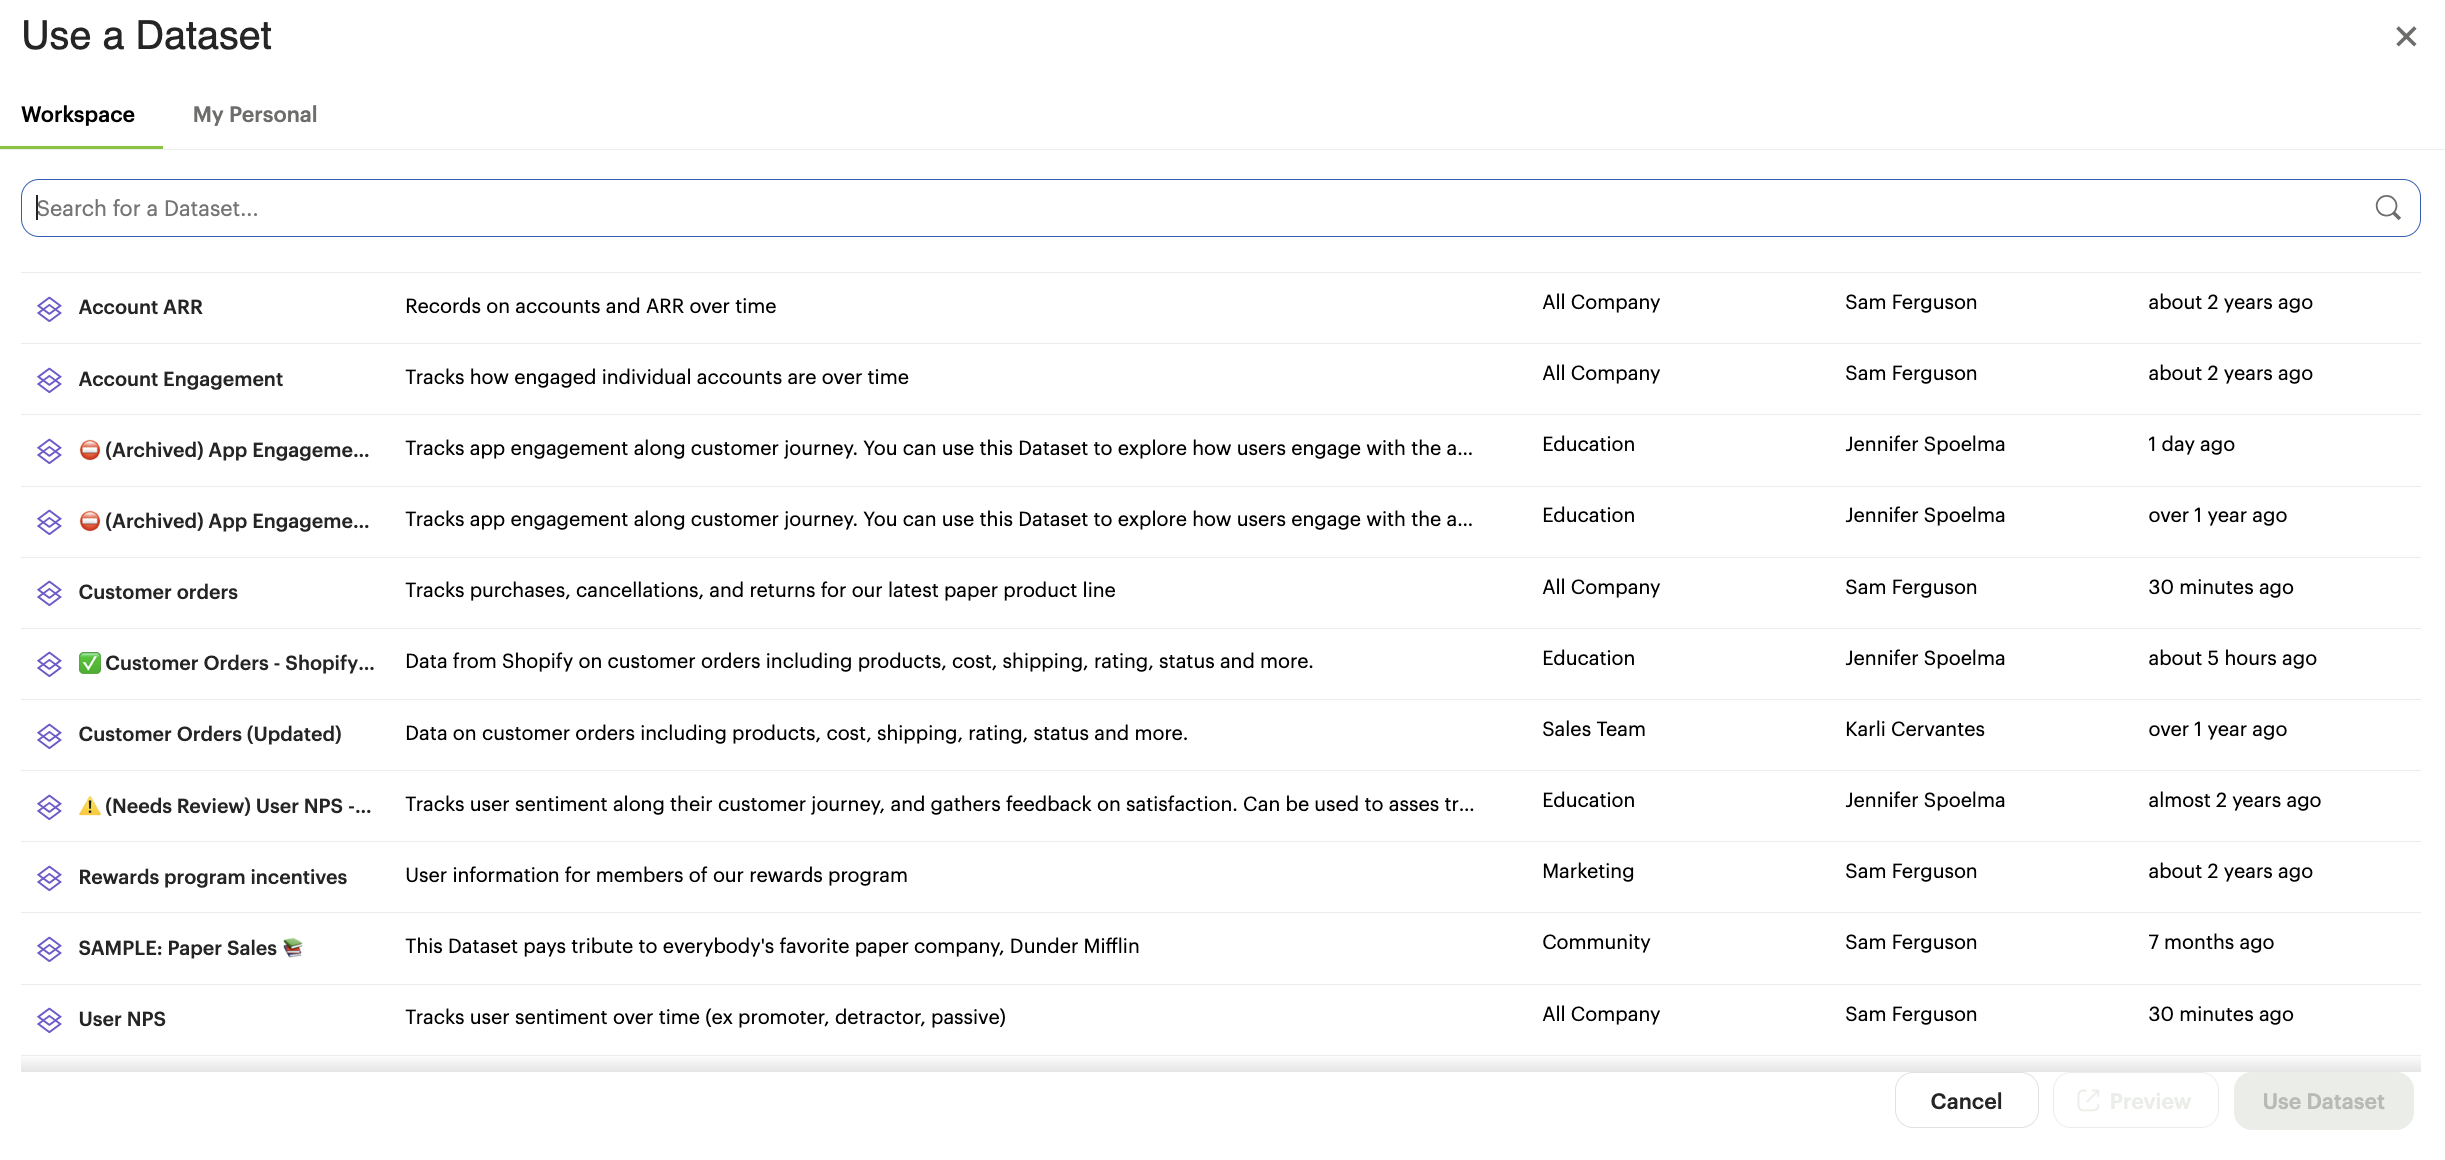
You can use the search bar to filter for a specific Dataset, then select the one you want to work with. Datasets from Workspace Collections you have access to will appear here. If you want to use your personal Datasets, you’ll need to click on the My Personal tab. Personal Datasets aren’t discoverable by other members. To make the data searchable, move it to a Workspace Collection.
Once you select a Dataset, it will be added to your Report. You’ll be able to view the data as well as begin building visualizations from it.
Starting a new Report from a Dataset
You can create a Report from a Dataset in one of two ways.
-
Creating a new Report using the Create button in the top header or the shortcut tile in My Work
This workflow is great when you know what data you want to analyze, and want to pull in the most relevant Dataset to use in your Report. -
Creating a new Report from the Dataset
This workflow is great when you’ve found a Dataset that you’d like to explore and analyze further.
Creating a Report from the Create button or shortcut tile
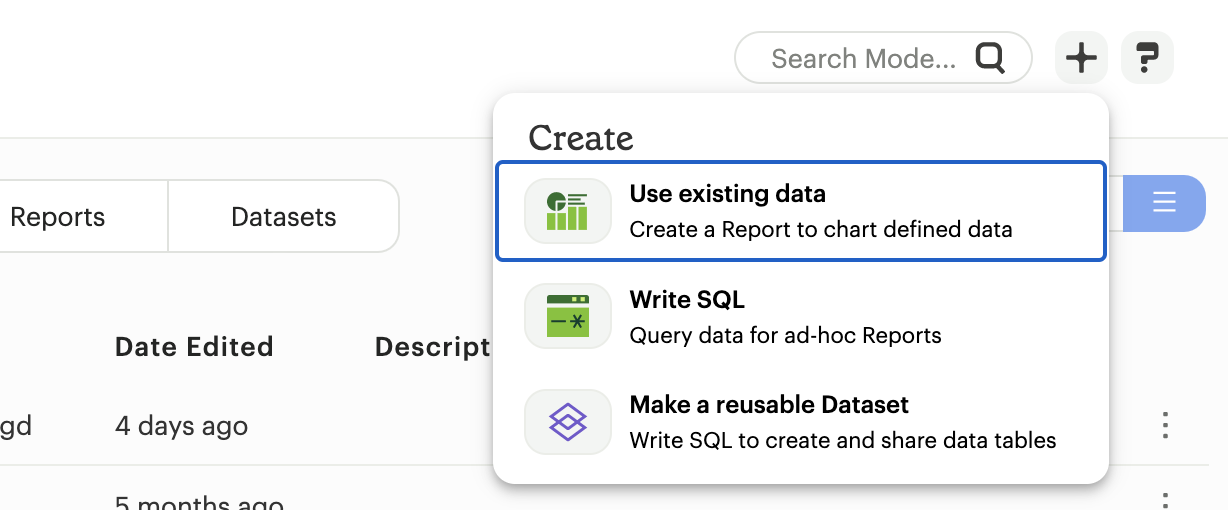
To create a new report, select the Create button in the Mode header, and choose Use existing data.
Alternatively, go to My Work on the left nav and click the shortcut tile for Use existing data.
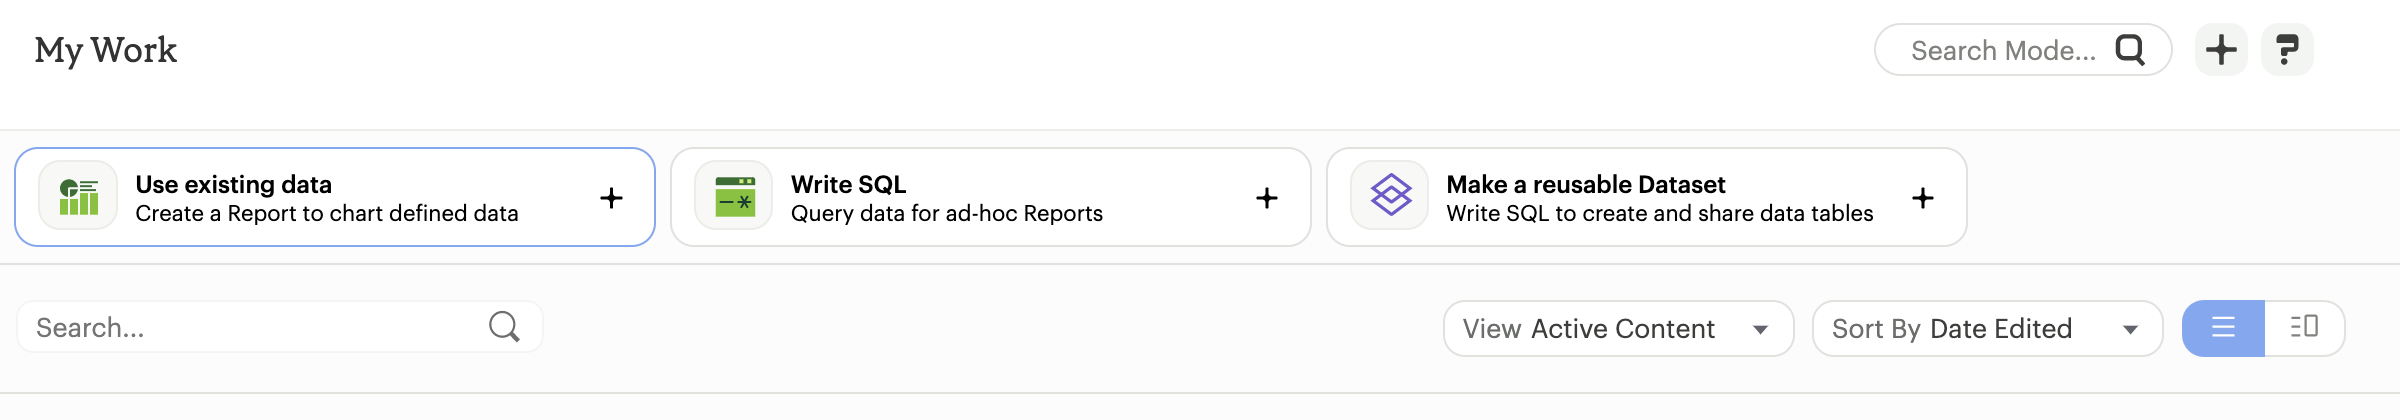
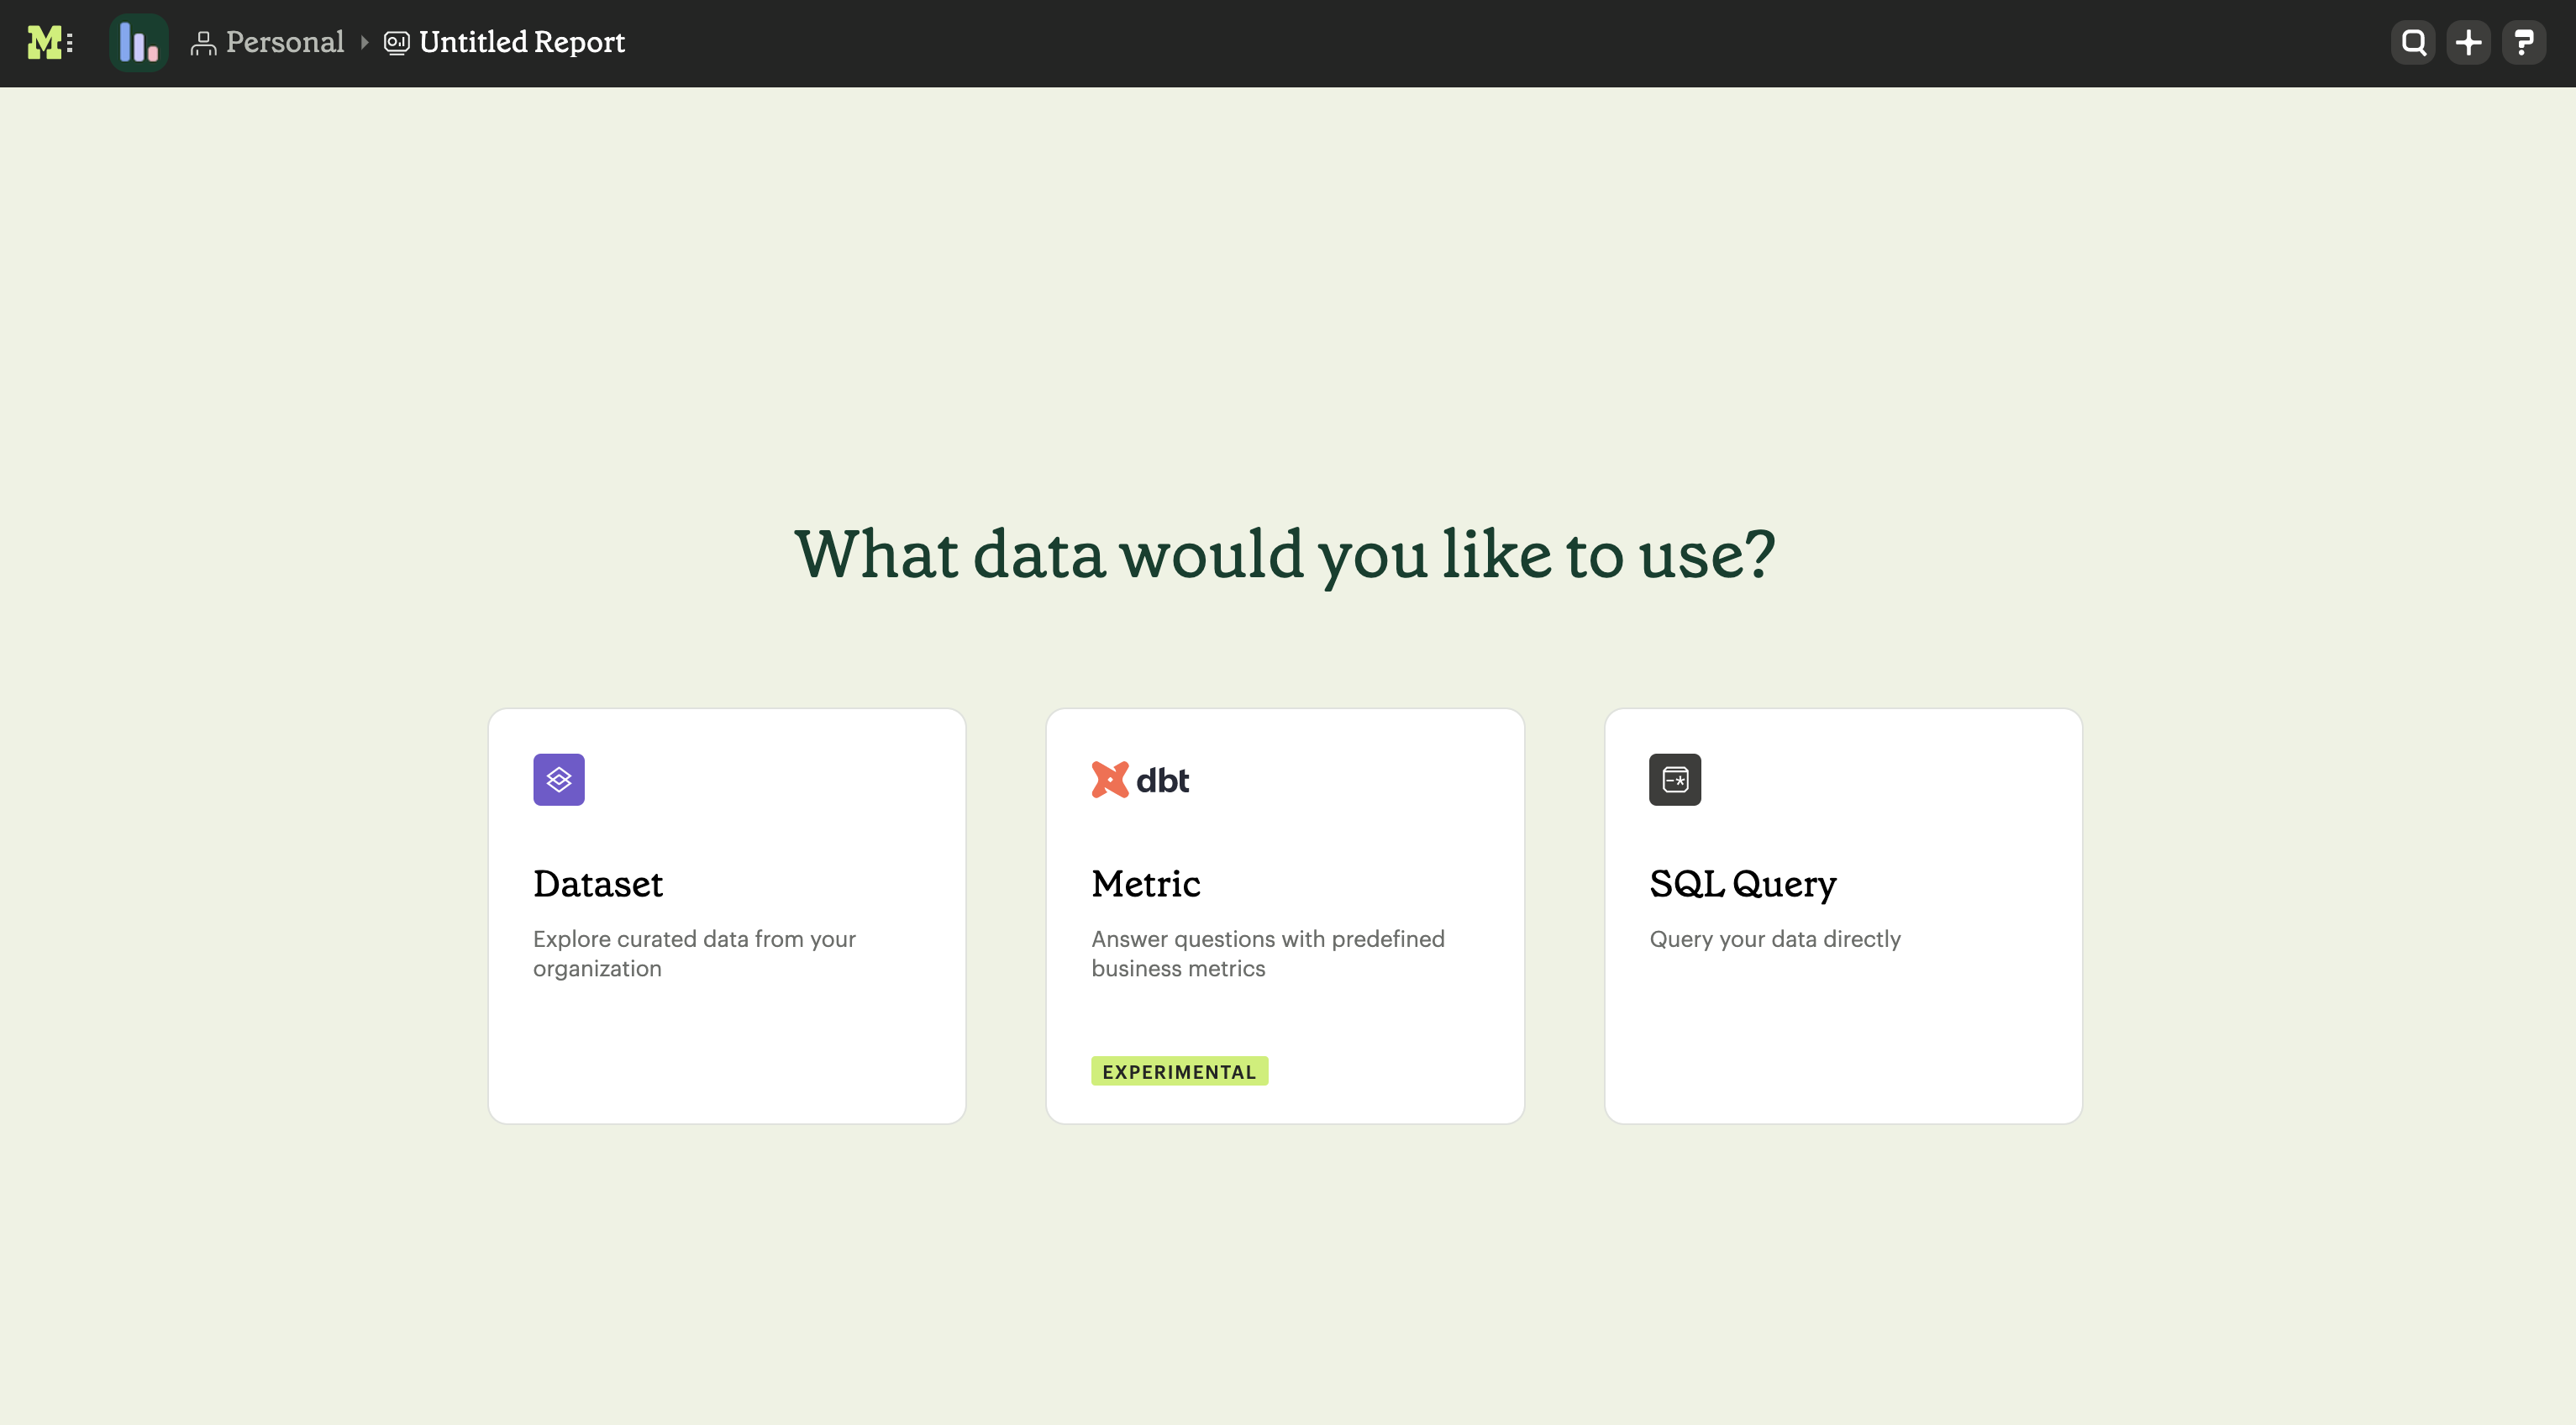
If you have more than one option besides SQL, you will be prompted to choose how you want to start your Report. Select Dataset.
Otherwise, this will open up a modal that allows you to browse existing Datasets to use as the foundation of your Report.
You can use the search bar to filter for a specific Dataset, then select the one you want to work with.
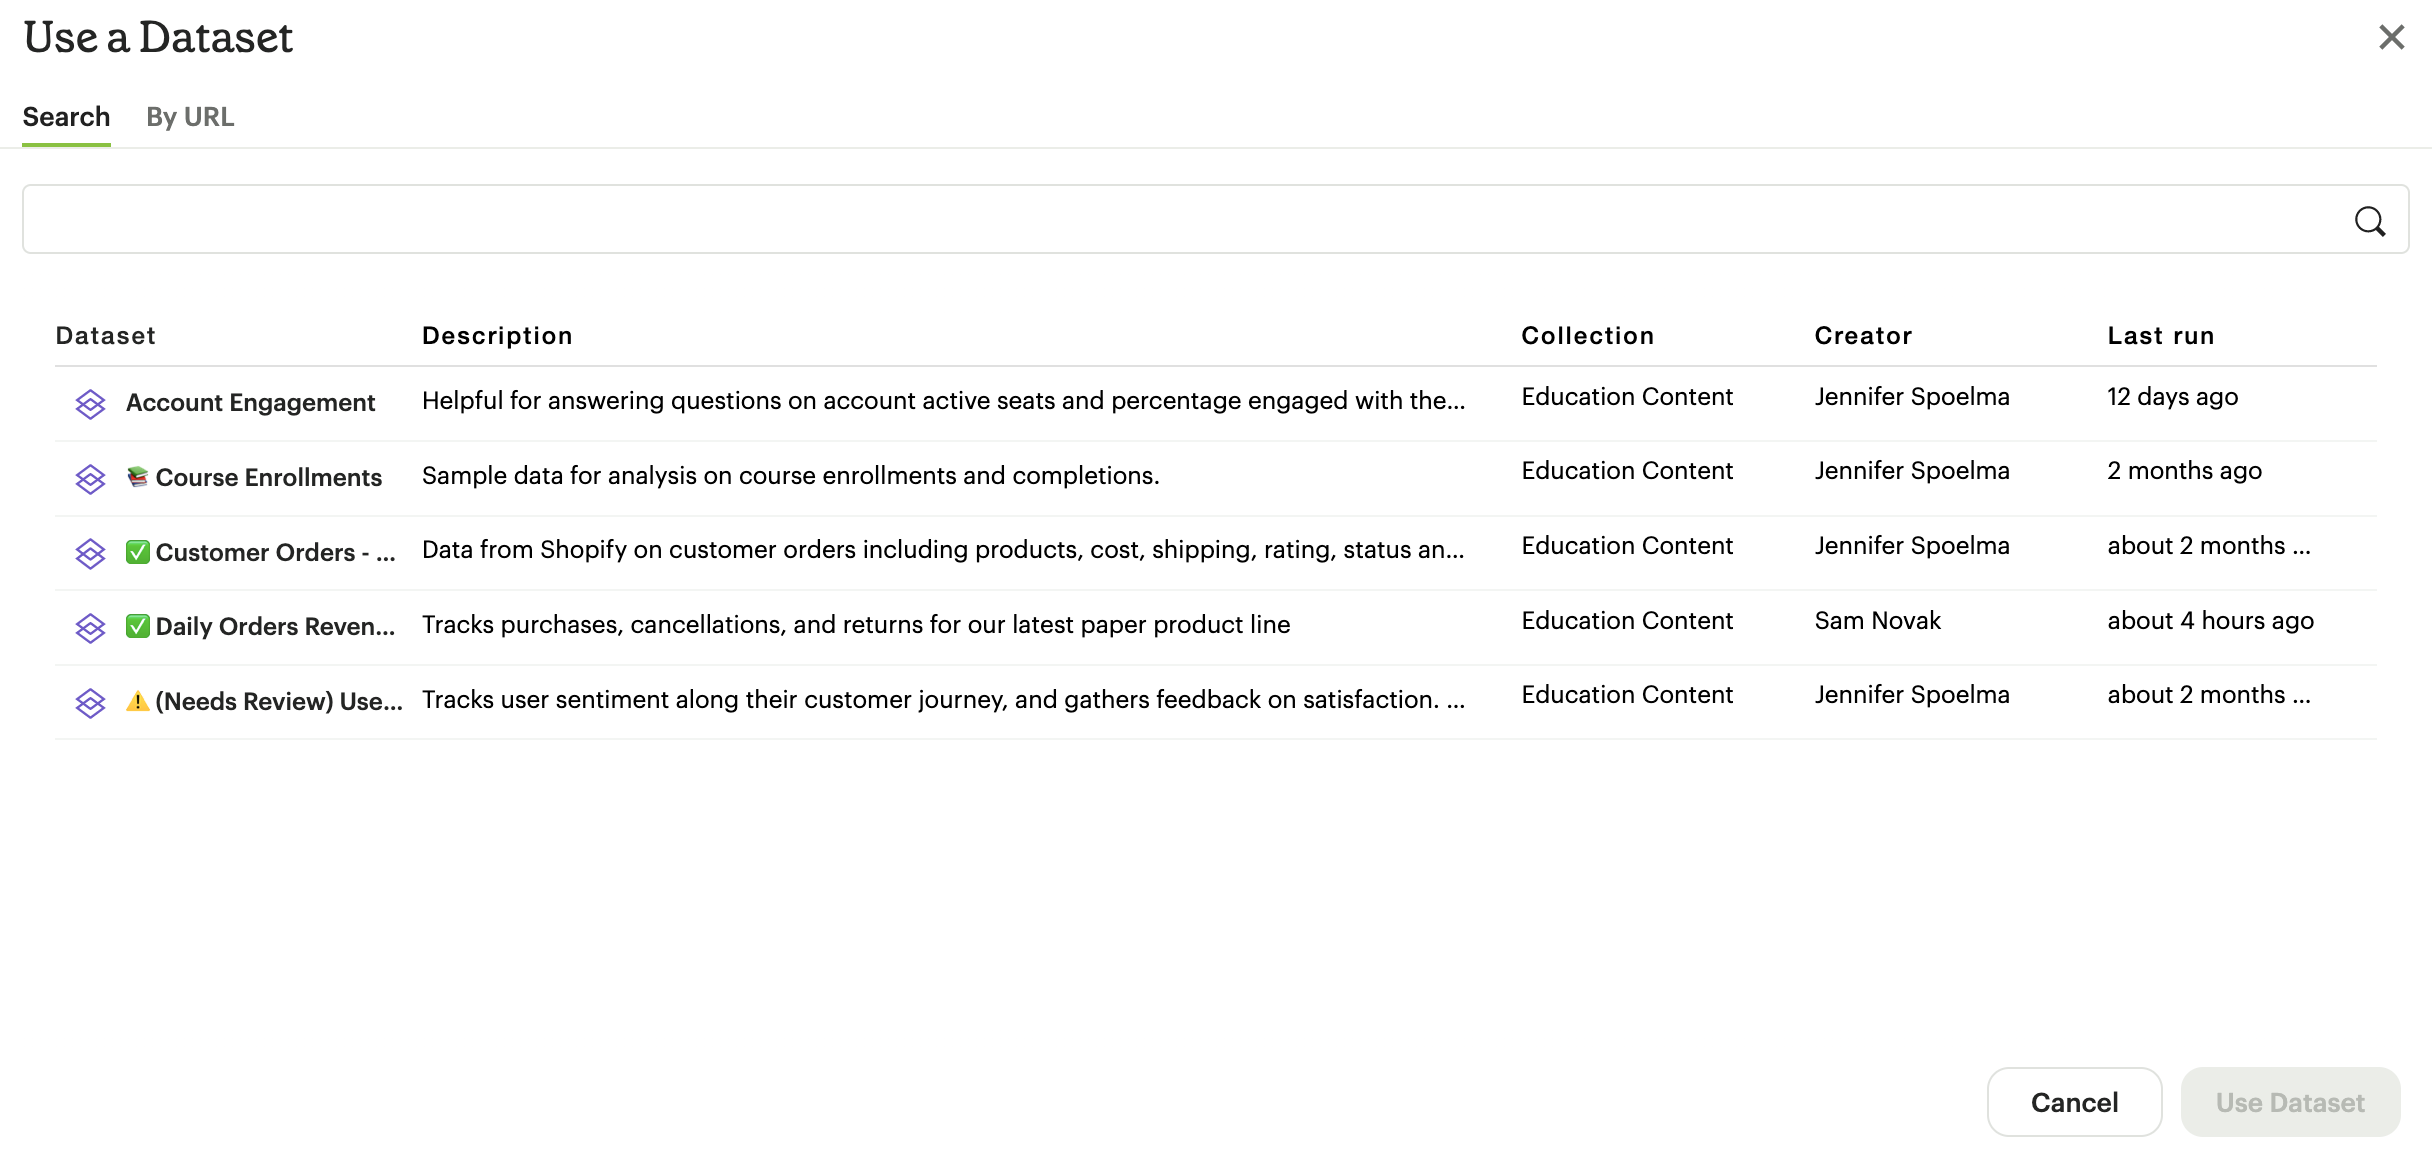
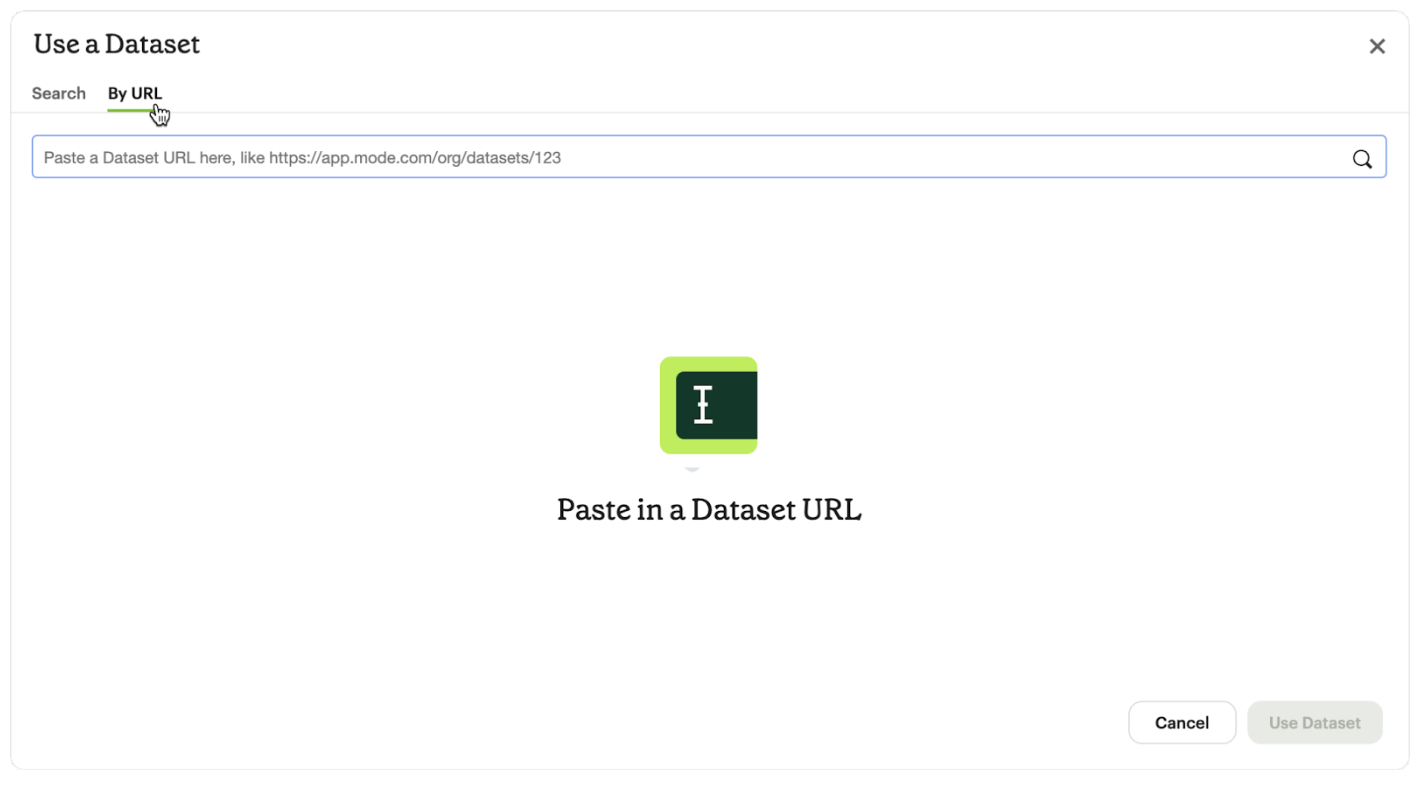
Datasets from Workspace Collections you have access to will appear here. If you want to use a personal Dataset, you’ll need to use the By URL option and paste the URL in the search bar.
Selecting a Dataset will open it.
Creating a Report from the Dataset view
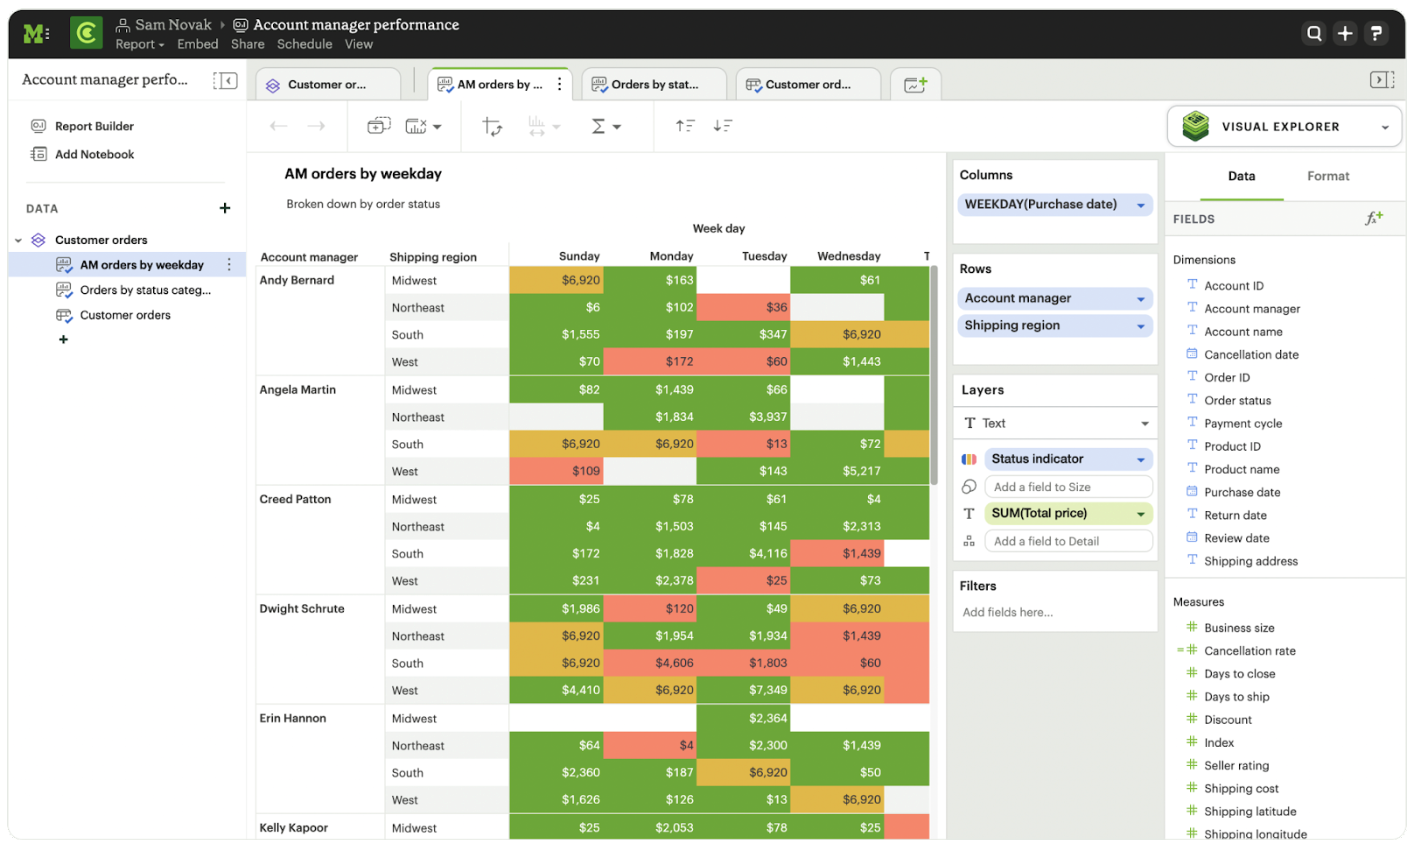
You can start a new Report while viewing a Dataset. From the Dataset view, select the green Use in new Report button from the top menu.
This will create a new Report that you can start exploring and adding new visualizations to.
Personalizing the Dataset
From the Dataset, you can start to explore by browsing the fields and adding your own custom functions on the fly.
To add a function, navigate to the Fields tab and click the New Field button.
Enter the function for your calculated field, and give it a name. To save the field, select the Apply & Close button. The field will be saved locally to your Report, allowing you to personalize your view of the data without impacting the original Dataset.
To describe your own local fields, double click on the row for a given field within the Fields tab.
Field descriptions support up to 350 characters, and text formatting such as bolding, italicizing, emojis, line breaks, and hyperlinks.
Descriptions you add to your local fields will appear when hovering over the fields list in the chart builder, alongside any other field descriptions that were added directly to the source Dataset.
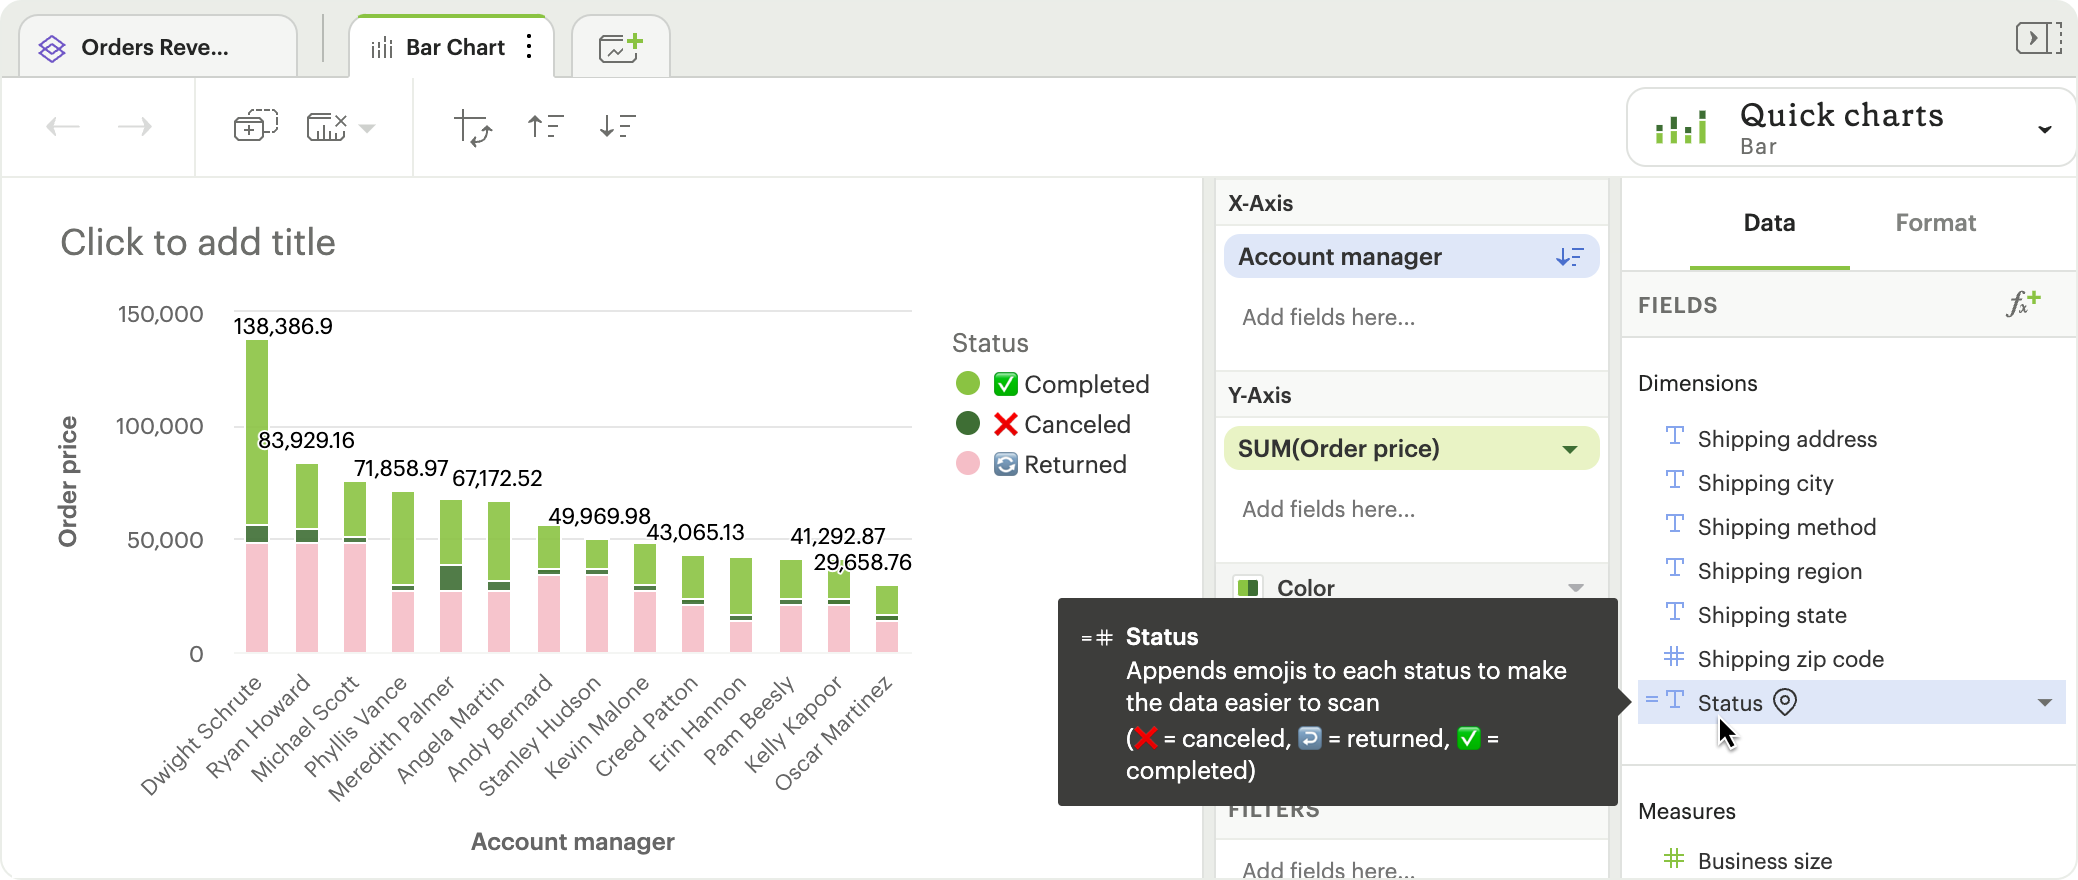
Creating charts using Dataset data
From the Dataset, you can start to explore by browsing the fields and adding custom functions on the fly. This allows you to personalize your view of the data without impacting the original Dataset.
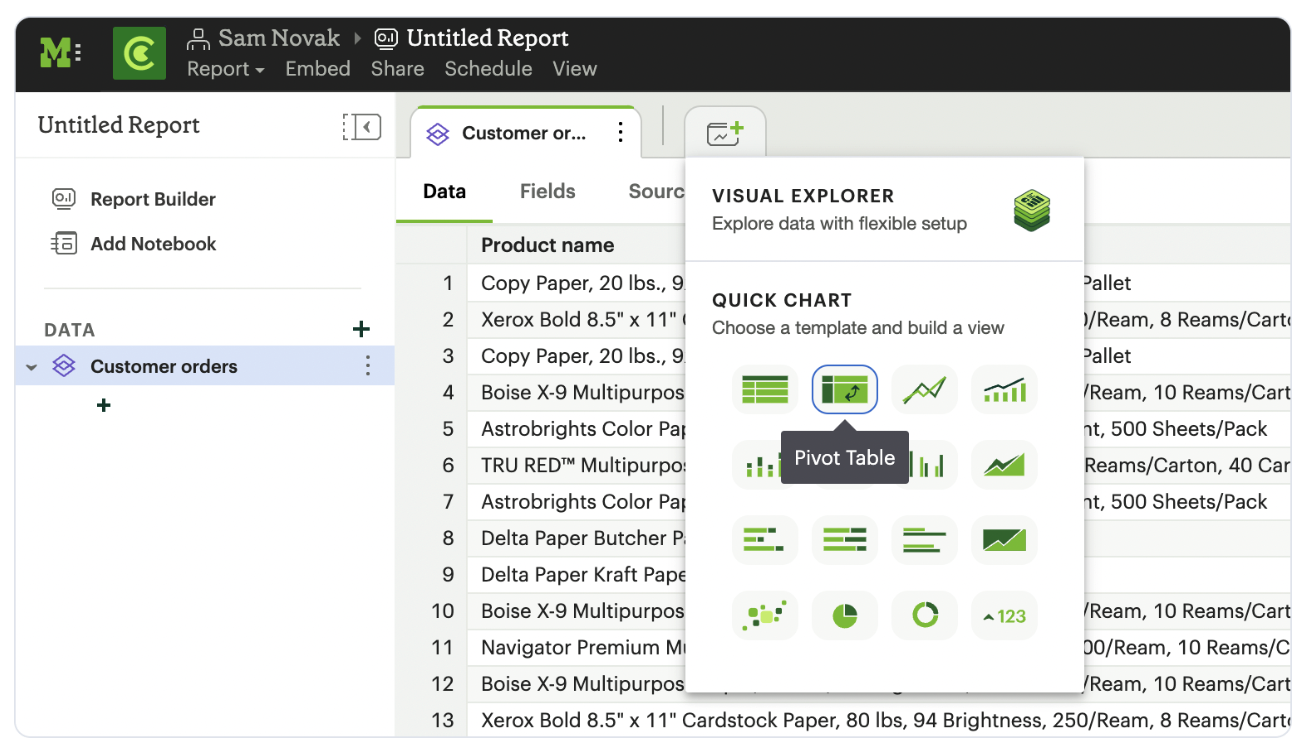
To explore the data visually, select the New Chart button from either the top menu or left-side menu.
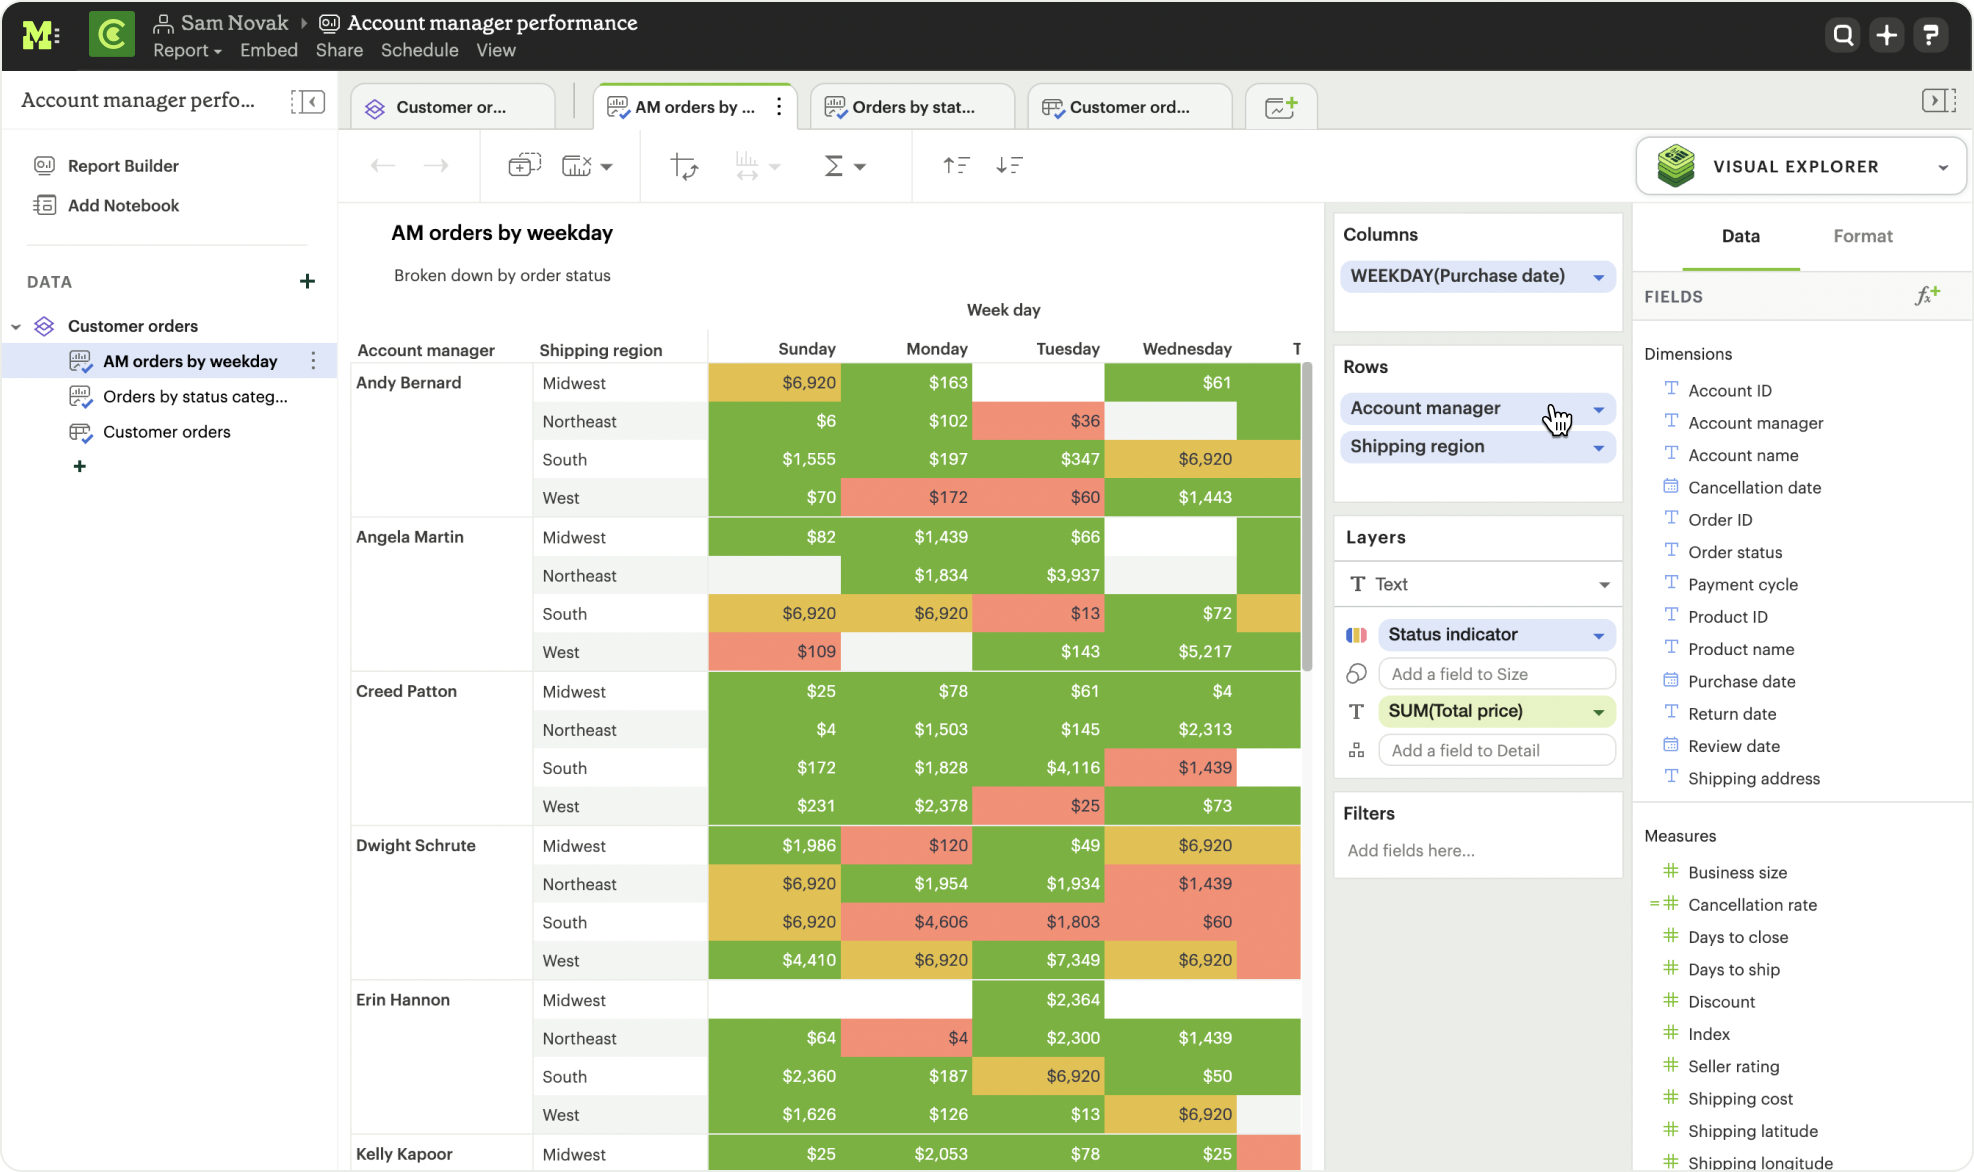
Choose the chart type you want to create. Doing so will open the visualization builder. From here, you can drag and drop the fields you want to analyze to create your chart.
Move charts from queries to Datasets
User can copy charts previously created off ad hoc queries to a reusable Dataset using a simple copy-paste action. Only one chart can be copied at a time.
- Copy chart to Mode clipboard: The copy to Mode clipboard option is accessible via the kebob menu, located on the left-hand side navigation panel within the chart designer.
- Paste chart from Mode clipboard: The paste from Mode clipboard action is available in the kebob menu for each data source in the chart designer. The fields that are required for the copied charts but are missing from the Dataset will be displayed as red pills. The user can switch out the red pills with relevant fields from the Dataset.
- Replace fields in the pasted chart: Users can drag fields directly on top of the field to be replaced in Visual Explorer and in Quick Chart dropzones that accept a single field. For Quick Chart dropzones that accept more than one field, the new field can be added to the shelf and the old field can be dragged out to be removed. The typeahead search in the dropzones can also be used to add the new fields.
Move a chart created off a query to a Report with the Dataset
Adding charts to the report builder
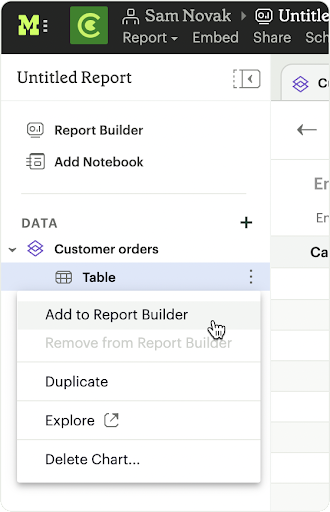
To add your charts to the report builder, select the chart’s context menu from either the top menu or left-side menu. Then choose Add to Report Builder.
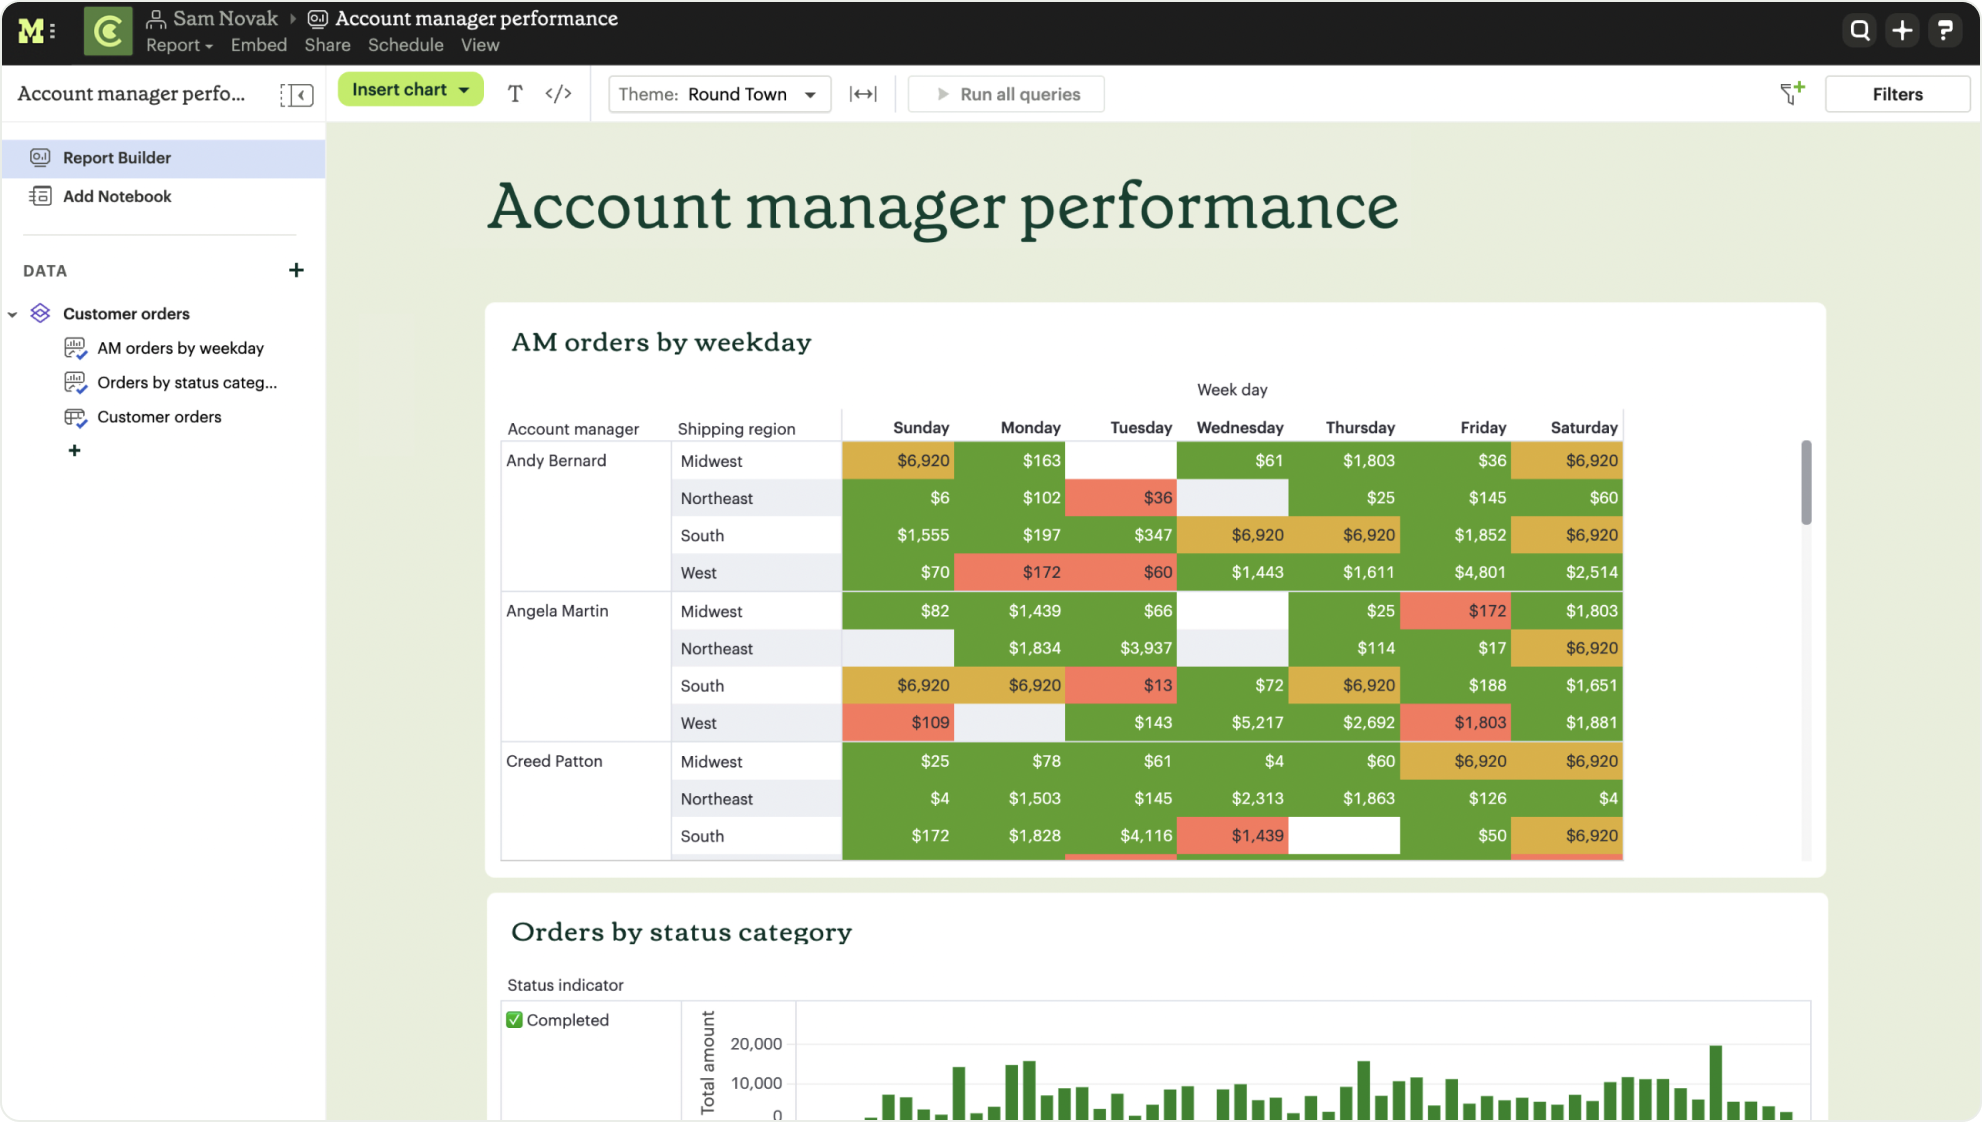
You can access the report builder by selecting Report Builder from the left-side menu. Once in the Report Builder, you can configure the layout and customize the look and feel of your Report.
You can add filters to your Report to allow viewers to slice the data in different views. You can learn more about using Report filters in this help doc.
You can learn more about using the report builder in this help doc.
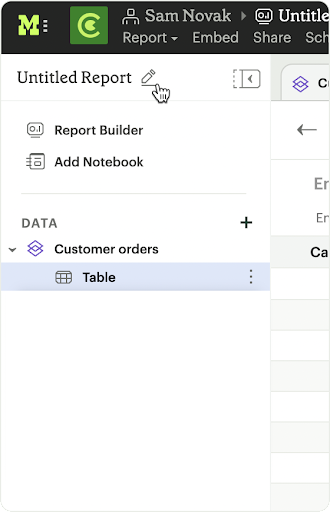
To give your Report a name, hover over the Report title in the navigation panel and click on the pencil icon. This will open a modal where you can give the Report a name and description.
By default, the report will live in your personal collection. To move it to a different collection, select the dropdown menu next to Report, then choose Move to.
A window will appear displaying an option to create a new collection, or to select from any collections you have access to.
Once you choose where to move the report to, you will be able to find the report in that collection. Anyone else with access to the collection will also be able to see and find the report.
Learn more about organizing and managing reports in collections in this help doc.
Learn more about sharing reports in this help doc.
Refreshing data in a Dataset-based Report
Datasets run independently of Reports. When you run your Report or refresh an individual Dataset, Mode will check to see if there’s a newer Dataset run available, load it in, and snapshot its results within your Report’s Run History.
There is a badge in the Report edit view notifying you that a fresher run is available, so you know when to refresh the Report.
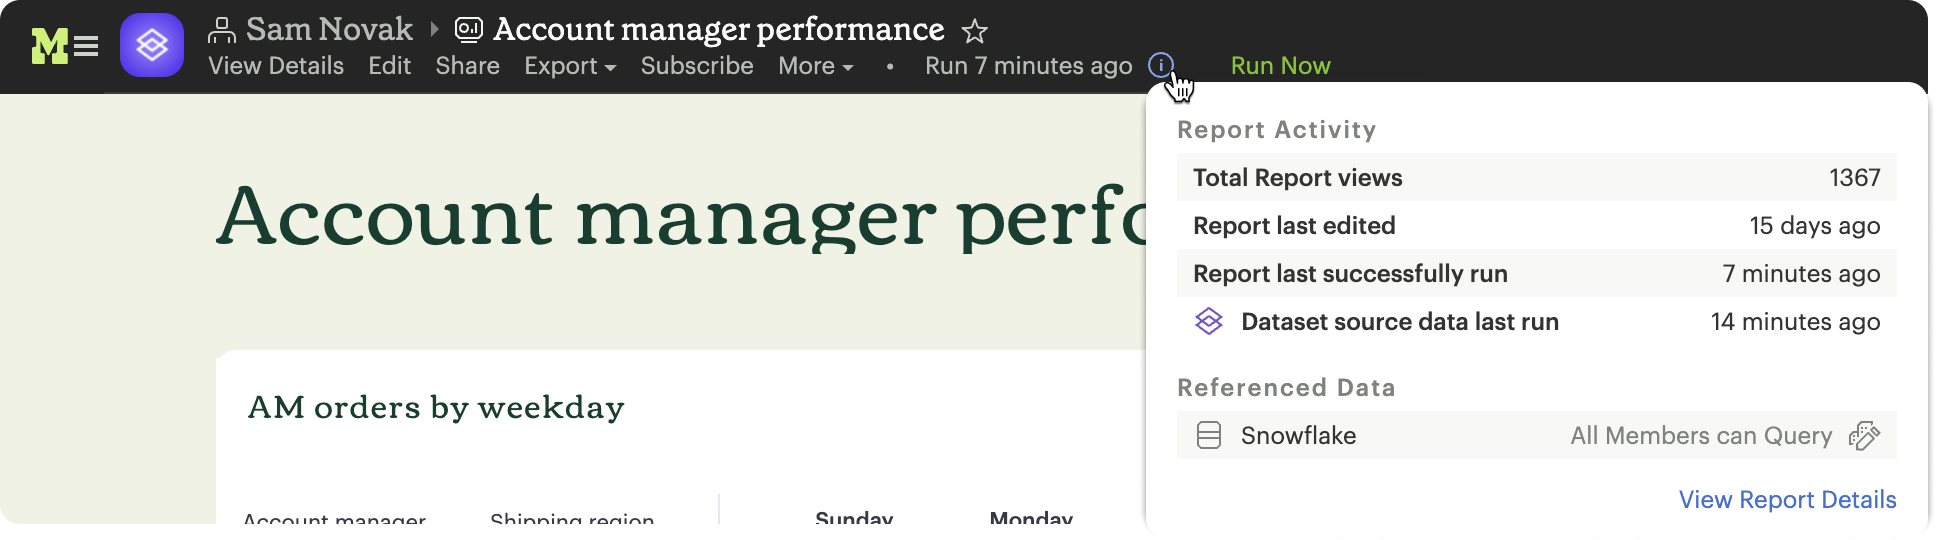
You can also compare how recently your entire Report ran relative to when the Datasets were last run by navigating to your Report’s Activity popover.
Early Release
Data Mashup: Cross-Source Data Integration
Data Mashup is a high-performance interface that allows users to perform SQL transformations across disparate data sources within a single report. Traditionally, users are restricted to a "single connection" architecture, meaning joins can only occur between tables residing in the same database. Data Mashup removes this technical barrier by enabling joins across different Cloud Data Warehouses (CDWs) and flat files without requiring an ETL process to centralize the data first. By leveraging the cached layer, Mode workspace treats these independent datasets as local tables. This allows you to combine production warehouse data with tactical information—such as CSVs or Excel files—to create unified, searchable datasets that deliver sub-second performance.
Support for few sources is expected soon
- Flat files like CSV and Excel
- Notebook outputs to be used in Data Mashup
How it Works
To create a mashed dataset, follow these steps:
- Initiate the Query
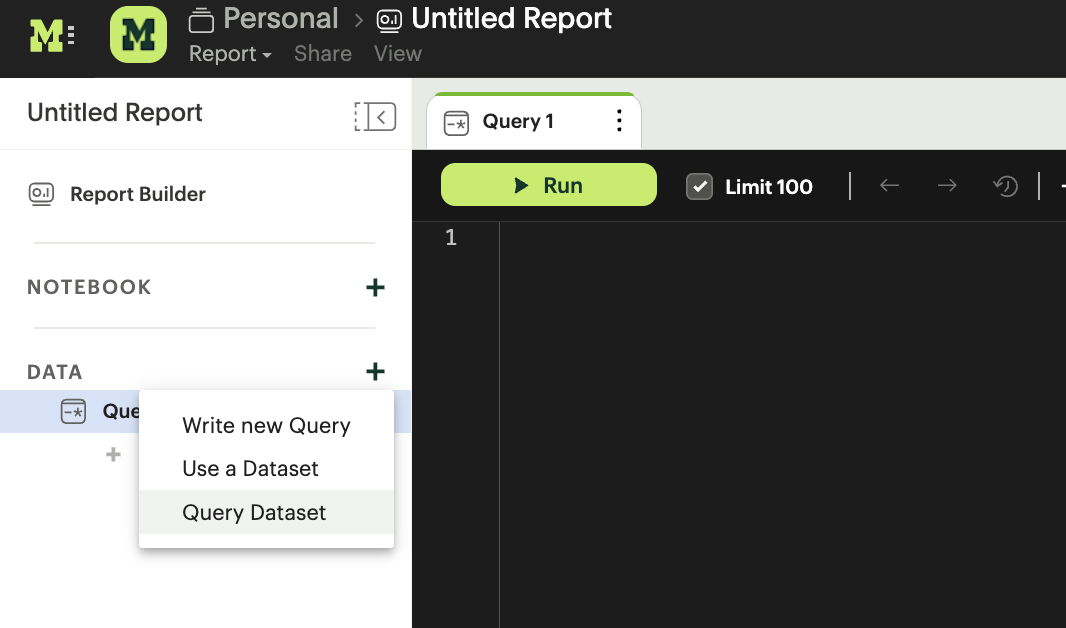
Open your report and navigate to the Data section in the left sidebar. Click the + icon and select Query Dataset from the dropdown menu.
- Import Your Datasets
The datasets you intend to join must be loaded into the report's context. You have two options for importing them:
- Direct Import: Select Use a Dataset from the initial menu to choose an existing dataset.
- Local Workspace: You can pick datasets after starting your query flow from the Local Workspace pane. Browse through your Collections, select the required dataset, and click Load Dataset.
- Write the SQL Join
Once the datasets are loaded, use the SQL editor to define your join logic.
- Syntax: Any kind of join which is available in a standard CDW is supported.
- Referencing Datasets: Use double quotes around the dataset name (e.g.,
"india_lap_times"or"f1_drivers") to reference it as a table in your query.
Example Query:
SELECT
  d.refname,
  lt.*
FROM "india_lap_times" lt
INNER JOIN "f1_drivers" d ON lt.driverid = d.driverid
WHERE year = 2012;
- Execute and Review
Click Run to execute the join. By leveraging the cached layer, the system processes the join and displays the results in the Data tab below the editor. This allows you to verify the schema and data output before finalizing the new mashed dataset.
Deleting Datasets
How to delete Datasets
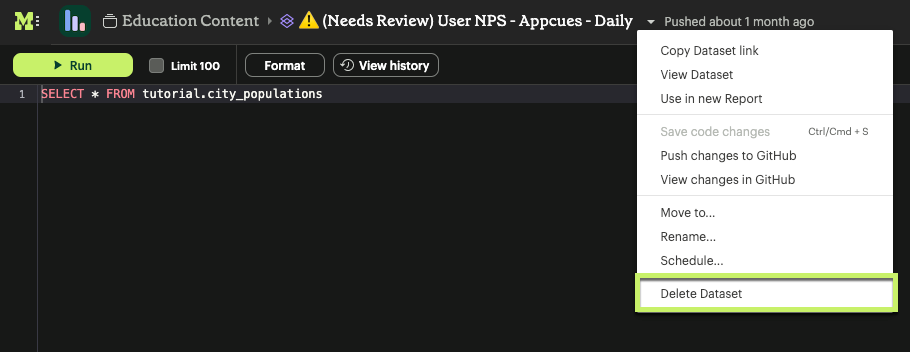
To delete a Dataset, open up the Dataset in edit mode. Then, using the dropdown next to the Dataset name, select Delete Dataset.
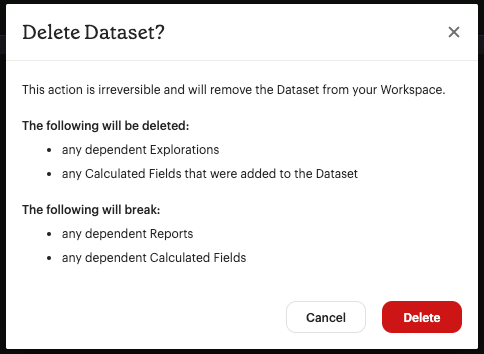
Doing so will prompt a confirmation that you want to delete the Dataset. To confirm, select Delete.
FAQs
Dataset Creation & Management
Q: Can I use Parameters in my Dataset?
No. Parameters are not supported within Datasets. You can use liquid templating in your SQL query code, but it’s not recommended. There is no affordance for interacting with Parameter inputs when viewing or scheduling a Dataset or when using its data within Reports
Q: What happens if my Dataset fails and it’s being used in Reports?
If a Dataset run is canceled or fails, all Reports using its data will fall back to the last successful run until the issue is resolved. Within Reports, Datasets are badged to notify the user when there’s an issue
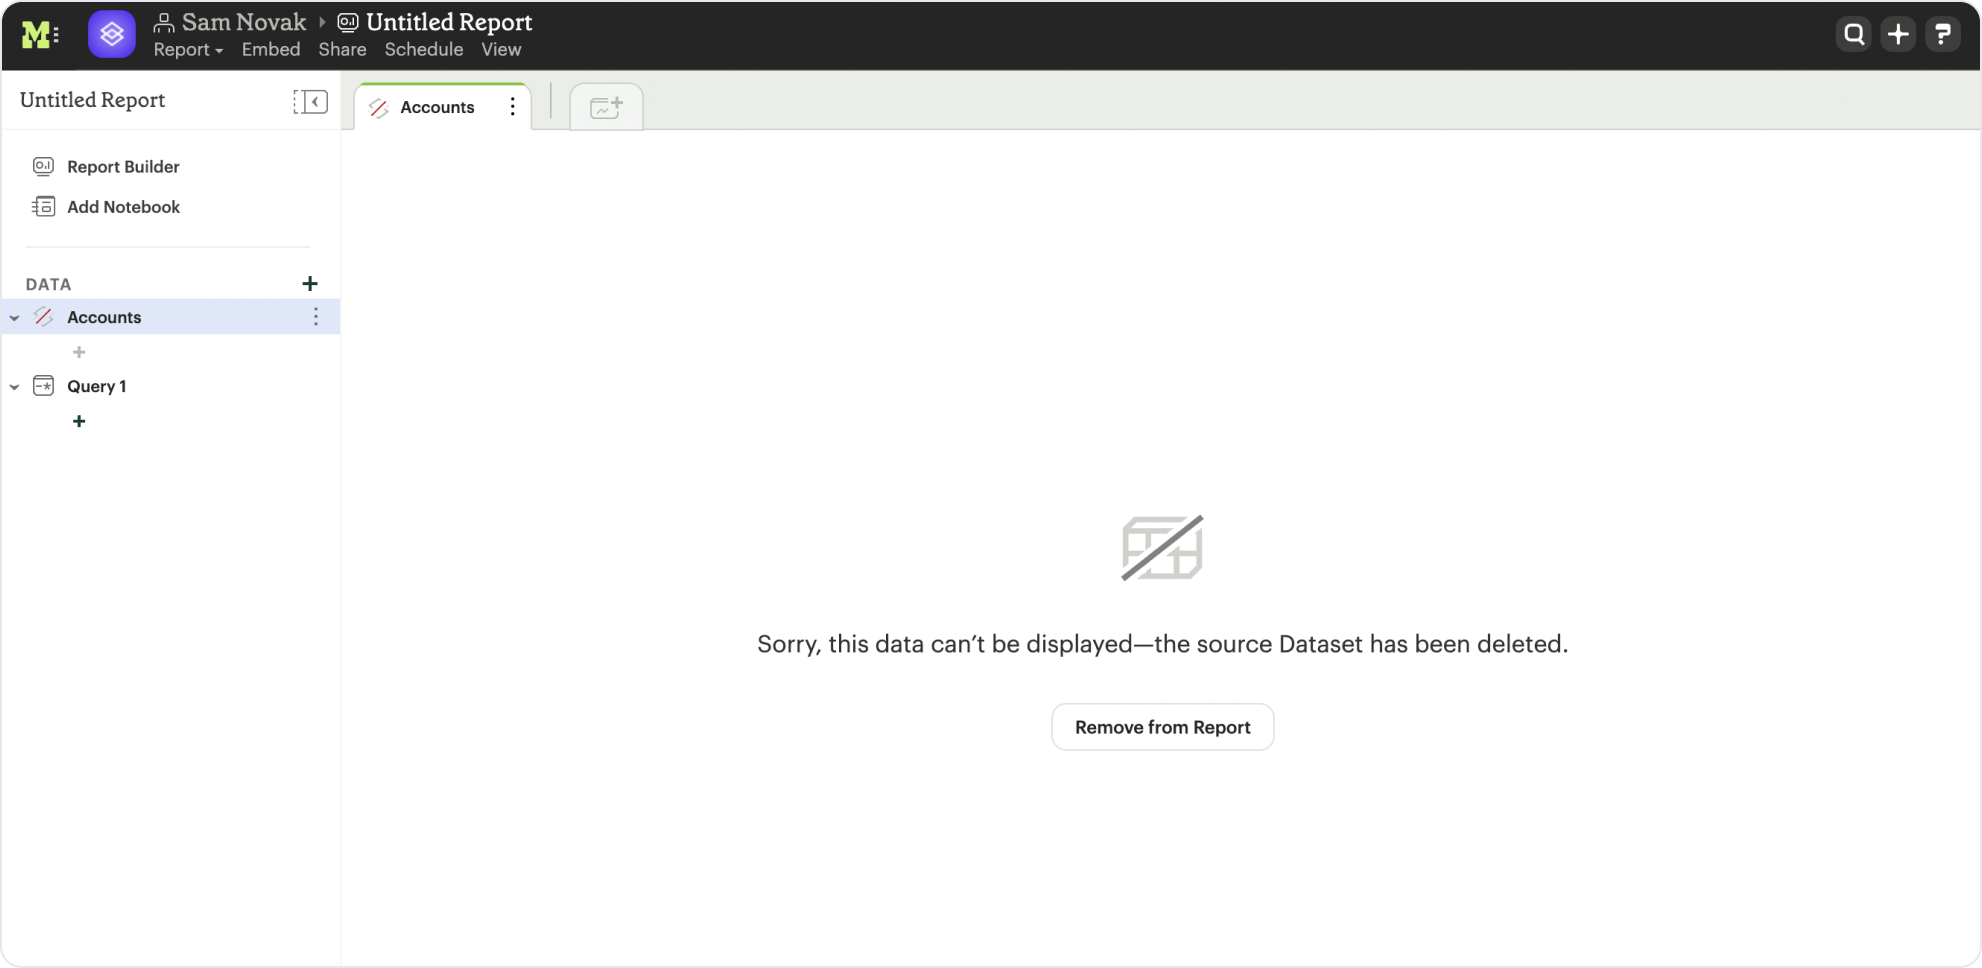
Q: What happens if I delete a Dataset?
The Dataset will be permanently removed from your Workspace, and any dependent Reports, Charts, or Calculated Fields will break
Q: How are Datasets different from Definitions?
Definitions are SQL snippets that allow you to write logic in one place and reference that logic across multiple queries. Like Datasets, when run as a query, they produce a data table and refer to a specific schema within a particular connection. But to reference them in a Report, you must run a new query each time.
Unlike Definitions, Datasets are refreshed and materialized independently. All Reports referencing a Dataset can accept newer runs, so you only need to run the data once.
There’s also no way to use a Definition without writing SQL. You need to have both permissions to query against the Connection a Definition is built on top of and feel comfortable writing a query to take advantage of its data.
Q: When should I think about using Datasets vs Mode’s new dbt Semantic Layer Integration?
Datasets are reusable containers of curated data intended to cover much broader topics and subject areas. You might consider using a Dataset to return an entire table that you’ve modeled in dbt, whereas metrics are typically much more tightly scoped. Metrics are also aimed at allowing users to quickly find answers to very well-defined questions (ex. How much revenue did we make last week?), whereas Datasets can be used for more open-ended, exploratory self-serve analysis (ex. Why is my revenue lower this quarter than last quarter?).
While both features allow you to analyze data in a code-free environment, they can have different impacts on your warehouse/Helix usage. Datasets are refreshed independently and materialized into Mode’s data engine, Helix, allowing you to run a Dataset once and leverage its results across multiple Reports.
Unlike Datasets, dbt metric logic is run directly through dbt’s SQL proxy and server to ensure the data is aggregated correctly. This requires each individual Metric chart to be run independently. However, we take advantage of Helix for all stylistic and formatting changes to avoid round trips to the database whenever possible.
Learn more about dbt Semantic Layer Integration here
Dataset Usage
Q: Can I add custom HTML to Reports that are using Datasets?
You can customize the styling of your Report’s layout using the HTML editor, however any custom JS - including example gallery code that uses alamode - is unsupported for Reports using Datasets.
Q: Can I explore a Dataset?
You can’t explore Datasets directly, but you can explore Report visualizations that are built on a Dataset. Currently, saving these Explorations is unsupported.
Q: Is there an automated way to copy charts and visualizations from SQL query-based reports to Dataset powered reports?
No. This functionality is not available today. However, our Product team is considering multiple enhancements to aid in the facilitation of this workflow.
Q: Is it possible to build a Dataset on top of an existing Dataset? Or join two or more Datasets together in a new Dataset?
No. It’s not possible to reference Dataset results in SQL queries today. That means there isn’t a way to leverage an existing dataset within a new Dataset, or join the results of multiple Datasets together.
Was this article helpful?