Business Intelligence
built around
Business Intelligence built around data teams
data teams
Mode is the central hub for your organization’s analysis, uniting data teams and business teams around data to drive business outcomes.

Capabilities you can count on
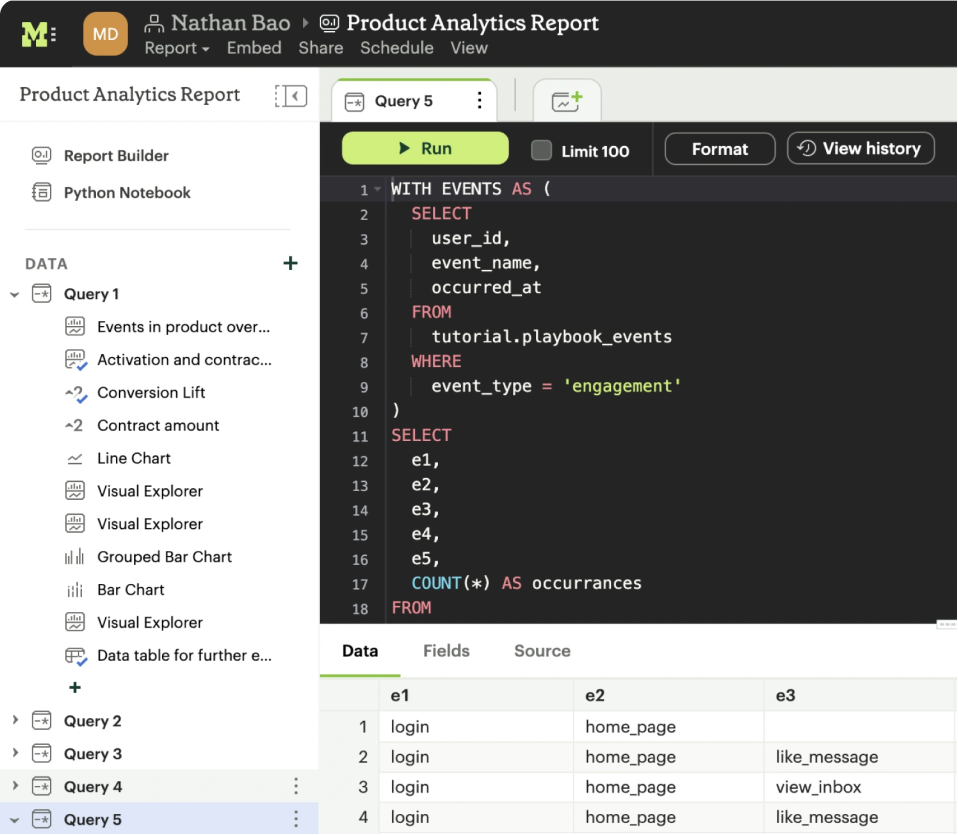
Dive right into your data using SQL and rapidly iterate through queries to deliver results.
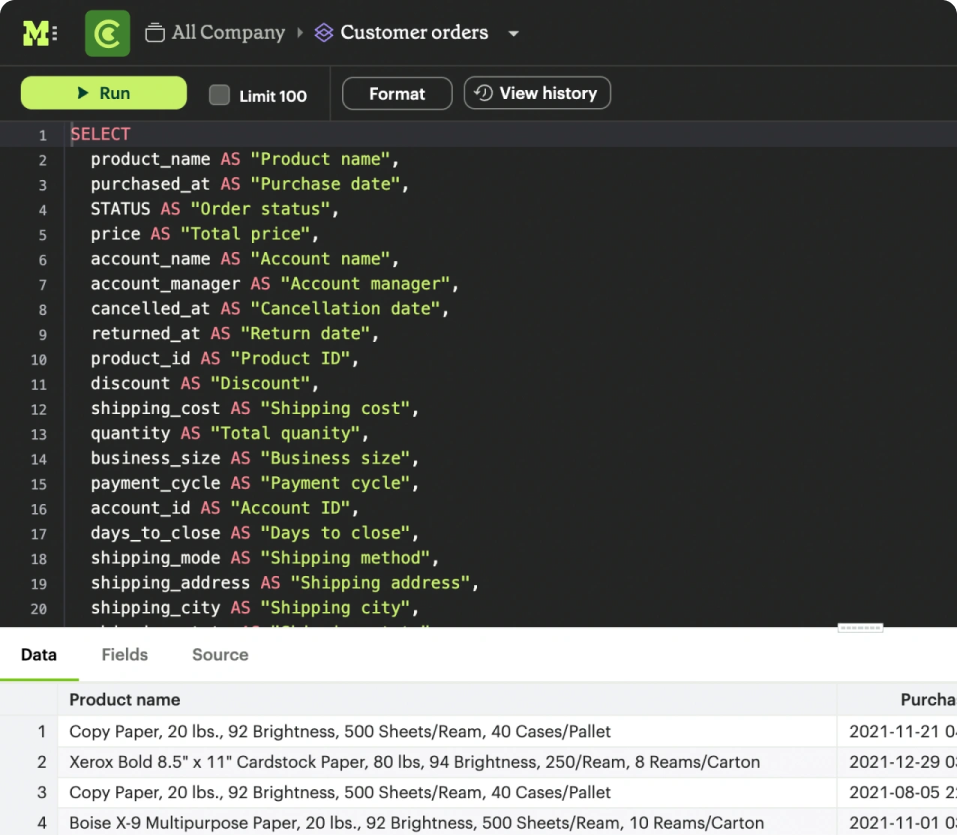
Clear the path from data to insights, together
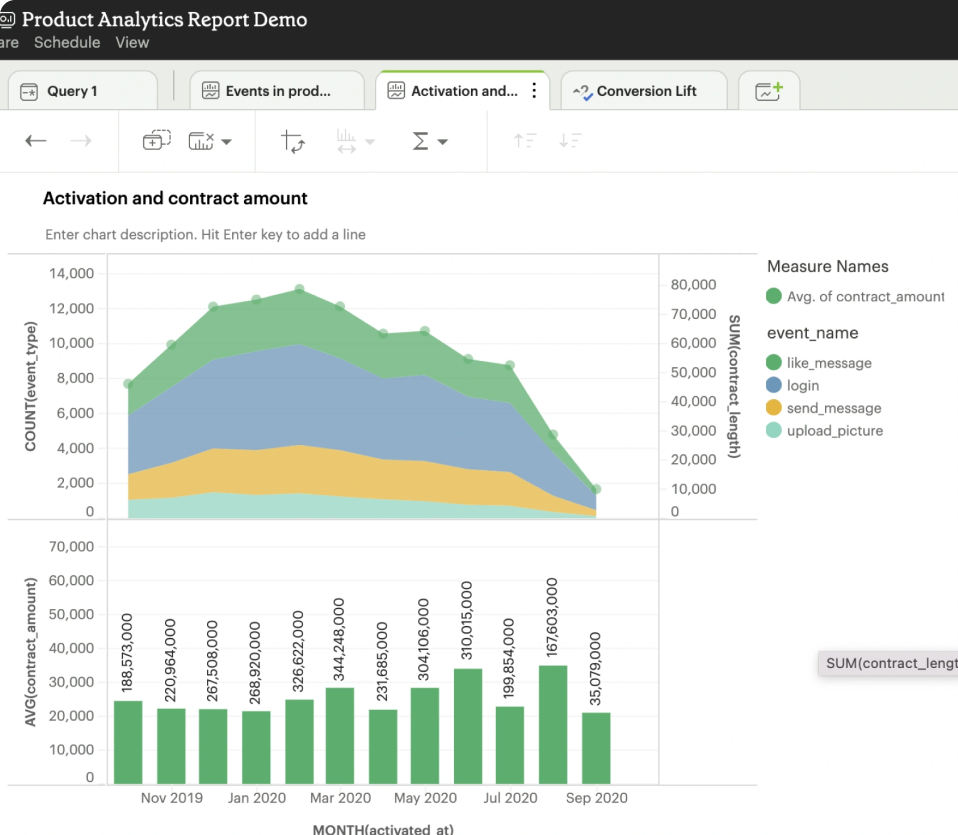
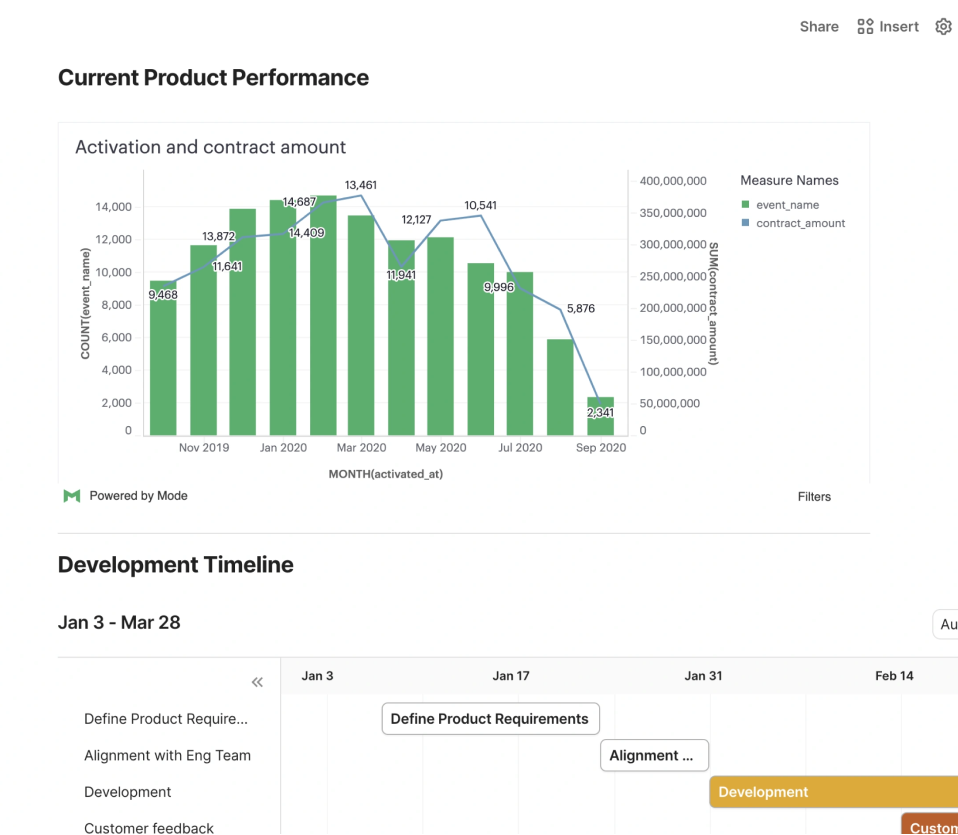
Perform complex, ad hoc analysis and empower simple self-service reporting, all on the same platform.
Made for your data team
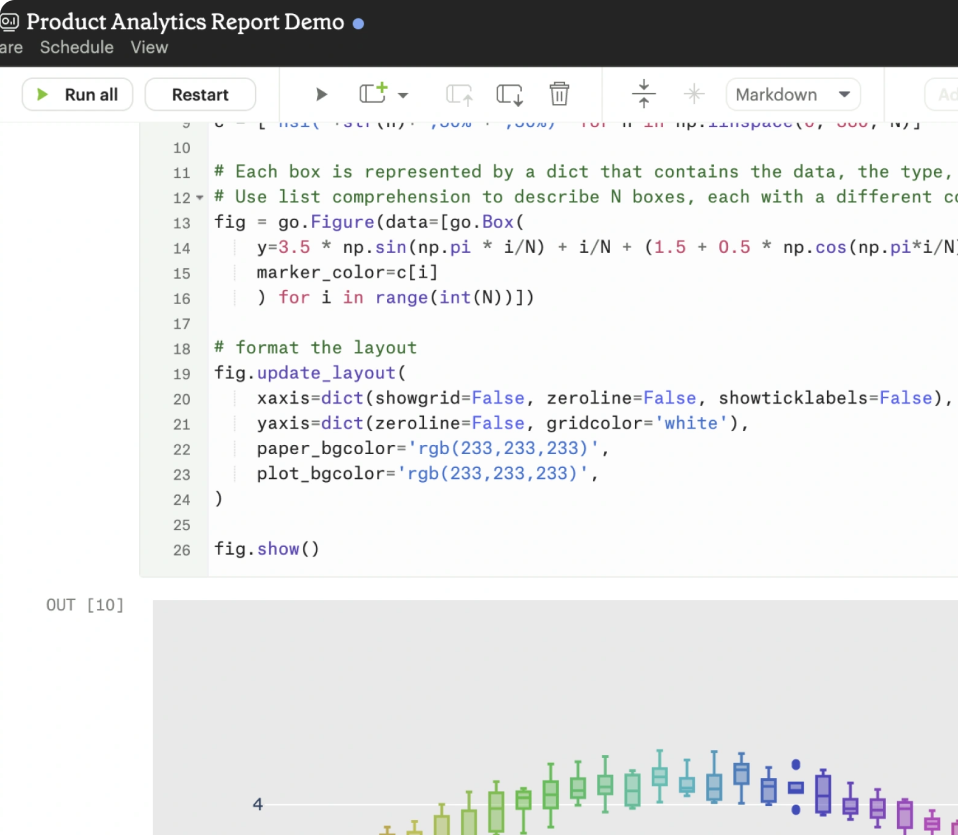
In Mode, SQL, R, Python and data viz are all connected to help you deliver insights, faster than ever. No rigid data model should stand in the way of the analysis needed to support business decisions, big and small.
And the teams you work with
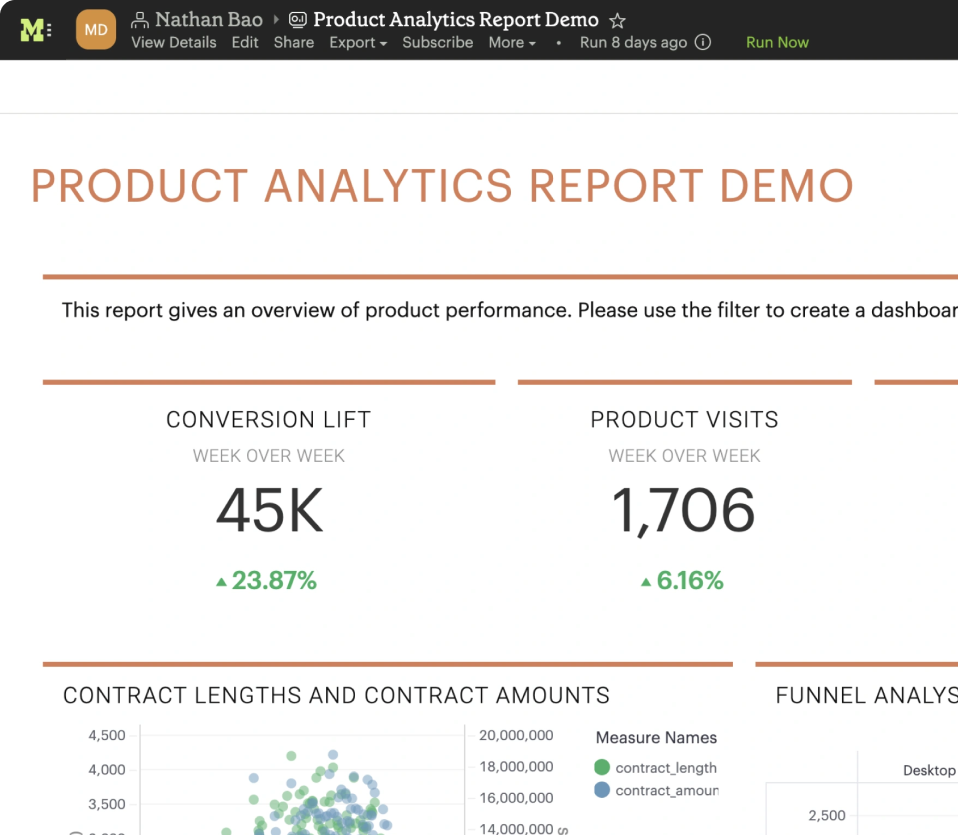
Deliver tools for easy, trusted self-service, in record time. Because everyone's analytical tools can live in one place, Mode becomes a central hub full of easy-to-understand data, curated by the data team, without long implementation times or tedious maintenance.
The intelligence layer for your modern data stack
Mode amplifies the investment you've made in every layer of the stack, by getting data you've made meaningful into everyone's hands.
Modern BI
Transformation
Warehouse
Ingestion
Raw Data
Mode customers lead their industries


Mode is incredibly valuable as a full stack, full-service platform from a data analyst all the way to an end user. Analysts can go deep, end users get the data they need, and our team gets to make everyone a part of the data strategy.


Live weekly group demo
Get to know Mode
Get a firsthand look at how Mode helps data teams deliver high-impact ad hoc analysis and self-service reporting in one platform.
Modern Business Intelligence
Beyond BI as you know it
Behind every great idea is really great data. Mode is the single platform to unite data teams and business teams around analytical work.
Platform overview


