Sign in
Try for free
Request demo
Ad Hoc Analysis
Answer challenging and important questions with standalone reports
Advanced Analytics
Analyze and model on the same platform as your charts and dashboards
Self-Serve Reporting
Build your own modern reporting, backed up by governed datasets and metrics
Custom Data Apps
Build custom internal tools for thousands of data and business team needs
Interactive Dashboards
Share the insights you find through drag-and-drop visual analytics tools
Features
Resource Center
The data scientist toolbox
Our Blog
Data insights for everyone
Learn SQL
Answer data questions with SQL
Learn Python
Analyze business data with Python
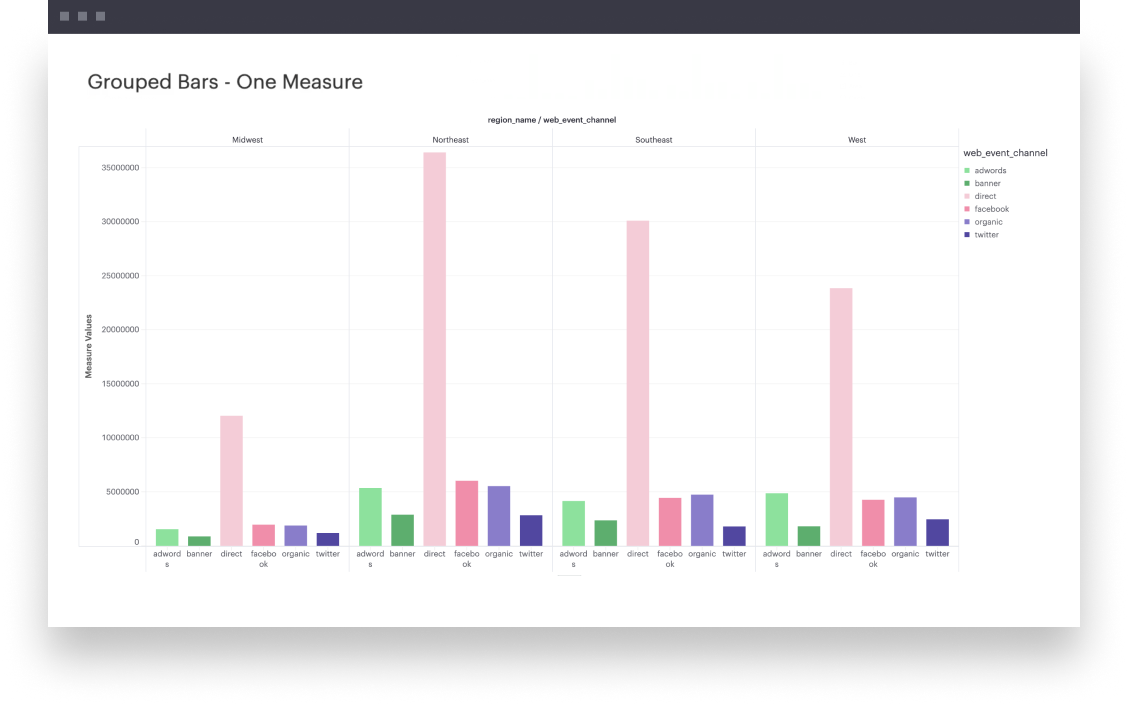
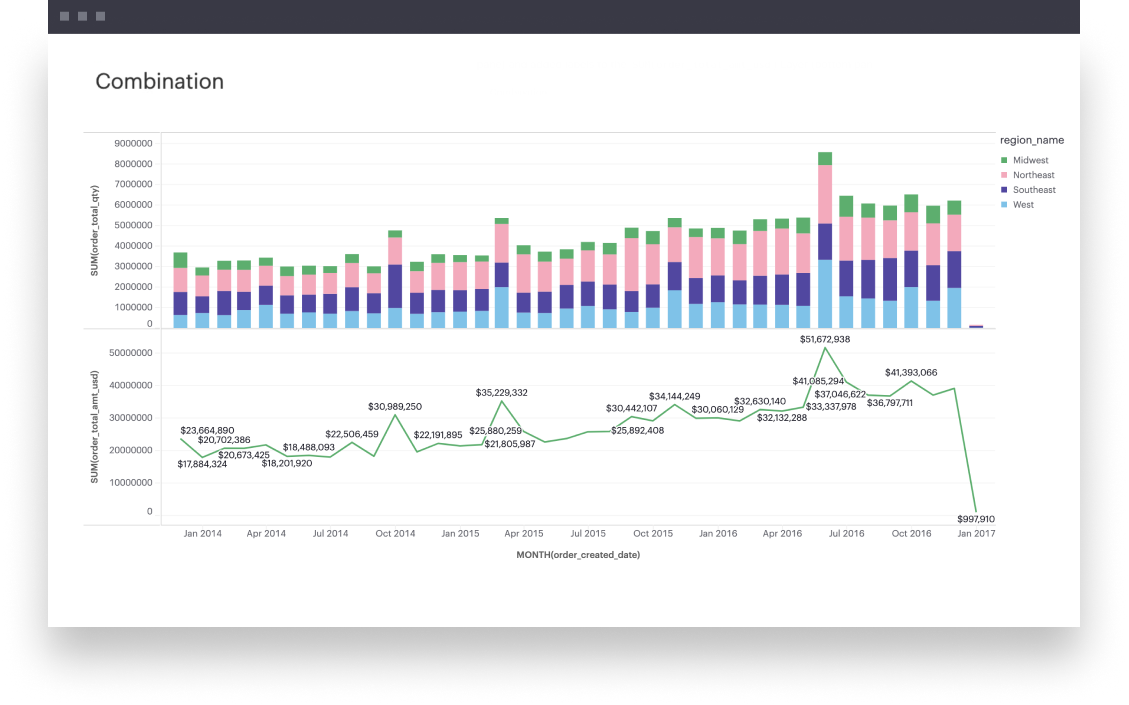
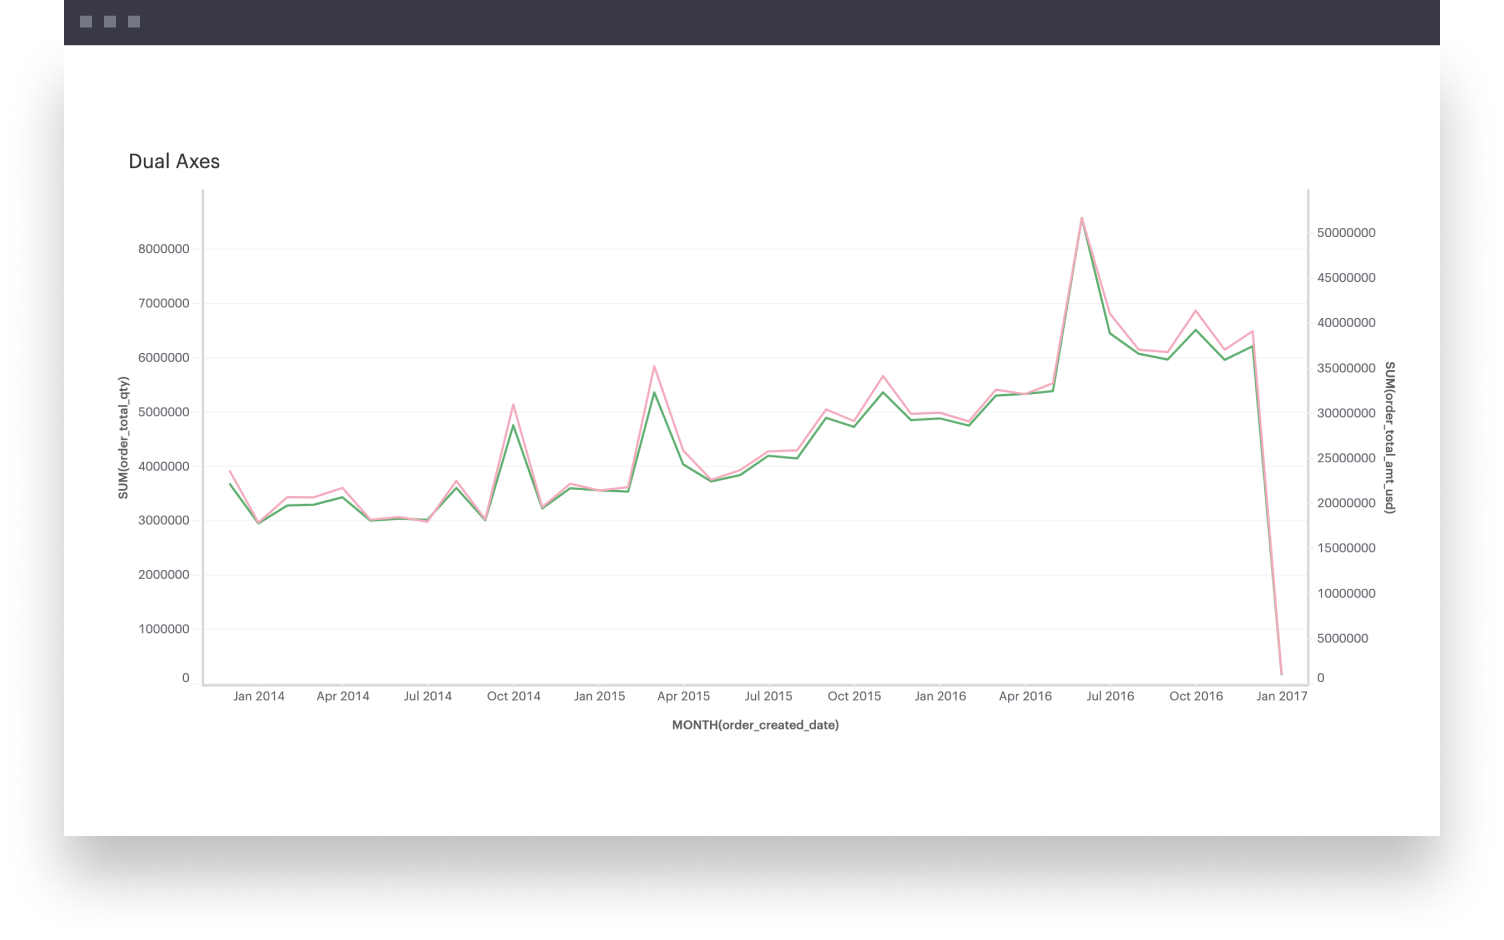
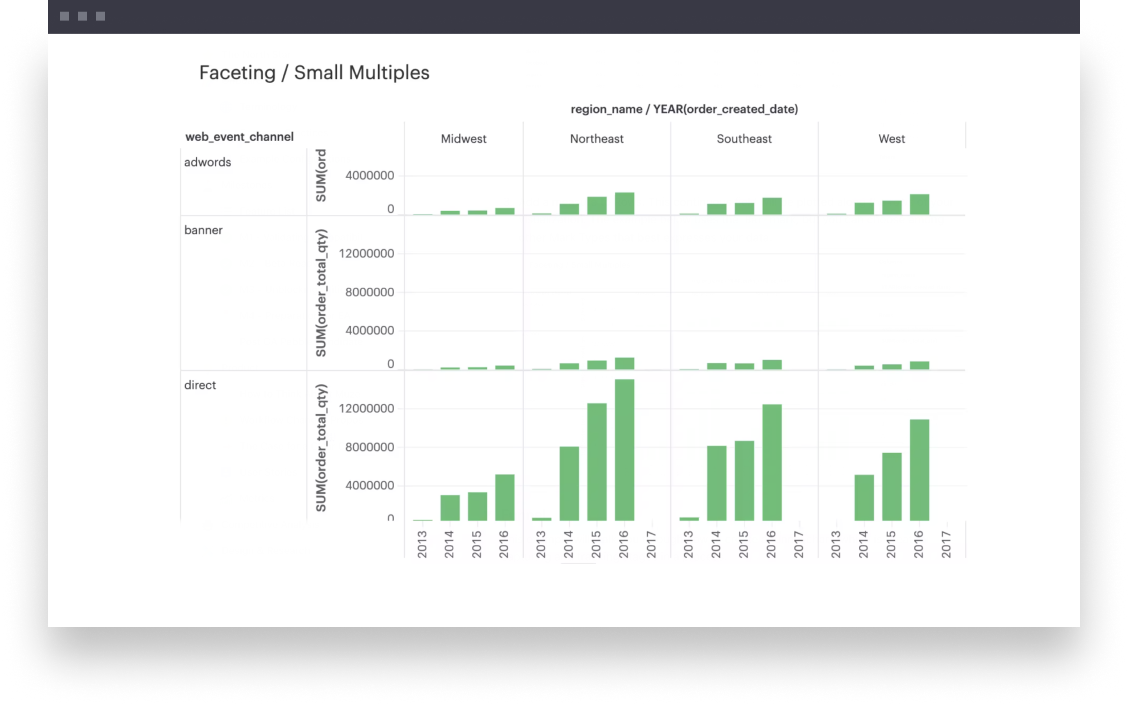
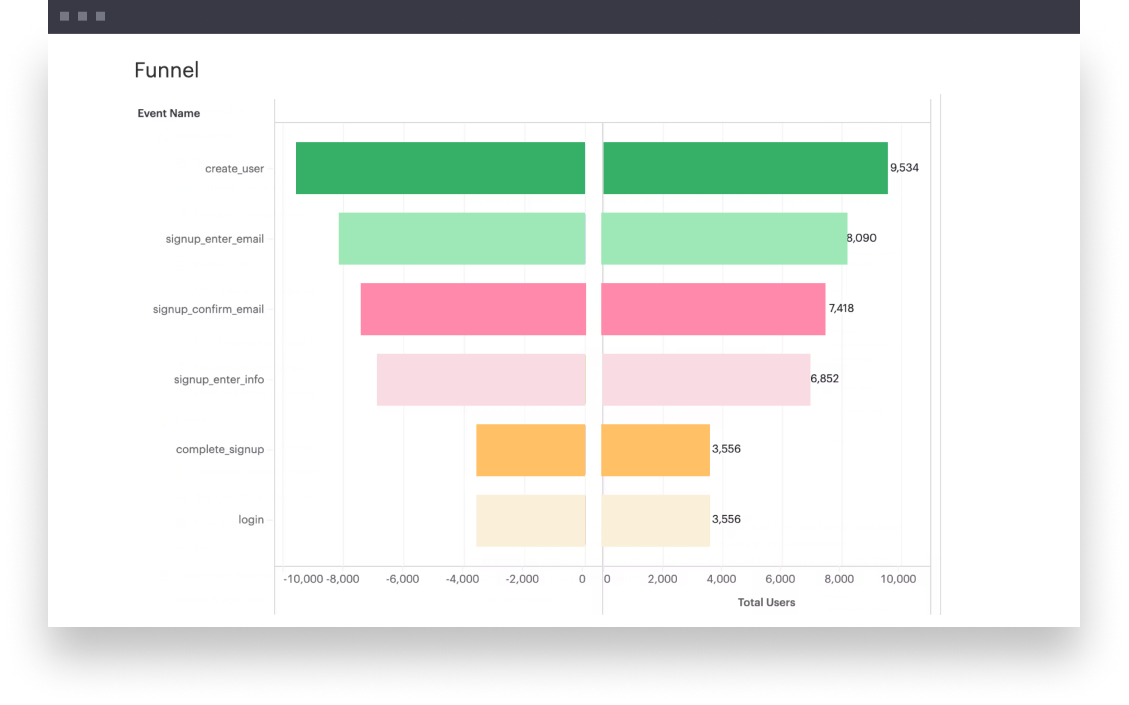
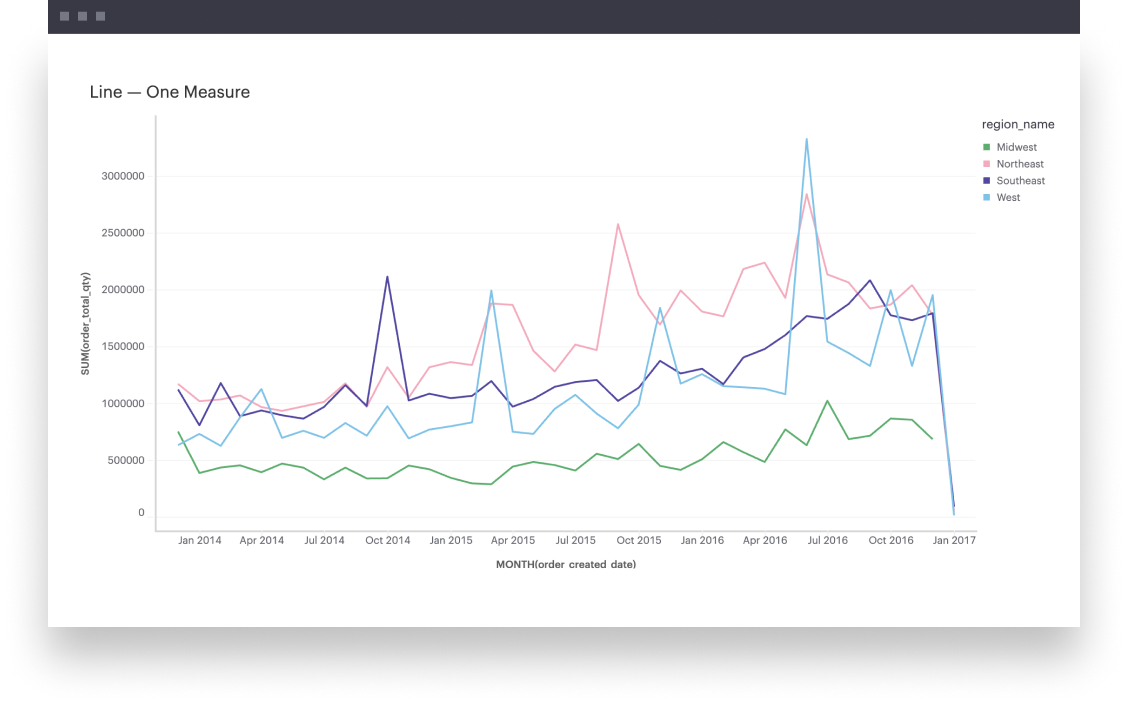
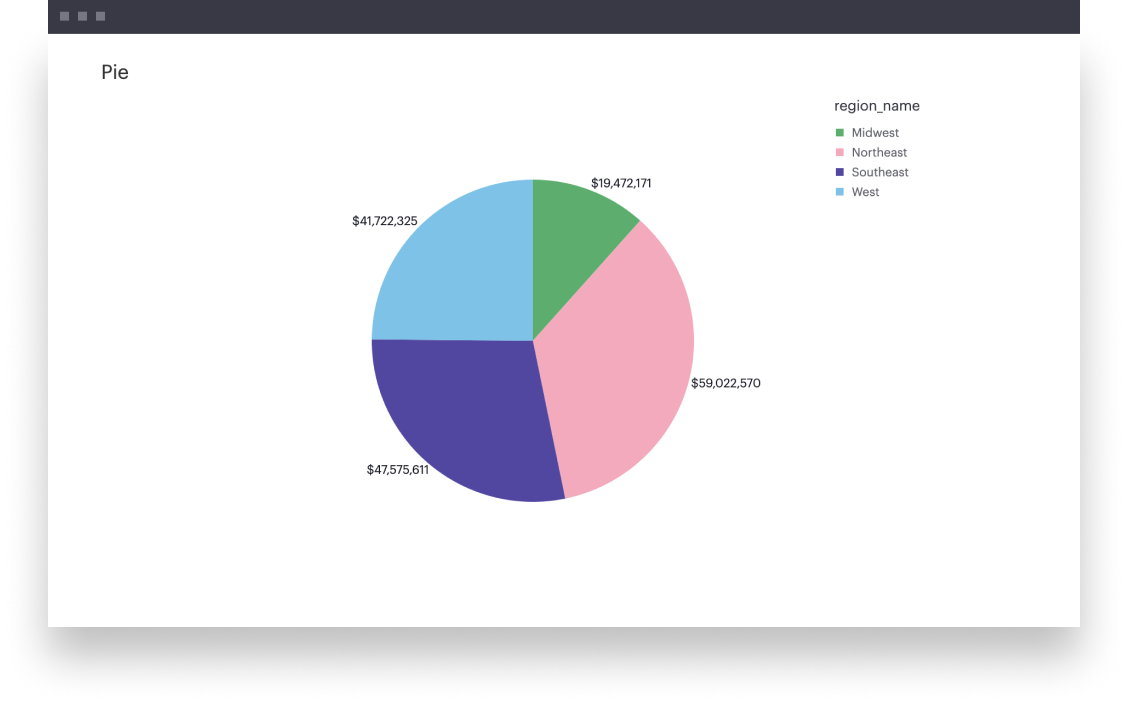
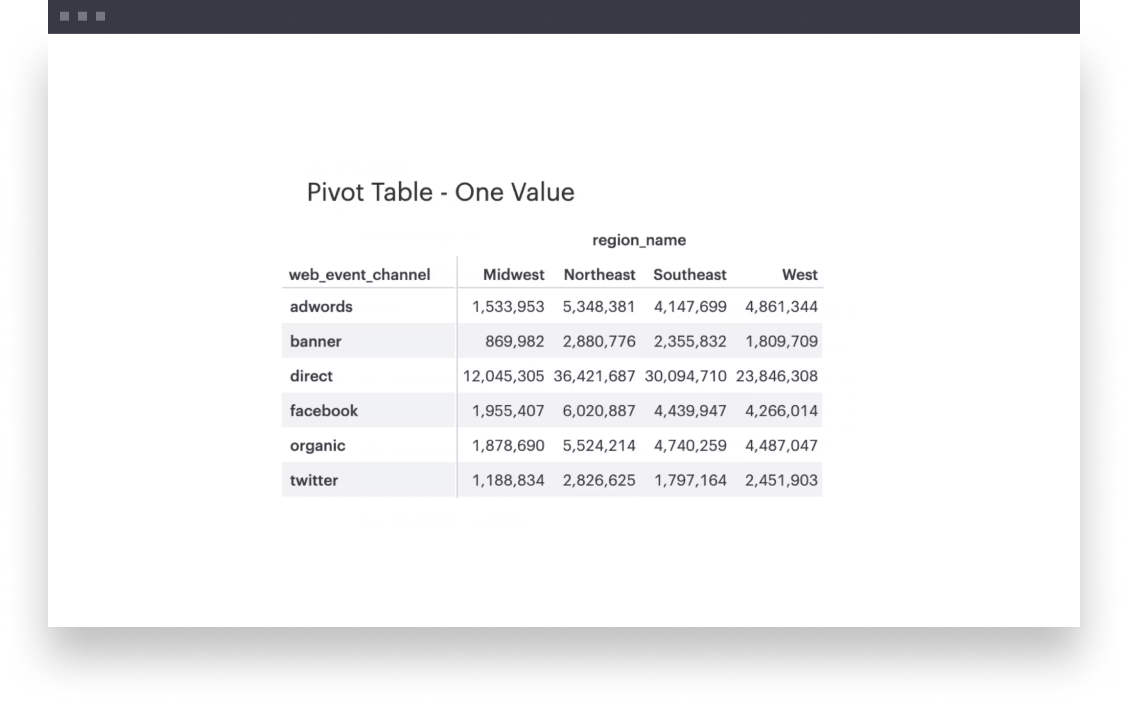
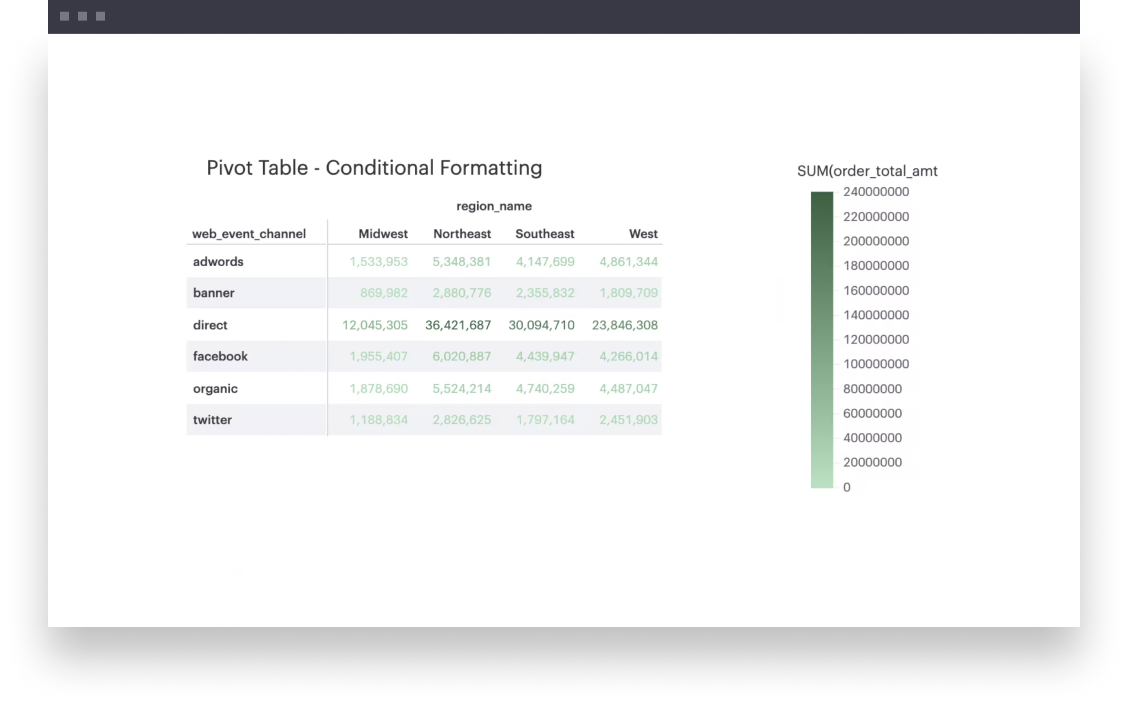
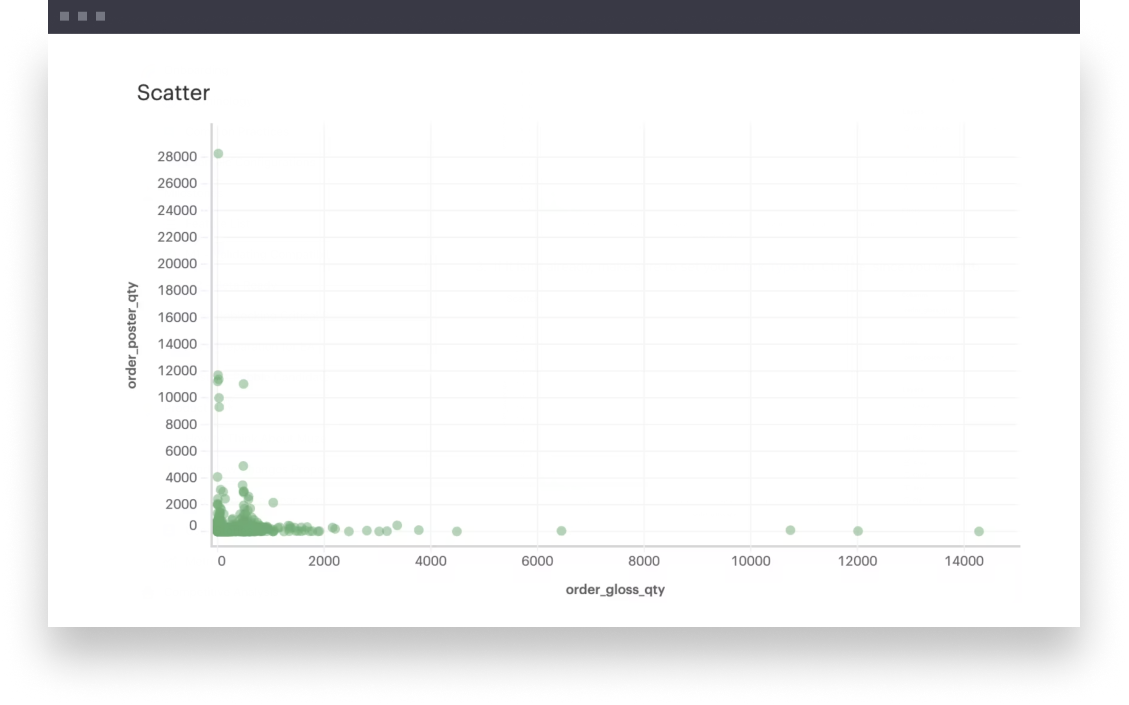
Below are examples of possible visualizations you can build as starting points for your exploratory analysis.
Try Visual Explorer
Request a demo
Multiple Panes
Get more from your data
Your team can be up and running in 30 minutes or less.