Mode Help
Query and analyze data
The Notebook
Overview
Every Mode report contains an integrated notebook-style environment where analysts can extend their analysis using either Python or R.
The Notebook’s moveable code blocks and markdown cells enable exploratory data analysis, visualization, and collaboration. Notebook environments have a variety of supported Python libraries and R packages installed. You can add the results of output cells to reports, or share a link to the Notebook directly. When Notebook output is included in the Report, that Report’s schedule will re-run the Notebook so all of the data stays in sync.
Using the Notebook
You can start using the Notebook in two main ways: directly from the Home page to start a new analysis, or from within an existing Report.
Method 1: Create a Notebook from the Home Page (Quick Start)
This is the fastest way to start a new Python or R-based analysis. This method automatically creates a new, untitled Report containing a blank Notebook.
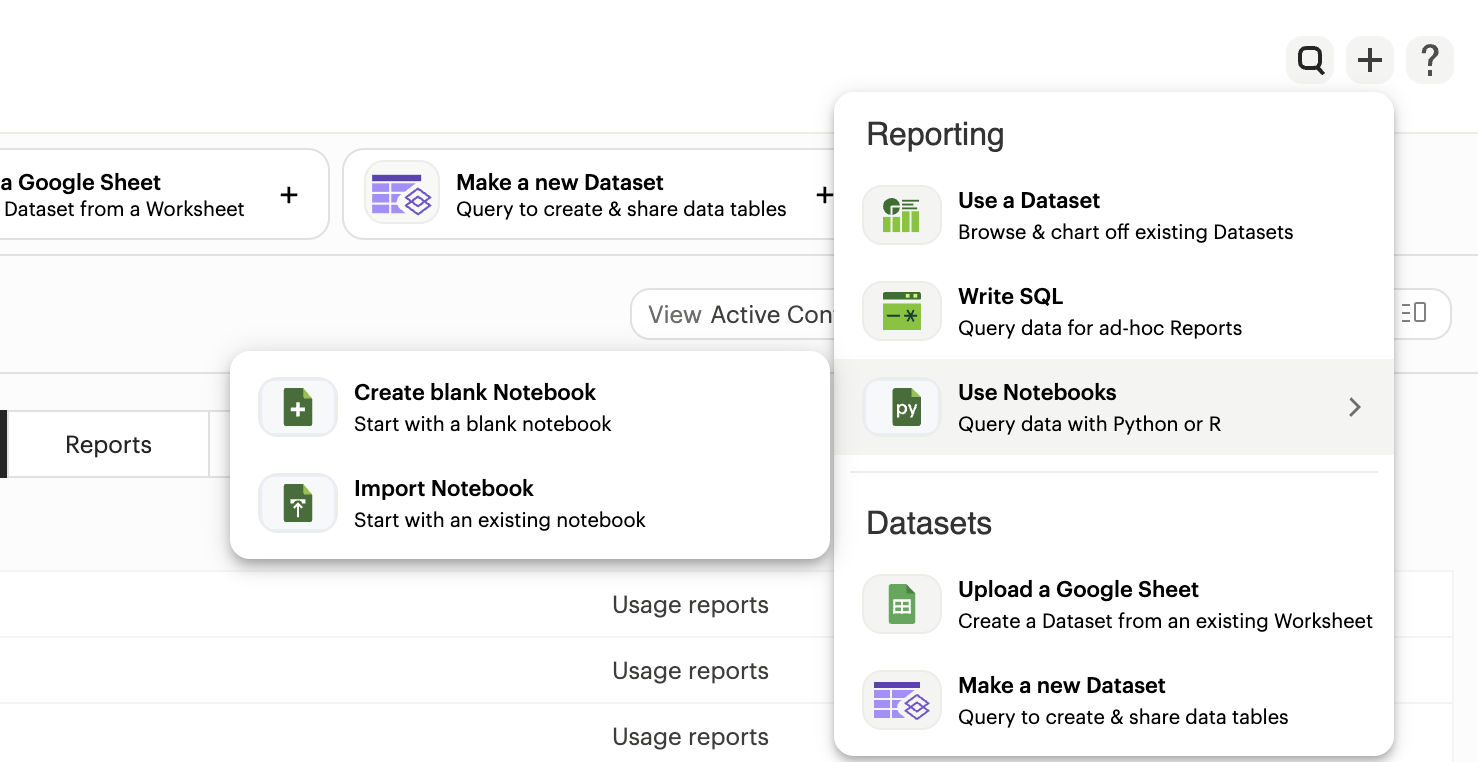
- From the Home page, click the + (plus) icon to open the Reporting menu.
- Under the Reporting section, select Use Notebooks.
- In the sub-menu that appears, you can choose Create blank Notebook to start fresh or Import Notebook to upload an existing
.ipynbfile (up to 25 MB).
- In the sub-menu that appears, you can choose Create blank Notebook to start fresh or Import Notebook to upload an existing
- A new Report will open with a blank Notebook ready for use.
Method 2: Add a Notebook to an Existing Report
Use this method when you want to use the results of your SQL queries as input for a Notebook analysis.
- Open an existing report or create a new one.
- (Optional, but recommended) Run one or more SQL queries from the SQL Editor.
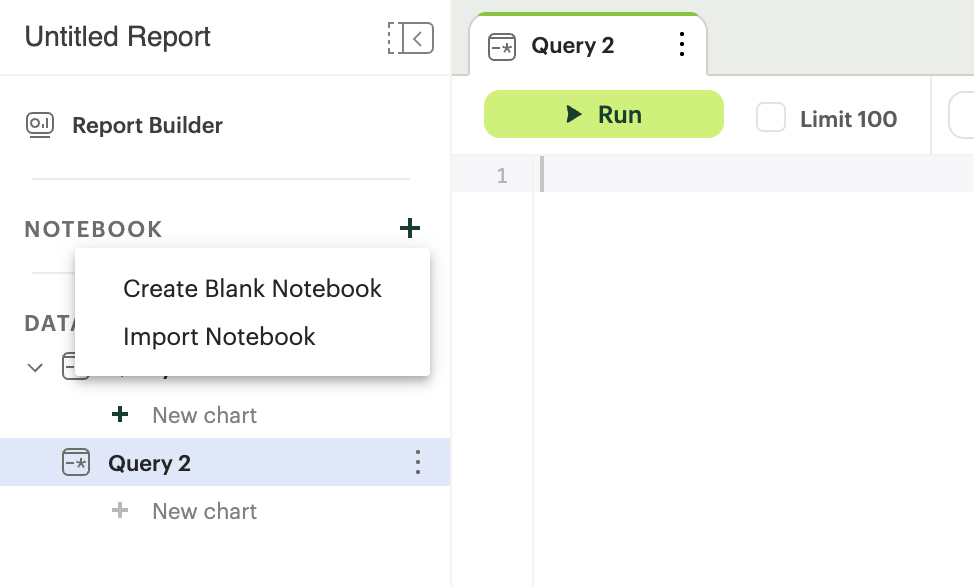
- In the left navigation panel, find the NOTEBOOK section and click the + (plus) icon.
- In the menu that appears, you can choose Create blank Notebook or Import Notebook.
- If you have run any SQL queries, their results will automatically be loaded into a datasets object in your new Notebook, making them immediately available for coding.
Key elements of the Mode Notebook:
- Toolbar - Where you can manipulate and run your Notebook, restart the session, export, and more.
- Cells - Compose code and view results in a Code cell, or contextualize your work with a Markdown cell.
- Resources Panel - The right side panel provides resources to help you including keyboard shortcuts, external documentation, and supported libraries/packages.
- Status Indicator - Where you are notified about your Notebook session status.
Toolbar
Main Toolbar

- Run All - Runs all input cells in the Notebook in sequence (from top to bottom)
- Restart - Stops any current computations running in the Notebook. Restarts the session, thus clearing all the variables, libraries imported, etc. that were defined. However, code in input cells will be available to re-run after the Notebook restarts
- Run Cell and Advance - Runs code in the selected cell and advances to the next cell
- Add New Cell - Adds new input cell above or below the current cell
- Add to Report - Adds the output of the selected cell to the Report Builder
- More → Hide All Output - Hide all output in the notebook. Refreshing the notebook will show the output that was previously hidden.
- More → Export - Exports all input cells as a .py or .r file
Cell Toolbar

- Run Cell and Advance - Runs code in the selected cell and advances to the next cell
- Add New Cell - Adds new input cell above or below the current cell
- Move Cell Up - Moves the current input or markdown cell up
- Move Cell Down - Moves the current cell down
- Fold Cell - Folds (hides) the current cell. Folded cells can still run
- Freeze Cell - Freezes the current input cell so that no changes are allowed; also prevents this cell from running
- Markdown/Code dropdown - Allows you to select the type for the current input cell (as code or markdown)
- Add to Report - Adds the output of the selected cell to the Report Builder
- Delete Cell - Permanently removes cell from the notebook
Working with cells
There are two types of cells in the Notebook:
Markdown - Markdown cells allow you to add context to your analysis. Markdown cell contains text formatted using Markdown and displays its output in-place when it's run.
Code - Input Python or R code into the IN section of the cell. When this cell runs, any corresponding output (including visualizations) will be shown in the OUT section.
Notes:
- When you run your notebook, cells are executed in the order they are displayed, starting from the top cell.
- To select or change a cell's type, go to the dropdown menu in the cell toolbar and choose Code or Markdown.
- To run a cell, select it and press
Shift+Return. Or click Run Cell in the cell or main toolbar. - The number next to the cell label will increment by one every time code in the cell is successfully run.
- To see available methods for an object, type the name of the object followed by
.and then presstab.
Notebook Status
The status indicator, located in the bottom right corner of the browser window, will notify you if there is an issue with your session. It may prompt you to restart the kernel.
- Setting up notebook - Displayed when opening up a new Notebook, or after re-starting your session.
- Ready - Notebook is ready to go.
- Running - Your code is executing.
- Loading dataframes - This message may display for larger datasets while dataframe information is loaded into the Notebook.
- Notebook has encountered an unexpected error - Your session has crashed and will need to be restarted.
- There was a problem with your session - Your session has terminated and you need to click Restart to get things working again.
- Cell is still running. Hang tight! - This can appear when code being run includes long-running, computationally intense functions. The Notebook is still online.
- Notebook is having trouble, try running again - The Notebook is experiencing problems. Please try running your code again to fix the issue.
Accessing query and Dataset results
The Notebook has access to the results of every query and reusable Dataset without calculated fields in your report. However, the way you access those results differs depending on the language you're using. In each case, all query results and Datasets are delivered to the Notebook as a custom object called datasets. datasets contains objects of the following type:
Python: pandas DataFrame
R: Data Frame
In your Notebook code, reference query result sets and Datasets in the datasets list by query name, position, or token. For example:
| To return results for: | Python | R |
|---|---|---|
| First query/Dataset added to report | datasets[0] | datasets[[1]] |
| Second query/Dataset added to report | datasets[1] | datasets[[2]] |
| Query/Dataset named 'Active Users' | datasets["Active Users"] | datasets[["Active Users"]] |
| Query/Dataset with token '6763b688fb54' | datasets["6763b688fb54"] | datasets[["6763b688fb54"]] |
Notes:
- The
datasetsobject won’t update in the Notebook until after all queries in the report have run successfully and Datasets refreshed (loaded in the most recent run available). - R is 1-indexed and Python is 0-indexed.
- If you refer to query results or Dataset by the name, remember to update your code if you rename the query in your report or the Dataset gets renamed.
- The order of the results in the
datasetsobject is based on when the query/Dataset was added to the report. Renaming a query/Dataset may change the order it's displayed in the report editor but will not affect its position in thedatasetsobject.
How to find a query's token
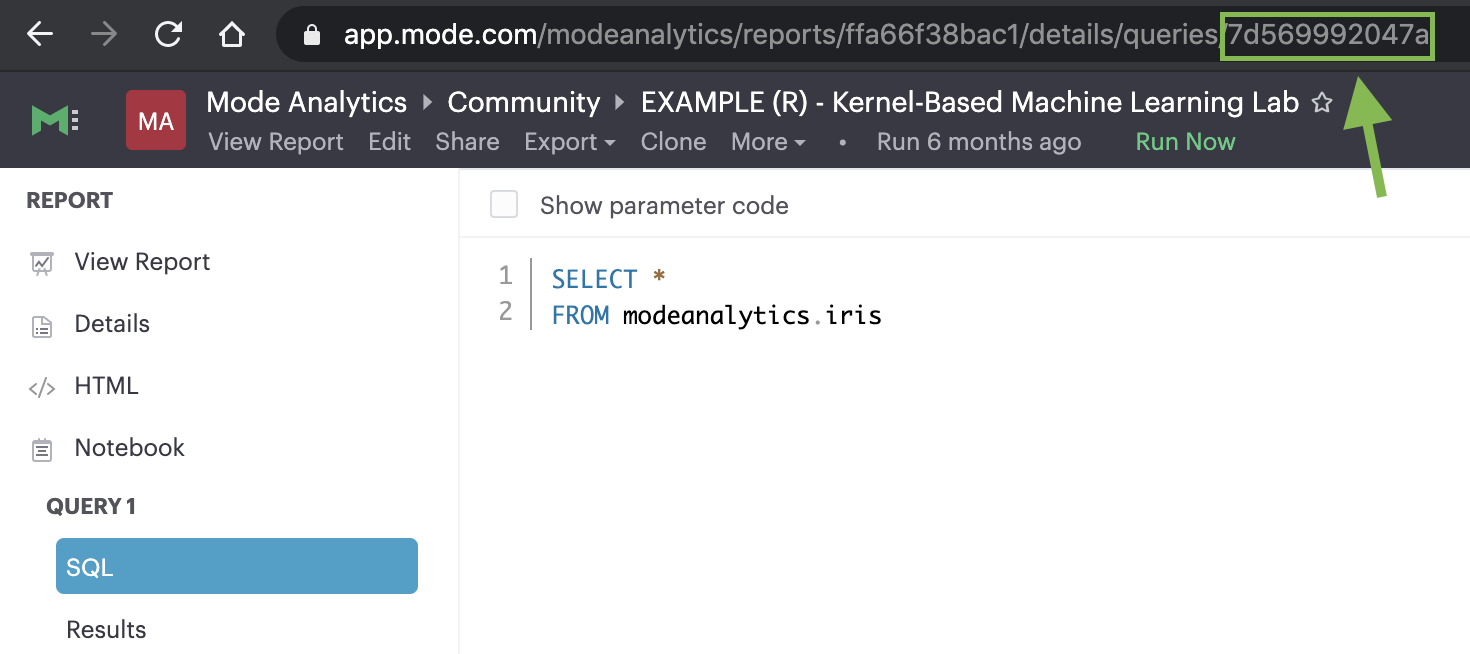
To find the query token starting from the Notebook or editor, click View in the header, then View details, and then click SQL for the query you wish to use. The URL for SQL contains the query token at the end:
https://app.mode.com/ORGANIZATION_USERNAME/reports/REPORT_TOKEN/queries/QUERY_TOKEN
Memory Management in Python
For Mode Business and Enterprise paid plans, Mode’s Python notebook has 16GB of RAM and up to 16 CPU available to it. The free Mode Studio notebook is limited to 4GB of RAM and 1 CPU. To effectively manage memory usage in the Mode Notebooks consider (1) data load of query result sets, (2) incremental library installation, (3) memory utilization in session.
Data load of query result sets and Datasets
Query result sets and Datasets are loaded into the notebook when the user explicitly references the query or Dataset. Users can reliably load result sets up to 4GB as pandas DataFrames in the notebook. They can also utilize larger result sets, but this will significantly increase processing time. There will be a notification when longer processing times are expected.
Incremental library installation
For Mode Business and Enterprise paid plans, the Notebook environment has up to 2 GB of memory available to load additional packages.
Memory utilization in session
Memory usage in the python notebook can be checked by running the following command:
from pympler.tracker import SummaryTracker
tracker = SummaryTracker()
tracker.print_diff()
Output
Adding cell output to your report

Add contents of the OUT section of any Notebook cell to the Report Builder by clicking on the cell and then clicking Add to Report in the toolbar. You can adjust the dimensions and placement of this cell in the Report Builder.
Local Python Datasets
Local Python Datasets are tables of data created from tabular output in Notebooks for use within a specific Report. This allows native visualizations and calculated fields to be created from output results, which update automatically anytime the Report or Notebook is run.
Key Benefits
- Integrated workflow: Leverage data directly from the Notebooks, eliminating the need for manual file creation or external scripts
- Visual analysis: Take advantage of native charting in Mode through quick charts and the Visual Explorer
- Enhanced data prep: Build shared understanding around business and logic definition by adding field descriptions and calculated fields to your Python results
How It Works
1. Generate tabular Output in Your Notebook
Run your analysis or computation in the Notebook to produce the desired tabular output.
2. Create a new Dataset
From the Use output dropdown menu, select the option to Create a dataset

3. Use the Dataset
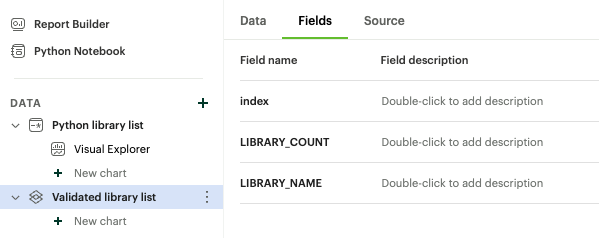
Once created, the dataset will appear under the Data section of the Report. You can use it like any other query result or Reusable Dataset and add calculated fields and visualizations to further your analysis.
Add CSV export to a cell
You can add an export button to a Notebook output cell so viewers can export the calculated results contained in any dataframe to a CSV. The following examples add an export button to an output cell that will generate a downloadable CSV of the query results of a query named “New Users”:
PythonR
Supported libraries
Mode enables easier access to advanced analytical functions by supporting well-established, public libraries within Mode’s Notebooks. Common use cases include:
-
Data Manipulation - Cleaning, aggregating, and summarizing data.
-
Statistics - Simple things like distributions, regressions, and trend lines, as well as some advanced tasks like predictive modeling and machine learning.
-
Advanced Visualization - Python and R have many visualization libraries, enabling analysts to quickly build charts including heatmaps, small multiples, and distributions.
Python CleanSlate Environment
The Python CleanSlate environment is a new execution option in Mode, available alongside Python 3 and Python Edge. It starts without any pre-installed third-party packages, giving users full control over their environment setup. This is ideal for analysts who want a minimal, dependency-free starting point for custom workflows.
Python
pip, requests, or the urllib3 packages in the Python or Python 3 Edge environments. To fully utilize these packages, please upgrade to a paid Mode Business or Enterprise plan.
Mode supports Python version 3.11 in the Notebooks.
Each environment comes pre-loaded with the following libraries:
| Library | Version (Py3) | Version (Edge) | Description |
|---|
requests or pygsheets libraries to access APIs that require authentication using personally identifiable credentials and information, as they will be visible to viewers of your report.
Edge
Mode provides access to an additional Python 3 environment called Python 3 Edge where pending library upgrades are staged. Analysts should use Edge as an alternative environment where they can test out the updated versions of supported Python libraries without fear of jeopardizing scheduled reports.
Mode will announce periodic scheduled promotion events via emails to Mode account administrators. Users will have at least 30 days from that time for testing and validation before the library updates will be made in the broader Python 3 environment. Any Notebooks using the Edge environment will be migrated to use the Python 3 environment at the same time.
Analysts can access Edge via the environment drop-down in the upper right-hand corner of the Notebook. When switching between environments, remember to Restart the Notebook session.

R
The Notebook supports R version 4.2.0 and comes pre-loaded with the following R packages:
| Library | Version | Description |
|---|
httr library to access APIs that require authentication using personally identifiable credentials and information, as they will be visible to viewers of your report.
Install additional libraries
To use a publicly available library in the Notebook, users can leverage each environment’s package manager to install that library at run-time. The Notebook environment has up to 2 GB of memory available to load additional packages.
Python
Installing Libraries
To install a library for use within a notebook, add the following command in any cell:
! pip install library_name
Replace library_name with the name of the desired Python package. This command will install the library within the scope of the active notebook, making it immediately available in subsequent cells. Note that each library installed this way is specific to the notebook, so re-installation may be required for each session or upon reattachment.
Installing Specific Versions
You can specify a version by including it in the command, for example:
! pip install library_name==version_number
This can be helpful to ensure compatibility or access to specific features within a version.
Using installed Libraries
Next, in a subsequent cell, use below statement for each library that you want to include in your environment:
from library_name import libraryname
Handling Dependencies
Mode Notebooks support dependencies for many commonly used packages; however, some packages with highly specialized dependencies may not be fully compatible. In these cases, consider using well-supported library alternatives when possible.
Viewing and Managing Installed Libraries
To see a list of all libraries installed in your notebook session, use:
%pip list
Accessing APIs Securely with Secrets Store
For libraries requiring API keys or other sensitive credentials, Mode now offers a Secrets Store feature that allows you to securely manage these details. By storing your credentials in the Secrets Store, you can safely use them within your notebooks without hardcoding sensitive information.
To retrieve a stored secret in your notebook, use the following:
from library_name import libraryname

session = Session.builder.configs({
    "account": "demoaccount",
    "user": "DEMO_SHARED_ACCOUNT",
    "password": protected_password,
    "database": "SOURCE_SAMPLE_DATA",
    "schema": "TCCP_DB1",
    "warehouse": "DEMO_WH",
    "role": "ACCOUNTADMIN"
}).create()
With the Secrets Store, you can access APIs securely, making it easier to integrate external data sources without exposing authentication information.
R
First, use below syntax into a Notebook cell for each public package that you want to install into the R Notebook.
install.packages (“library_name”)
Replace library_name with the name of the desired R package.
Next, use below syntax for each library you want to include in your environment from the installed package(s). For example:
library (“library_name”)
You may now use any of the methods or functionality included in the library in subsequent Notebook cells.
Notebook keyboard shortcuts
General
| Action | Mac | PC |
|---|---|---|
| Edit selected cell | Return | Enter |
| Run cell | Shift Return | Shift Enter |
| Select cell above | K or ↑ | K or ↑ |
| Select cell below | J or ↓ | J or ↓ |
| Insert cell above | A | A |
| Insert cell below | B | B |
| Move cell above | Shift Option ↑ | Shift Alt ↑ |
| Move cell below | Shift Option ↓ | Shift Alt ↓ |
Code editor
| Action | Mac | PC |
|---|---|---|
| Code complete or indent | Return | Enter |
| Select all | ⌘ A | Ctrl A |
| Undo | ⌘ Z | Ctrl Z |
| Redo | ⌘ Y | Ctrl Y |
| Run cell | ⌘ Enter | Ctrl Enter |
| Insert cell below | Option Enter | Alt Enter |
Python Notebooks Secrets Store
Overview
The secrets store provides users an intuitive and secure way to protect their credentials used in the Notebook. This helps users to extend their analysis by pulling in the data and libraries they need outside of SQL queries against their data warehouse. These credentials are stored encrypted and obfuscated to all users.
Managing Secrets
- Users can add secrets at a Report level and the secret only applies to that Report.
- All Editors of that Report can use, edit, and delete existing secrets. They can also add new secrets to the Report.
- Once secret values are added, they will always be obfuscated. Editing a secret would mean replacing the old secret with a new one. There is no way to print a secret value after it is added.
- Users cannot use a secret from a Notebook in another Report, even if duplicating a Report with an existing secret.
Using the Secret Store
-
In the Python Notebook, click ‘New Secret’ on the right side panel, under the ‘Secrets’ tab and add the Display name and Secret value.
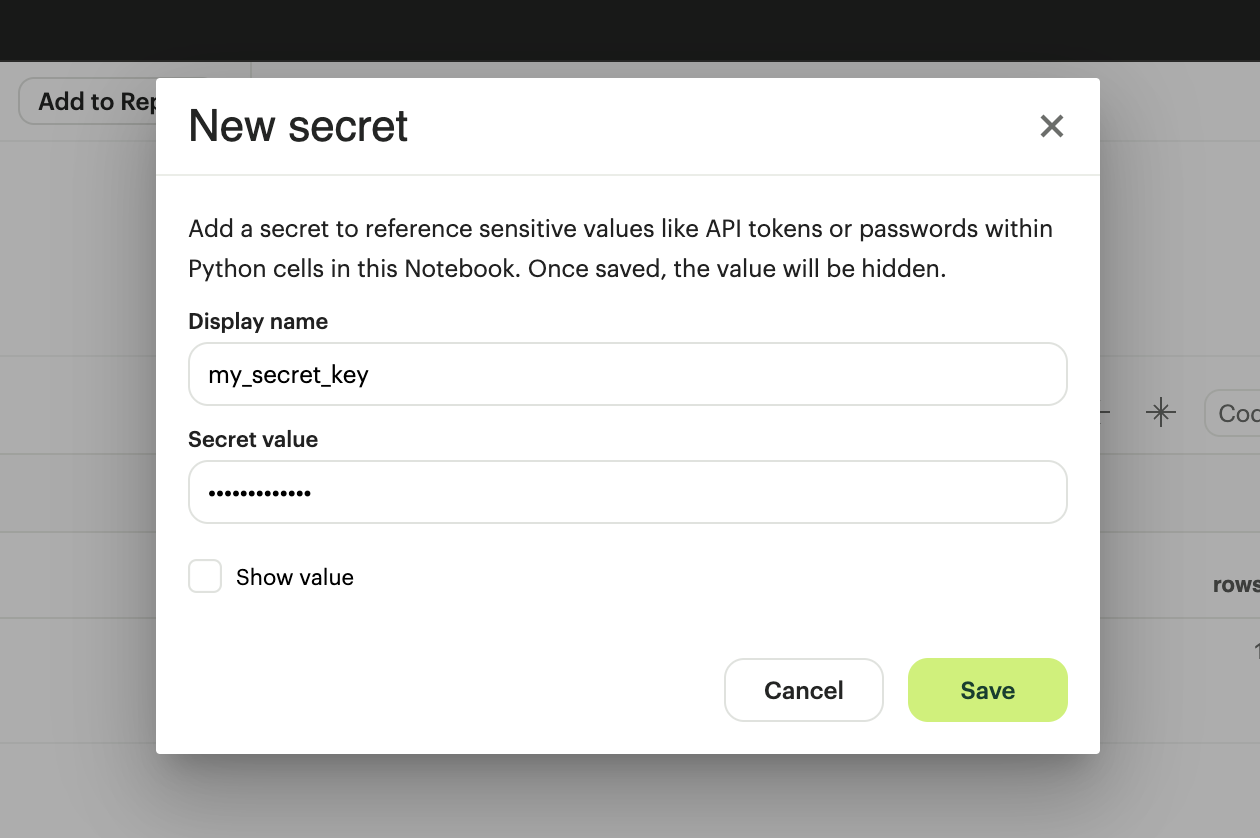
Secrets will need to meet the following criteria:
- The secret display name must be within 1-100 characters long.
- The secret display name can only contain alpha-numeric characters & underscores, and must begin with a letter.
- The secret values must be within 1-4096 characters long.
-
Once saved, users can use the ‘Display Name’ as a variable in the Python cells.
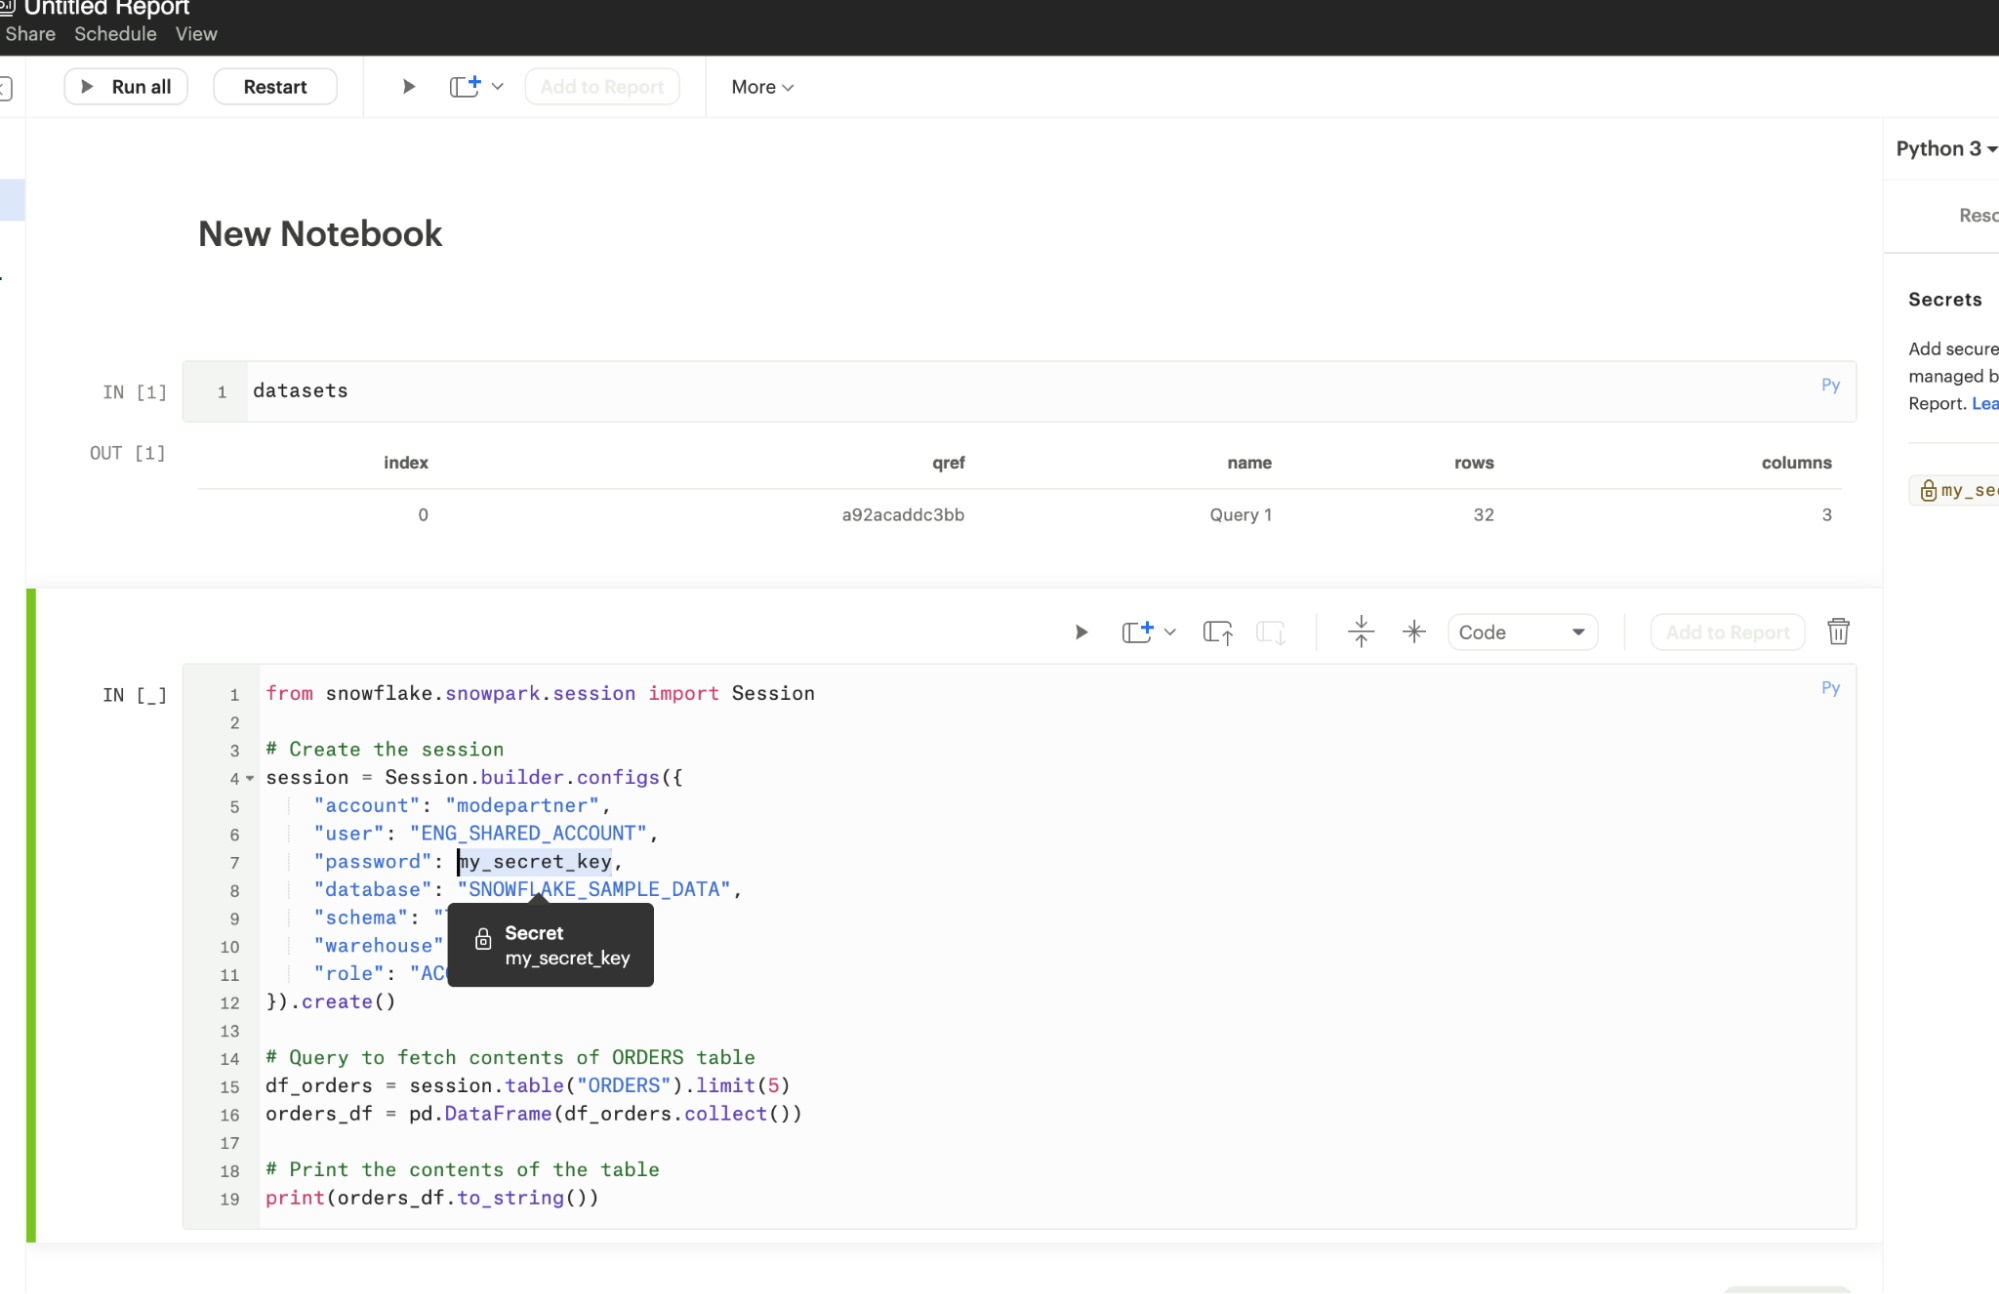
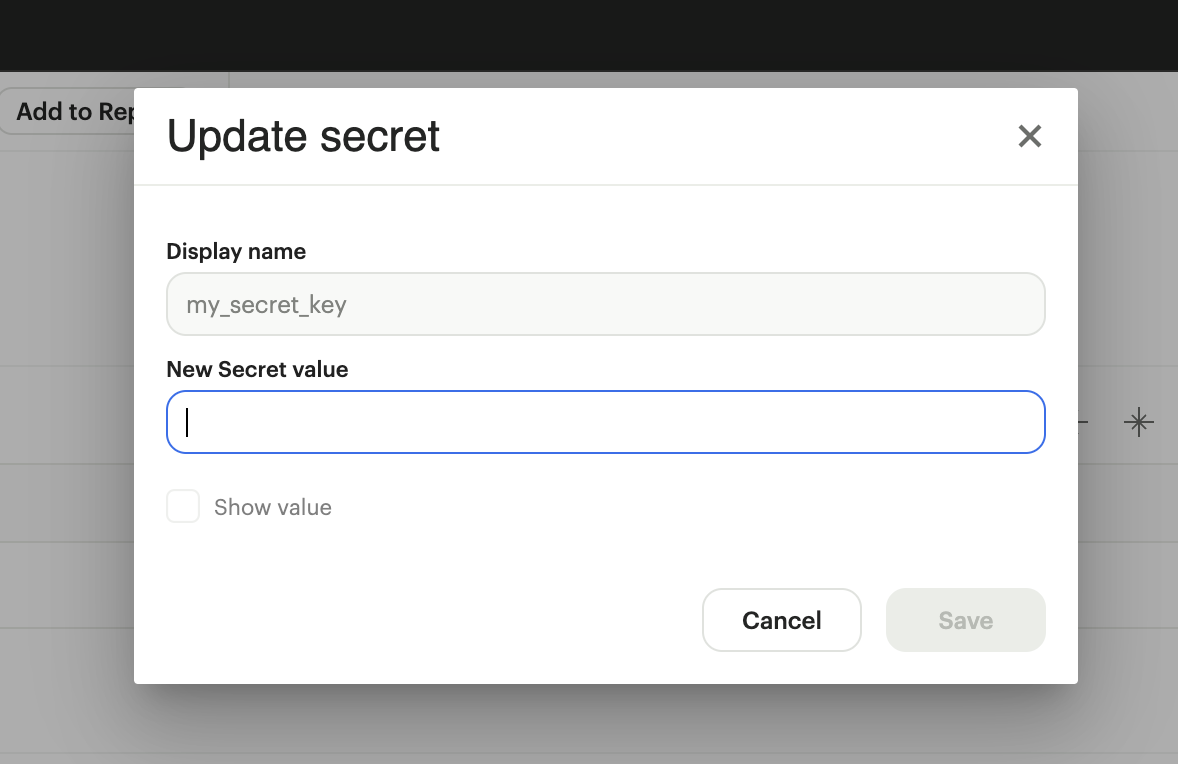
Editing Secrets
Once secret values are added, they will always be obfuscated. Editing a secret would mean replacing the old secret with a new one.
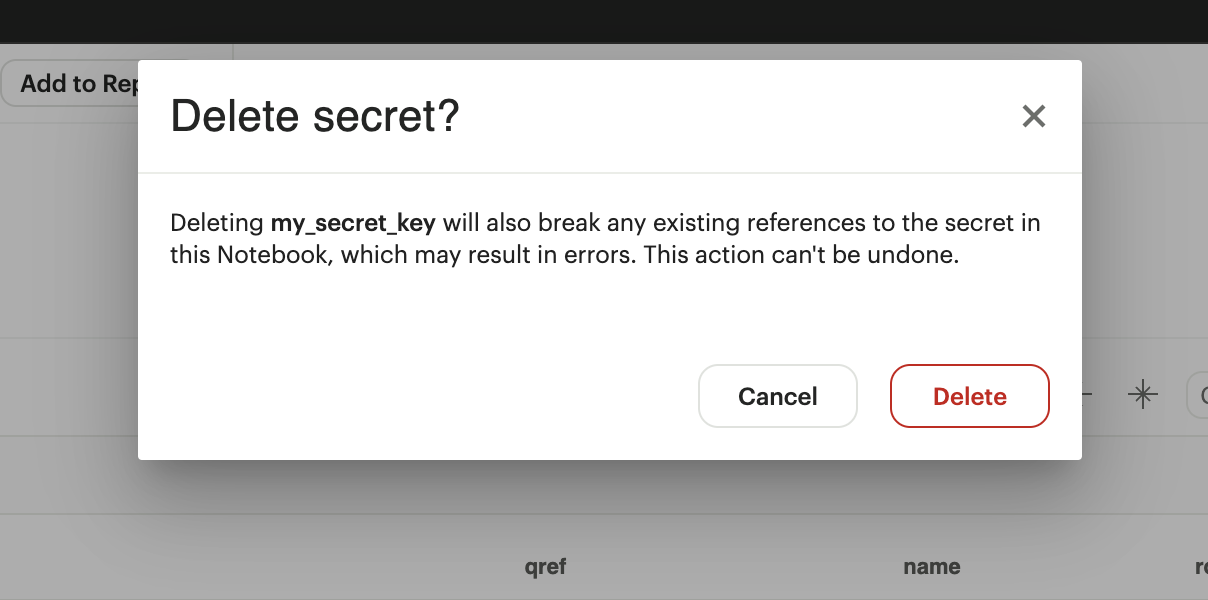
Deleting Secrets
Deleting a secret will also break any existing references to the secret in the Notebook. Any editor of the Report can delete a secret and the action can't be undone.
Administrative Features
- Admins can use Discovery Database (DDB) to get a list of all Reports using secrets.
- Changes made to secrets are audited, and customers should reach out to the support team to obtain that information.
Best Practices for Installing Python Libraries in Notebooks
When working with Python notebooks, managing library dependencies efficiently is crucial to avoid conflicts and ensure reproducibility. This guide outlines the best approach to installing Python libraries in notebooks while minimizing dependency management issues.
Recommended Installation Approach
To ensure a smooth installation process, follow these steps: (Using PyMC as an example)
Step 1: Install the Required Library Without Dependencies
Use the --no-deps flag when installing a library to prevent automatic dependency resolution, which can sometimes lead to conflicts:
!pip install --no-deps <Library_Name>==<Specific_Version>
Example:
!pip install --no-deps pymc==5.12.0
Step 2: Identify Required Dependencies
Once the library is installed, determine its required dependencies using pipdeptree:
!python3 -m pipdeptree -p <Library_Name>
Example:
!python3 -m pipdeptree -p pymc
This step provides a list of dependencies required by the library.
Below is how the output would look like for the above step. Identify the libraries where Installed : ?, and use them in step 3.

Step 3: Install Dependencies Manually
After identifying the dependencies, install them explicitly to avoid conflicts:
!pip install --no-deps <Dependency1>==<Specific_Version>
!pip install --no-deps <Dependency2>==<Specific_Version>
..
..
!pip install --no-deps <Dependencyn>==<Specific_Version>
Example:
!pip install --no-deps arviz==0.13.0
!pip install --no-deps fastprogress==0.2.0
!pip install --no-deps pytensor==2.19
This takes care of the 1st level of dependency. Re-run Step 2, it will then identify the 2nd level of dependency, and you can follow the template from Step 3 to take care of it.
Repeat until all dependencies are resolved.
Why Use This Approach?
- Prevents Unwanted Upgrades/Downgrades: Avoids pip from automatically upgrading or downgrading dependencies that may break other installed packages.
- Ensures Compatibility: Allows you to control the versions of dependent libraries, ensuring they work well together.
- Avoids Kernel Restarts: Minimizes the need for restarting the notebook kernel due to dependency conflicts.
By following this structured installation process, you can maintain a stable and efficient notebook environment.
FAQs
Q: How much memory is available to the Notebook?
Each Notebook session has the following resources available, depending on the version of your Mode Workspace:
| Available memory | Available CPU | Run-time limit | Suspend after idle for | Can install additional libraries? | |
|---|---|---|---|---|---|
| Mode Studio | 4 GB | 1 Core | 60 minutes | 30 minutes | No |
| Mode Paid Plans | 16 GB | 16 Cores | 12 hours | 60 minutes | Yes |
When suspended, the Notebook environment can be resumed at any time by running a cell, running the entire Notebook, or running the report.
Q: Can you visualize a notebook generated visualization with Mode’s native chart editor?
At this time, it is not possible to use our visualization tools, such as Quick Charts and Visual Explorer, to manipulate Python/R dataframes. To visualize data from a notebook, you will need to use a visualization library to create a visualization. If you would like to see this functionality added in the future, please contact our Support team and they will be happy to add a request on your behalf for future consideration.
Q: How to pass parameters into the notebook?
To pass parameters to your notebook, you must add them as a column in your SQL query. You can then access those column(s) in the dataset object in your notebook:
SELECT
 '{{team}}' AS param
FROM
 benn.nfl_touchdowns
This is an example report (check Show Parameter Code) showing how this can be done. You can view the Python code by clicking Notebook on the left side panel.
Q: Can I add a Markdown cell into a report?
Currently it is not possible to add a Markdown cell into the Report Builder, it would have to be an output of a Code cell.
We recommend using Text Boxes in our Report Builder. This includes text, links, images and more to add context to your report.
Q: Can I use dbt Metrics in Notebooks?
Yes. Since metrics charts are SQL Queries under the hood, their results are made available to the Notebook and appear as data frames alongside all other Query results in a given Report
Q: Can you apply report filters to notebook generated visuals?
Mode's report filters only work with our native charts and tables.
However, you can leverage Parameters for this case. When you select a parameter and run the report, the queries return values associated with the selected parameters. As a result, the Notebook and its visualizations will also be adjusted since the Notebook is purely powered by the query results.
Q: When do queries in the Notebook start to execute after a report run?
SQL Queries are kicked off simultaneously, and their results come in based on the processing time of your database. The notebook will wait until all SQL queries have successfully returned results before running. This is because the logic is set up such that the notebook does not know which query results execution is dependent on, so to be safe it waits for all the SQL queries to finish running.
Therefore, it is possible that the notebook would render faster, but it must wait for all queries to finish running.
Q: I am on a paid Mode Business or Enterprise plan. Why can’t I pip install or upgrade certain libraries in the Notebook?
If you want to install or upgrade additional libraries or versions, we recommend following the steps outlined here. Please be sure to run the exact command listed on the site. If these commands do not work for you, it is possible that we do not support the library or the version of the library that you are trying to upgrade to.
Due to the current architecture of the Notebook, there are certain libraries that we are unable to support. The ability to manually install additional libraries or upgrade to newer versions is a workaround that we offer for these cases. However, we cannot guarantee that these libraries will function properly if they are not included in our list of supported libraries.
If you do not see a library listed as supported, it is considered a feature request. Please contact our support team to confirm and request the library.
Q: Do you have a tutorial where I can learn Python for business analysis using real-world data?
We do have a tutorial available that teaches Python for business analysis using real-world data. This tutorial is designed for users with little or no experience with Python, and it covers everything from the basics of the language to advanced techniques for analyzing and visualizing data.
If you’re interested in learning how to use Python for business analysis, this tutorial is a great place to start. It includes step-by-step instructions and hands-on exercises to help you apply what you learn to real-world scenarios.
To access the tutorial, please visit the page here. If you're interested in learning SQL as well, you can access this page here. We hope you find it helpful and we look forward to hearing your feedback.
Was this article helpful?