
Mode Help
Visualize and present data
Interactivity
Mode's native charts include various tools for interacting with the data they display. When a viewer uses any of the interactive features below, none of these changes will persist beyond that viewer's session, and the underlying report will not be affected.
The following options are available on hover in Mode’s native charts:

- Back / Forward: Undo and redo any exploratory modifications to the chart.
- Link: Generates a URL that other logged-in members of your Mode Workspace can use to view only that specific chart.
- Explore: Launches a drag-and-drop interface that can be used to customize the chart or explore the data. Learn more about explorations in this help doc.
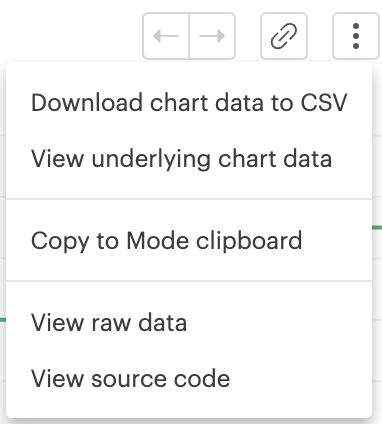
- Within the overflow menu (an icon with 3 vertical dots), there are several additional options:
- Download chart data to CSV: Download the aggregated, filtered chart summary data as a CSV.
- View underlying chart data: View the filtered, row-level data powering the chart. This data can also be exported by using the export to CSV button. Clicking on the “Export to CSV” option will start generating the CSV file and add it to the "Recent Downloads" drawer. A blue loading icon will appear while the file is being generated, a red X icon will indicate an error, and a green check icon will indicate that the file is ready for download. Clicking on the "Download" button next to the file will download the CSV file. There is a 300,000 row limit that can be exported, above which the data will be truncated.
- Copy to Mode clipboard: Copy the chart to be pasted in the same or a different Mode Report
- View source code: View the SQL syntax of the data that powers the chart.
- View raw data: View the data generated by the source code that powers the chart.
Depending on the chart type and available data, viewers can click on an individual data point for additional options:
- Explore: Launches a drag-and-drop interface that can be used to explore the data behind the chosen point. Learn more about explorations in this help doc.
- View Data: Opens a display table containing the data behind the chosen data point. This data can also be exported by using the export to CSV button. Clicking on the “Export to CSV” option will start generating the CSV file and add it to the "Recent Downloads" drawer. A blue loading icon will appear while the file is being generated, a red X icon will indicate an error, and a green check icon will indicate that the file is ready for download. Clicking on the "Download" button next to the file will download the CSV file. There is a 300,000 row limit that can be exported, above which the data will be truncated. This option is also available in the chart designer and Explorations.
- Granularity controls: Available when the chart's X-axis is a time-series and more granular data is available in the underlying data. This option can be disabled by un-checking “Show granularity controls” in the chart settings gear icon in the chart designer
Drill anywhere
The drill anywhere feature enables the user to navigate through different levels of detail within a single chart. The drill path is built by the end user during the drill process by selecting specific fields from the underlying data source to explore further. To revert back to previous levels, the user can use the back button to "drill-up." This functionality is available only for Visual Explorer charts and Pivot Table Quick Charts. To make use of this feature effectively, the chart should include both a Measure and a Dimension.
Marks are visual elements that represent individual data points on a chart. Example mark types are bar, line, area, etc. Learn more about mark types in this help doc. When the "Auto" option is selected for the mark type when creating a chart that has drill anywhere enabled, the resulting charts from the drill operations will automatically update to the optimal mark type based on the fields used. For example, if one axis has an aggregated field and the other has a temporal field, line is chosen as the mark type. If a specific mark type is chosen, the resulting charts from the drill operations will use that chosen mark type.
By default, the ability to drill anywhere is available in the chart designer and Explorations. However, to extend this functionality to end users in Report View or White Label Embeds, the "Enable drill anywhere in Report View" option must be turned ON in the Report settings.
Filters and parameters
Filters and Parameters let viewers customize a report's output without touching code or modifying its configuration.
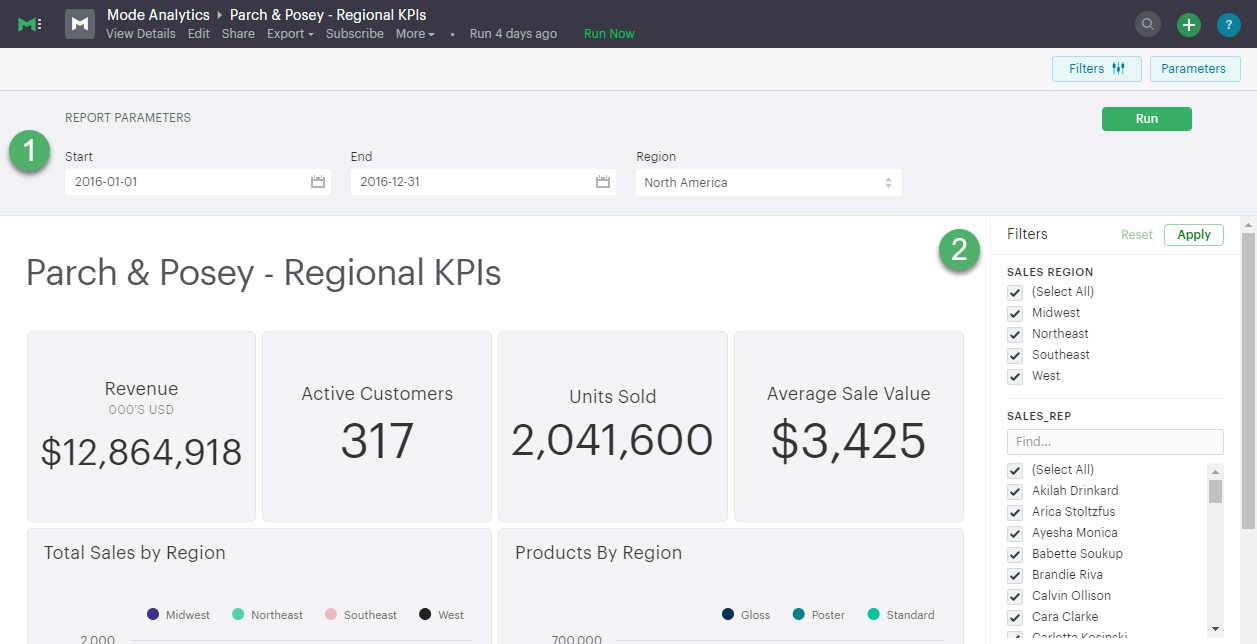
Parameters: Dynamically modify the SQL code of the report before it is executed against the database. When a report viewer changes a parameter's value, the report must be re-run to see any changes to the results. - Filters: Modify the data presented in a report's built-in charts and visualizations. Filters are applied to the data visualized in the browser after all of the report's queries have finished running.
How to add filters to a report
-
Open the report builder and select Add Filter.
-
A list of all columns from all queries in the report will appear. If the same column name appears in multiple queries in your report, applying a corresponding filter will filter all columns of that name across all queries.
-
Choose the column you want to filter on and click Add.
-
The filter will appear on the right side of the report builder. To customize the filter, hover over it and click on the gear icon. The customization options available are:
-
Selection options:
- Single-select: allows selection of only one filter option.
- Multi-select: allows selection of multiple filter options. This is the default.
-
Control options:
- List: A list of options are presented to the user.
- Dropdown: A list of options presented in a dropdown menu. This is the default control option when a new Report filter is added.
-
Show "All" in the list: allows selection of all available filter values as an option. This is turned on by default. Unselecting this option will hide the "Select All" option.
-
Only display relevant values dynamically adjusts the filter value list to display only the relevant values based on previously applied filters. Irrelevant values will be automatically hidden. This option is available for list filters of any data type. When this setting is turned off (default setting), the filter value list displays all available values in the underlying dataset.
-
Filter position controls:
- Move up: moves the filter above the filter right above it.
- Move down: moves the filter below the filter right below it.
- Move top: moves the filter to the top of the list.
- Move bottom: moves the filter to the bottom of the list.
The filters can also be re-positioned using drag and drop
-
Reset filter: resets all selected options of the filter.
-
Delete: deletes the filter from the report.
-
To configure a specific set of filter selections as the default for a report, add the necessary filter selections in the report builder and then select the Set as Default option. This action will save the filter selections and they will be automatically applied each time the report is viewed.
Was this article helpful?