Embedded analytics
Customized embedded analytics for your business
Scale your reporting with branded analytics embedded in your application.
From out-of-the-box charts to total customization
Mode makes it easy to quickly analyze and present your data, whether that’s embedded in your internal apps or presented as robust data tools to customers.

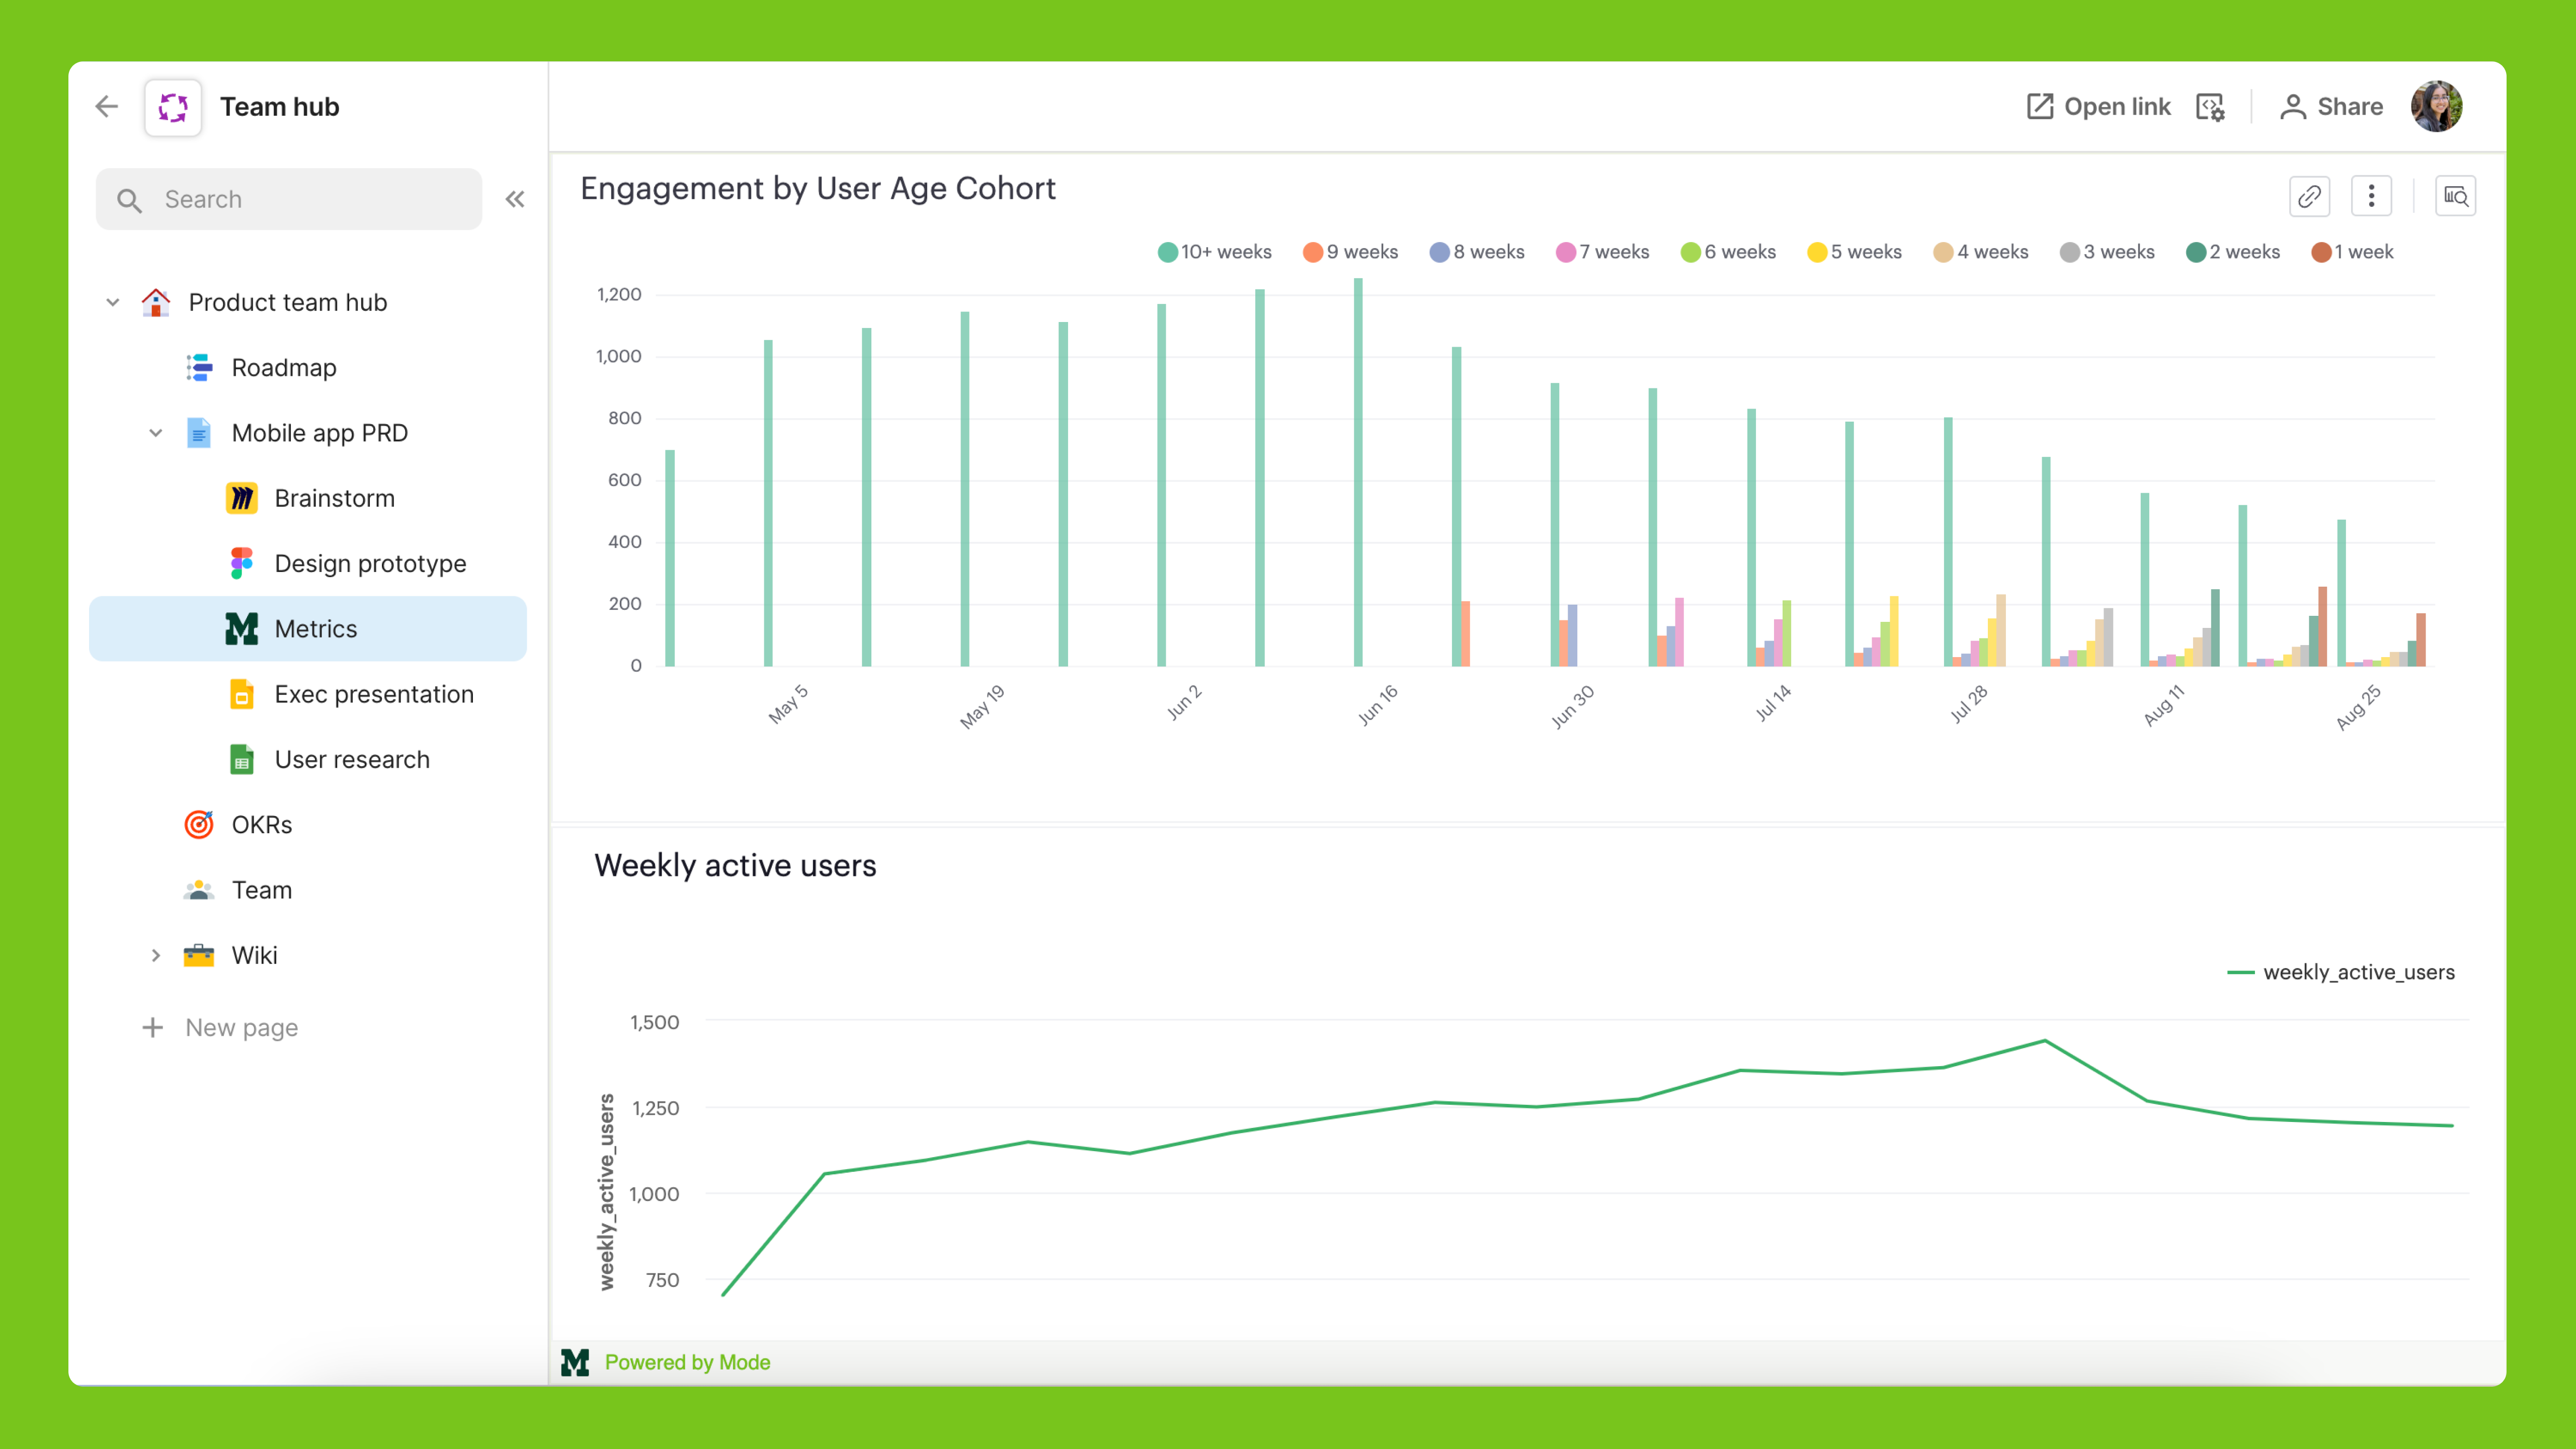
Use our charts
Layer Mode charts right on top of your SQL results.

Customize styles
Style our report elements with your CSS.

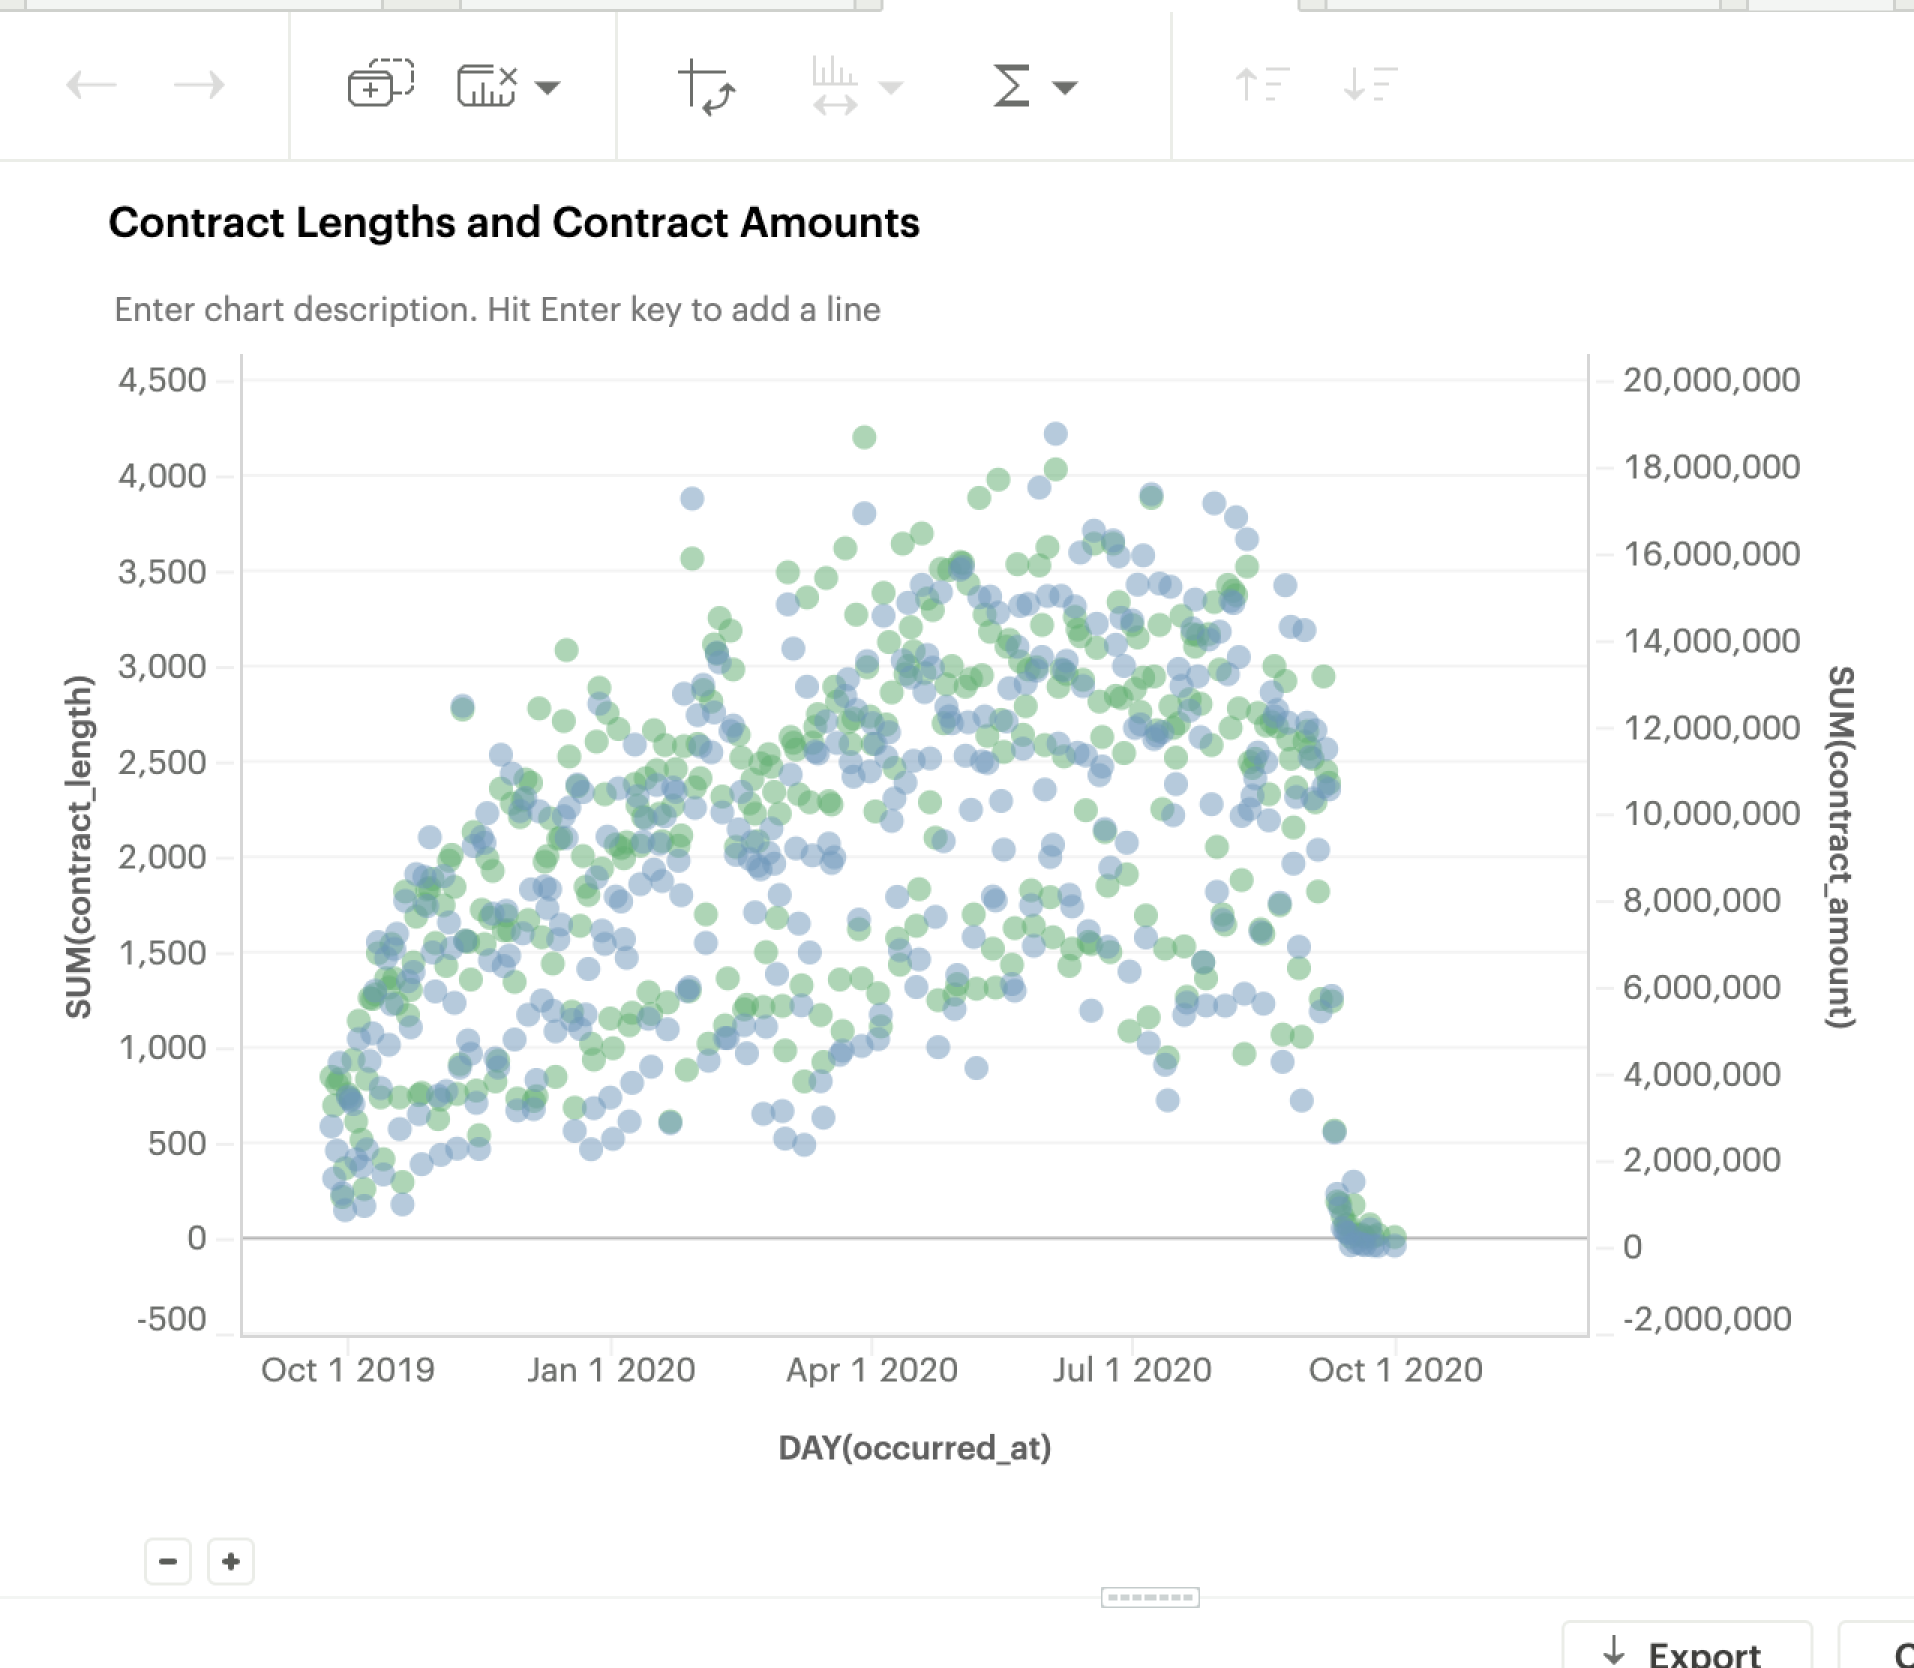
Create your own
Customize visualization with libraries like D3.js and Leaflet.
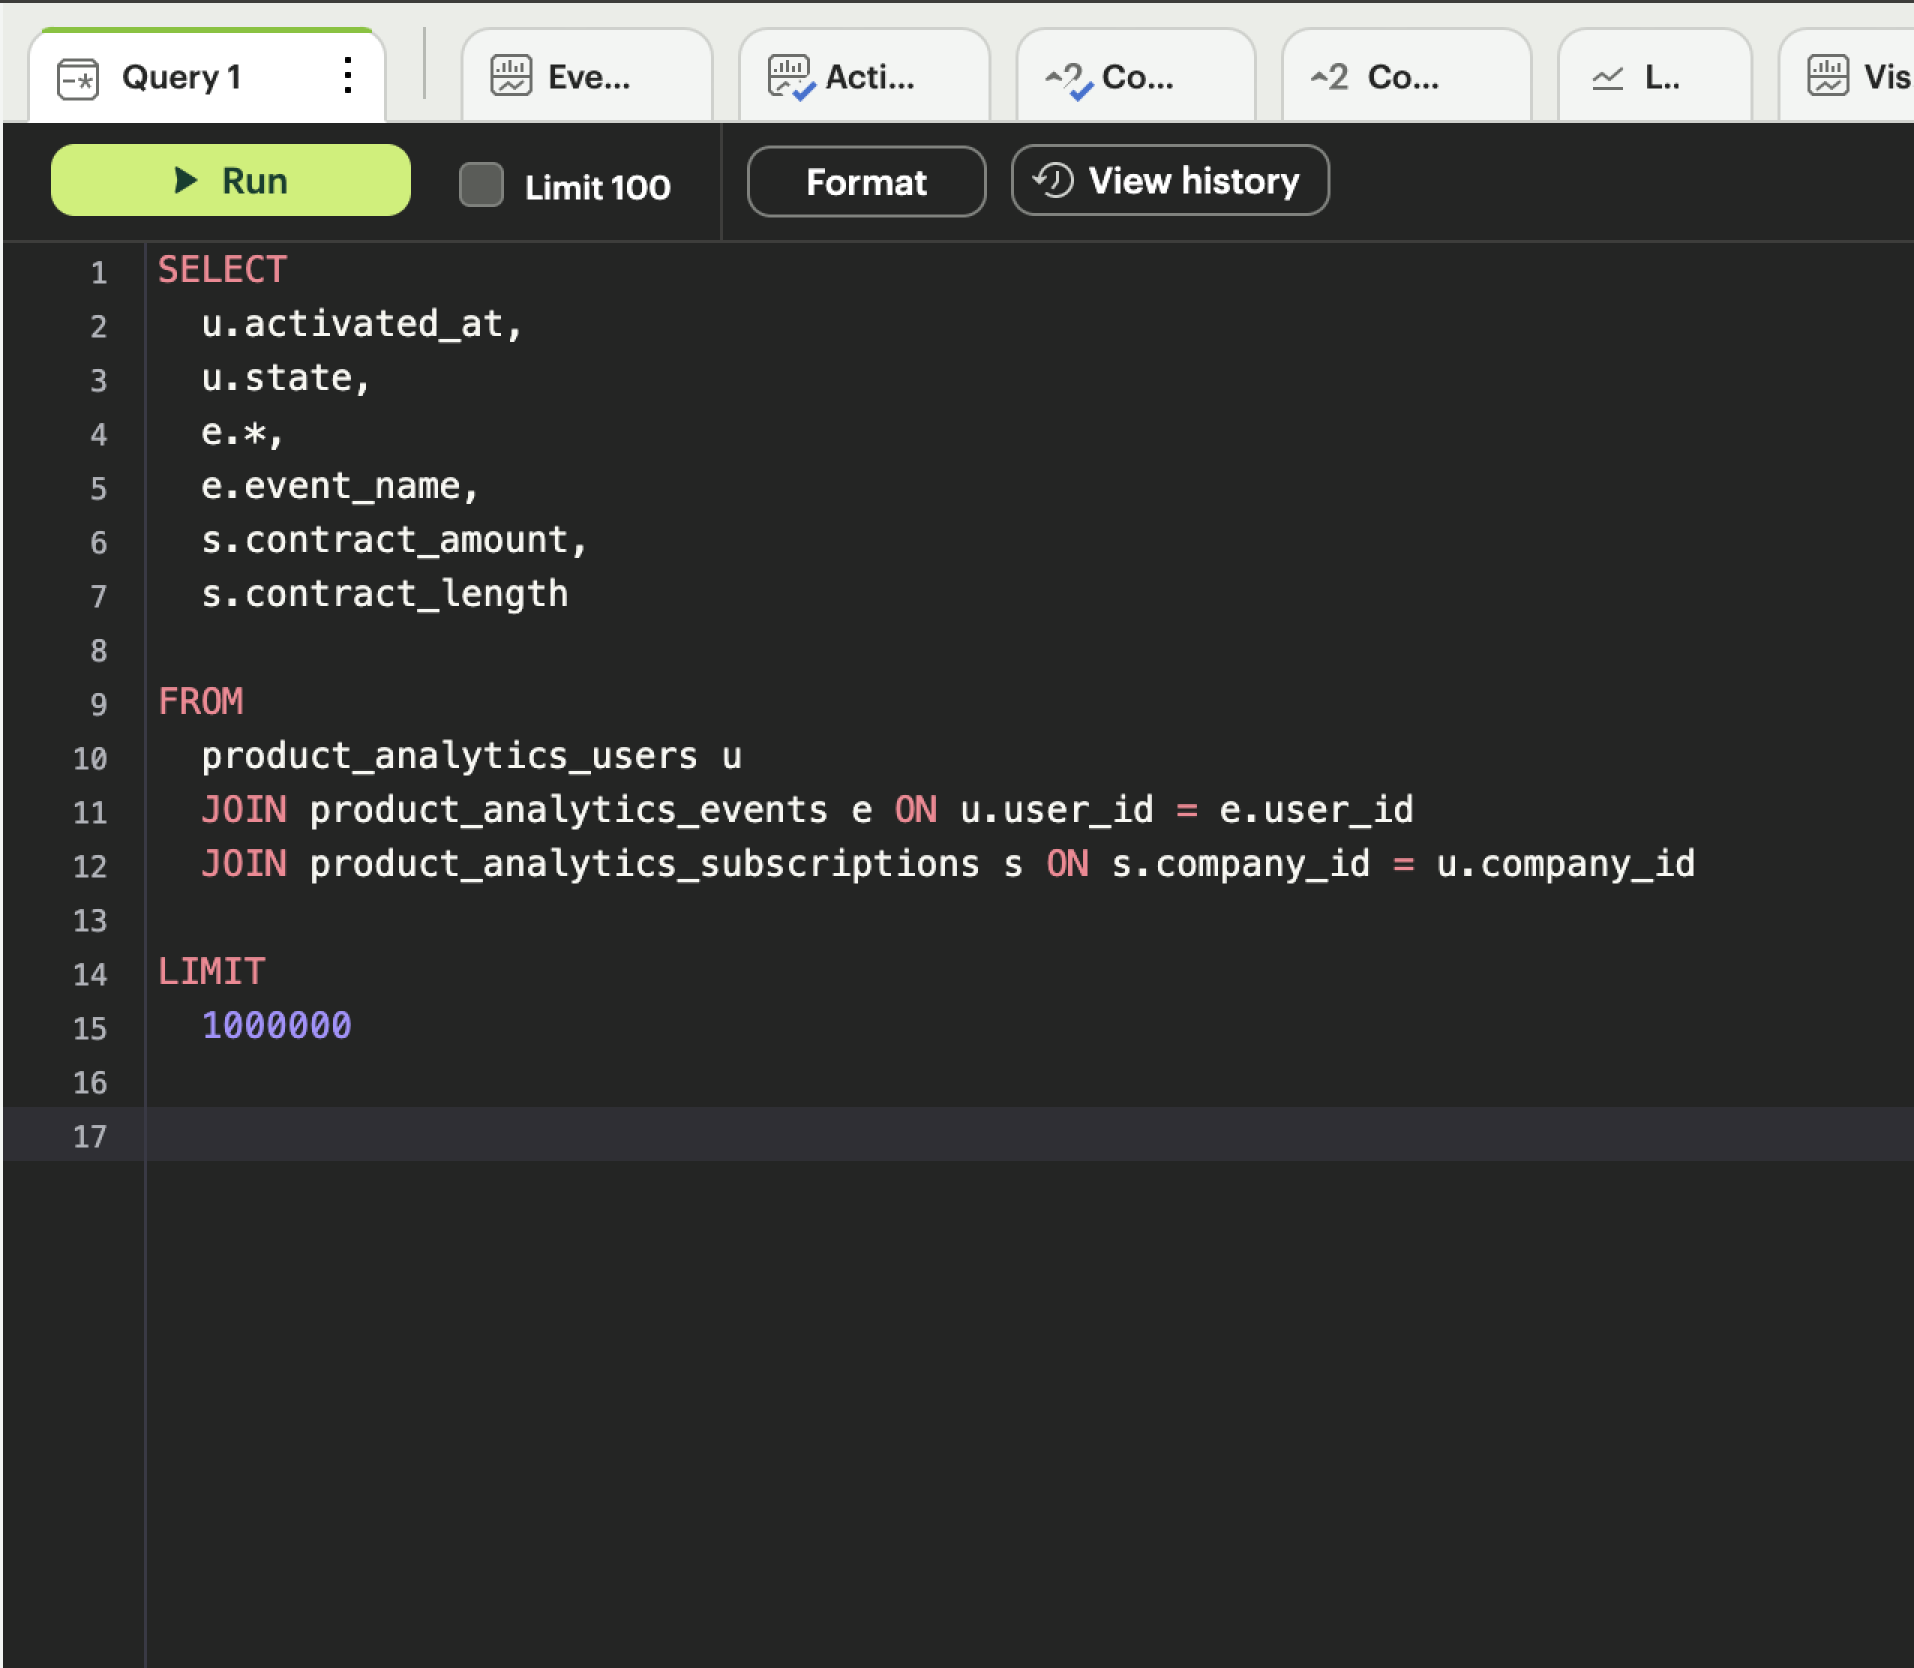
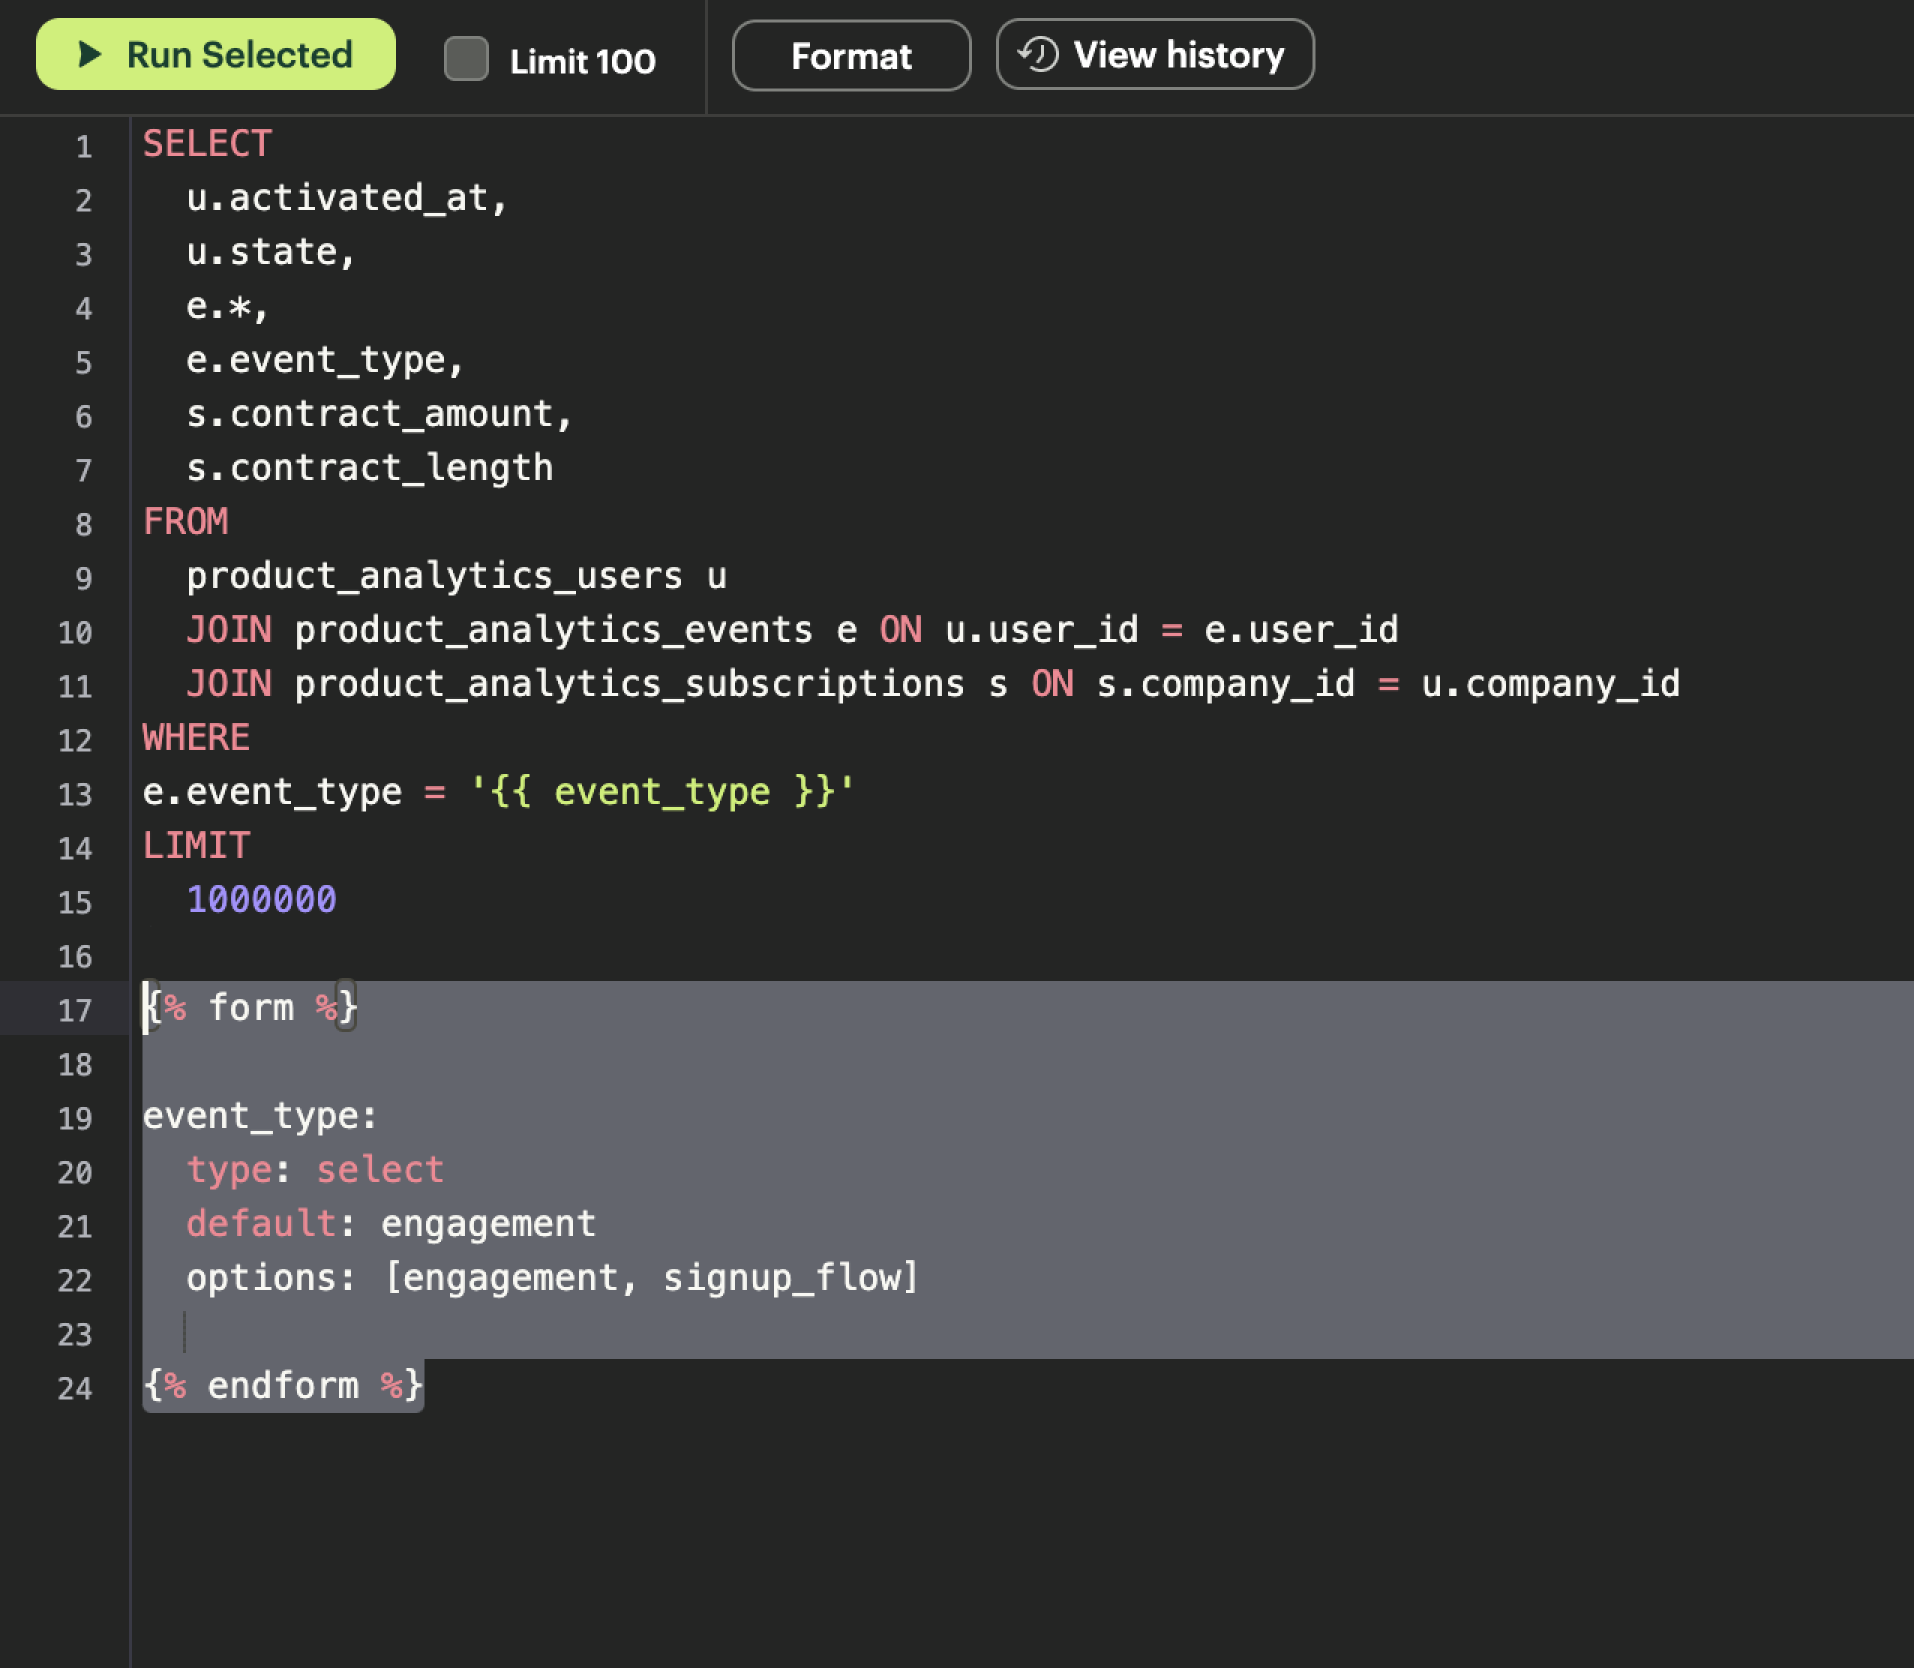
Quickly build embedded reports from code
Use our SQL Editor to rapidly prototype the queries needed to serve insightful data.
Mode’s embedded analytics turned our internal portal into a one-stop shop for the whole organization to access their data, regardless of technical capabilities or data expertise.

Damir Uzunic
Director of Business Intelligence

50%
more people using data daily
Insights at your fingertips
From building reusable datasets to delivering advanced analysis with Python & R Notebooks - business insights are only a keystroke away.


Get more from your data
Your team can be up and running in 30 minutes or less.