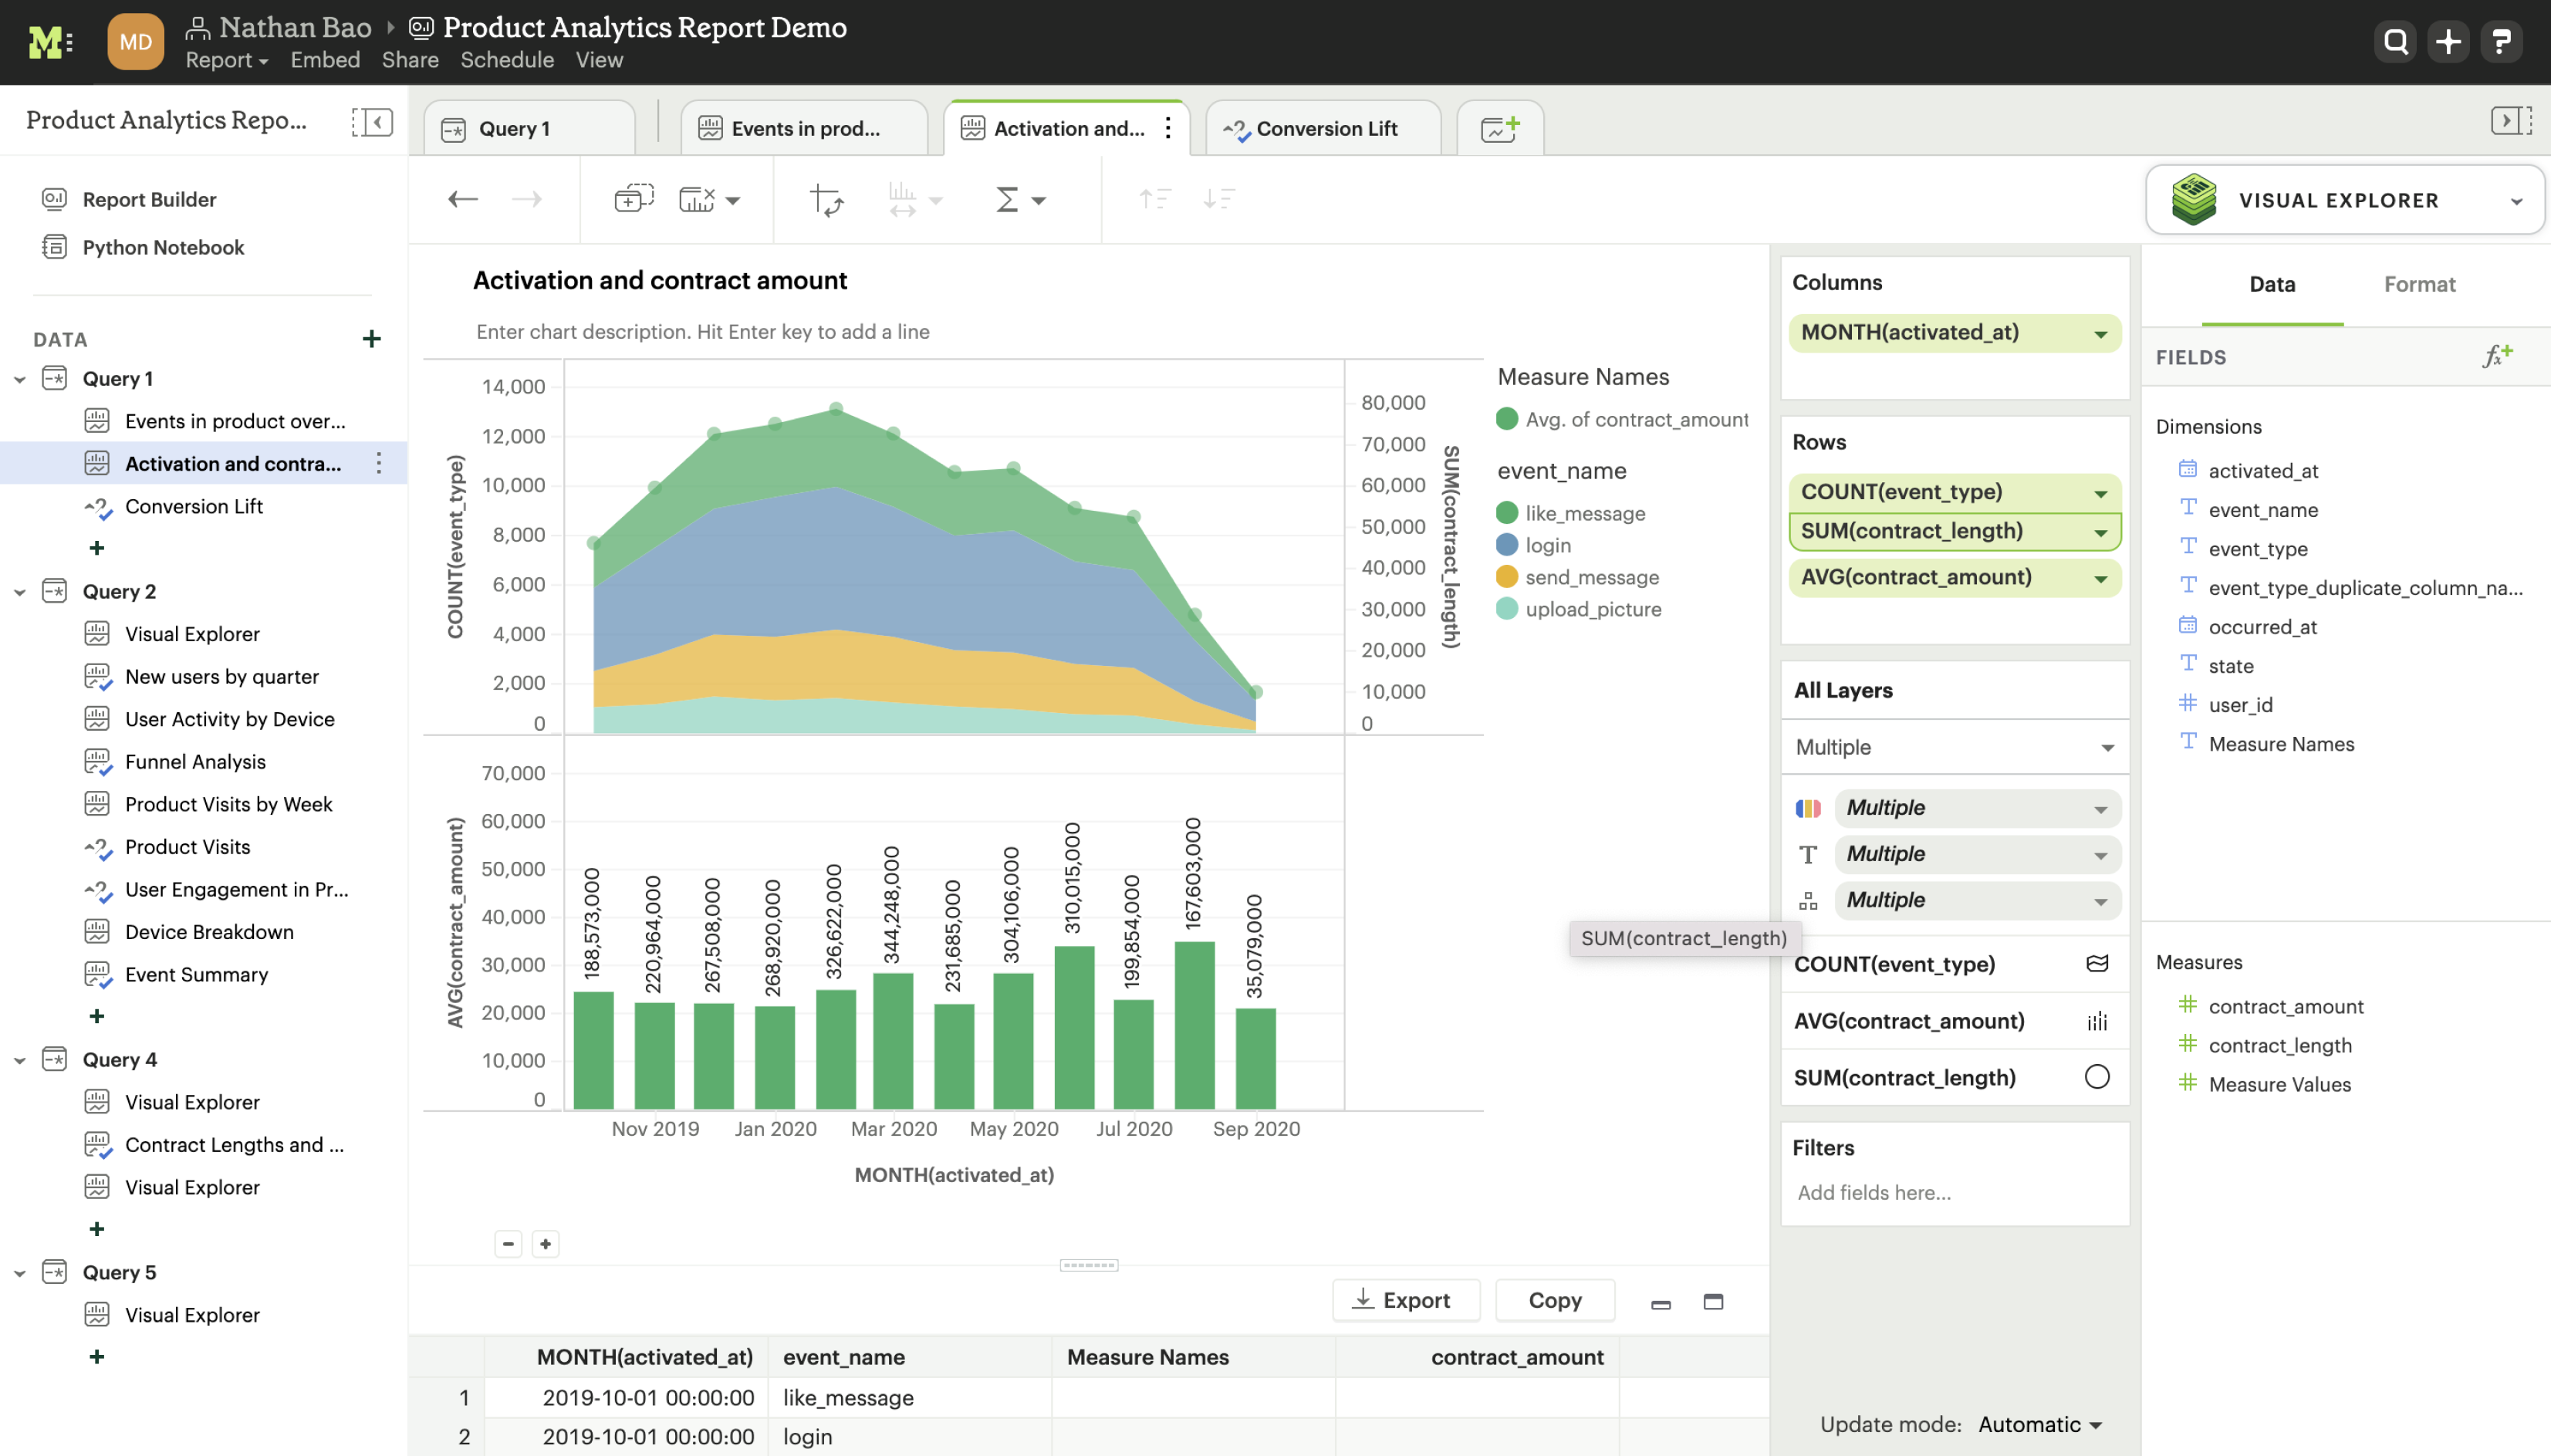
Visual Explorer
Drag and drop your way through uncharted data
When you need to analyze data visually, or find your next business-shifting aha moment, call on Mode’s Visual Explorer.

Iterate rapidly
Quickly iterate through chart types thanks to the Helix data engine’s ability to ingest large datasets.

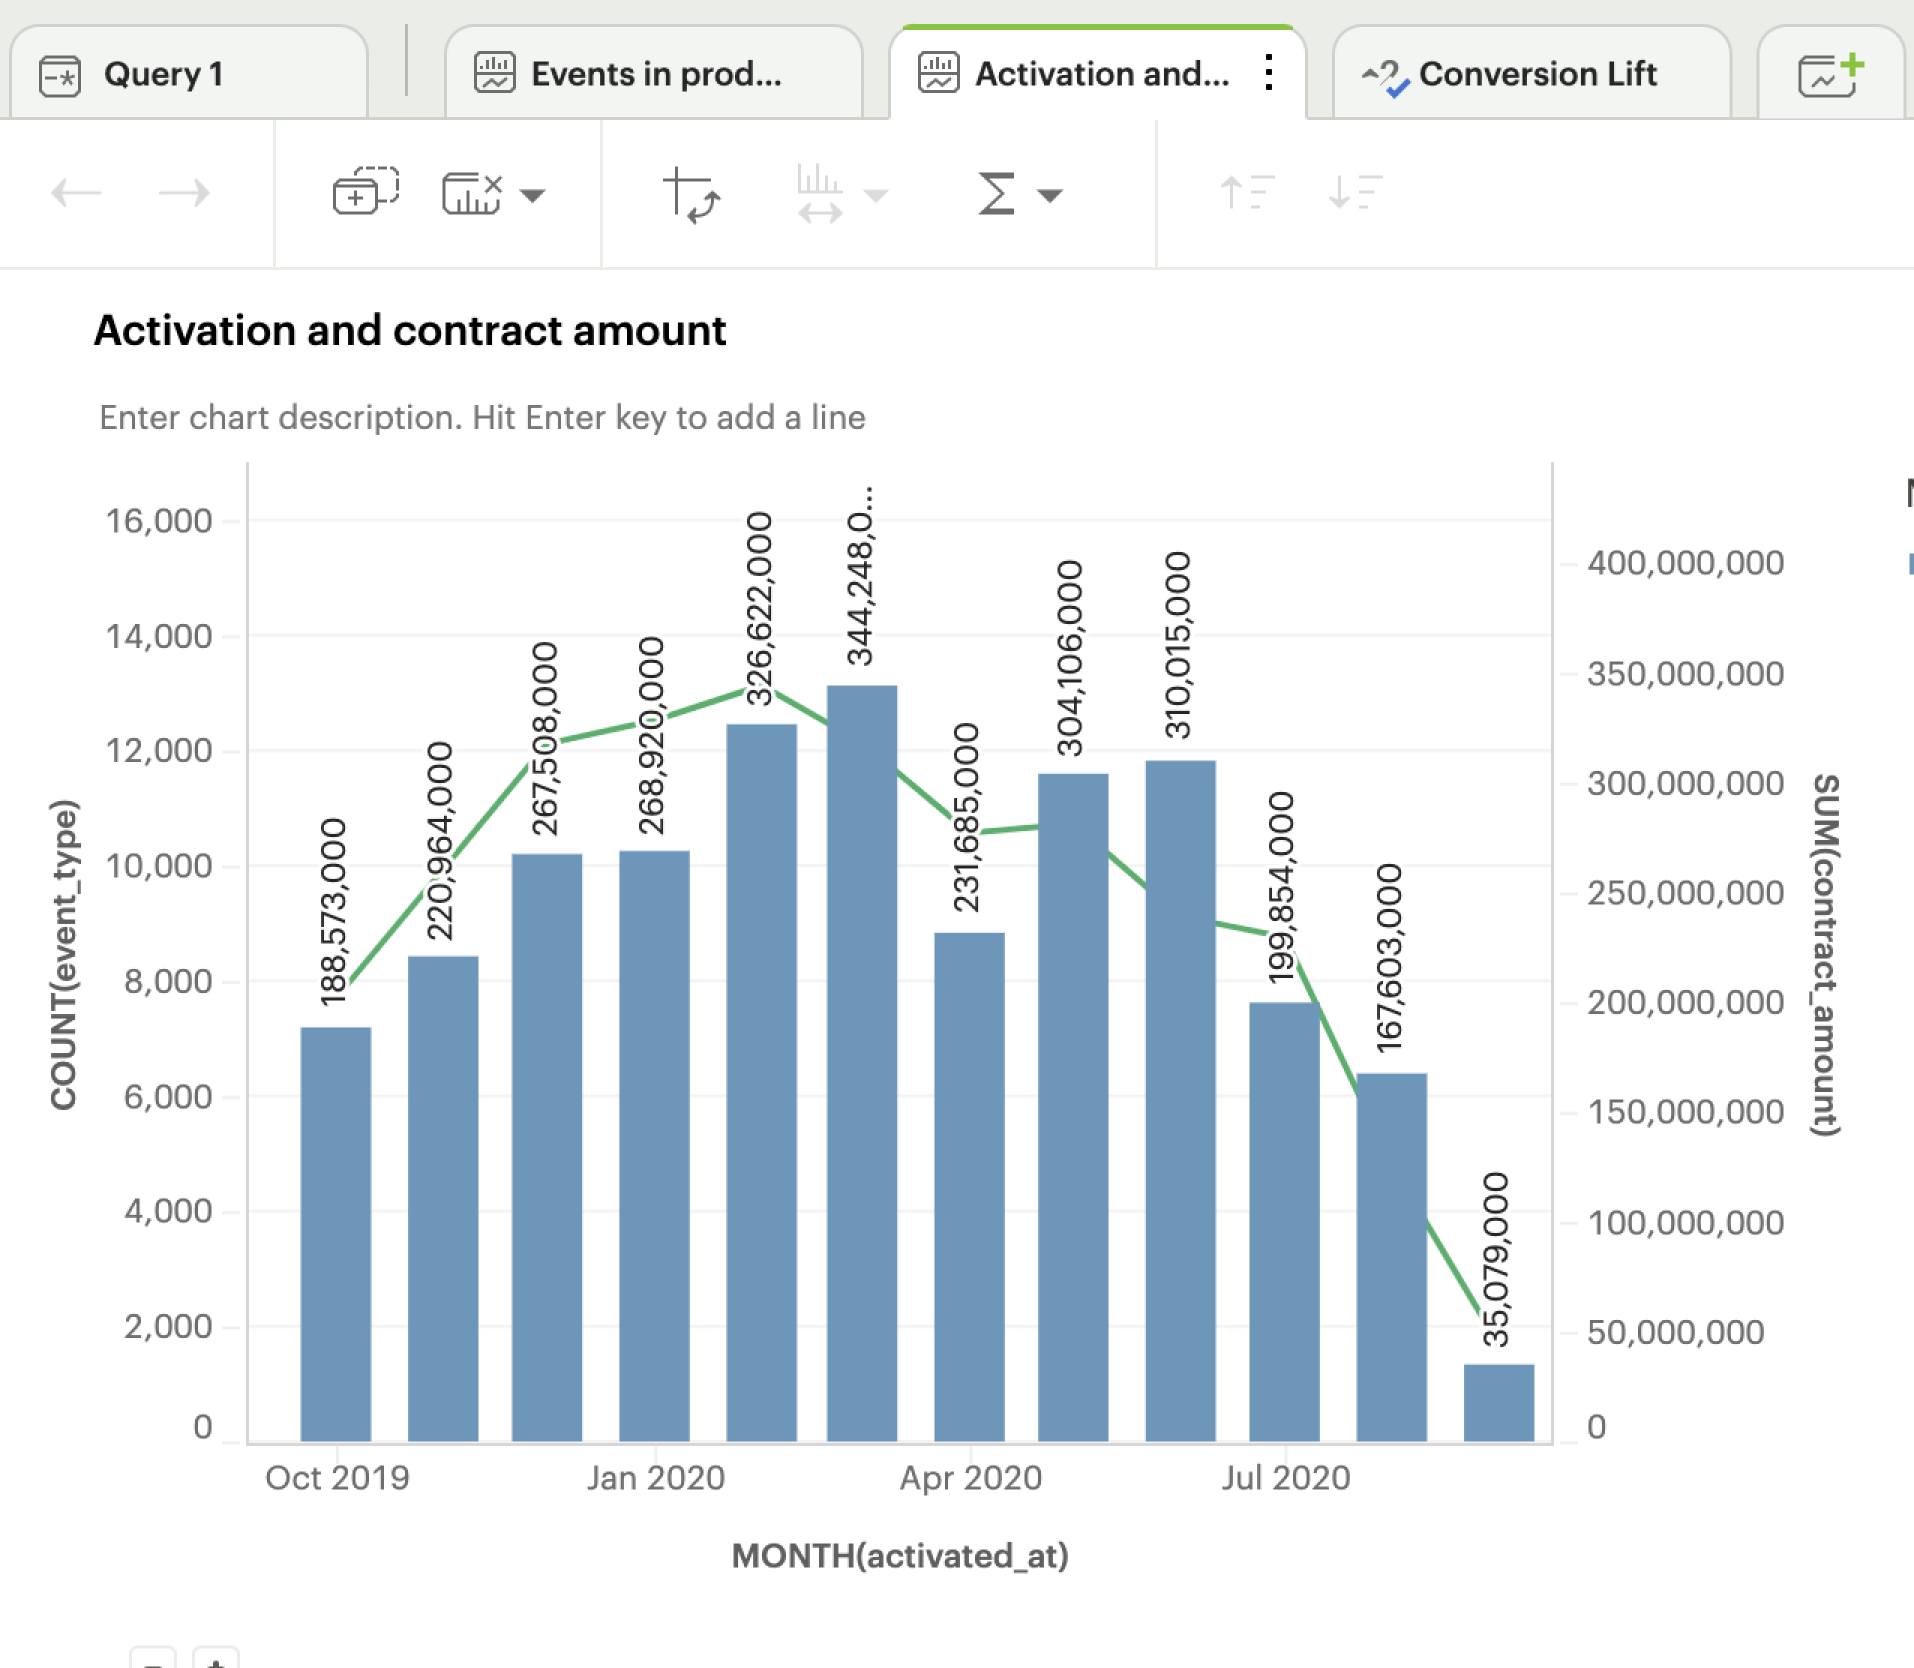
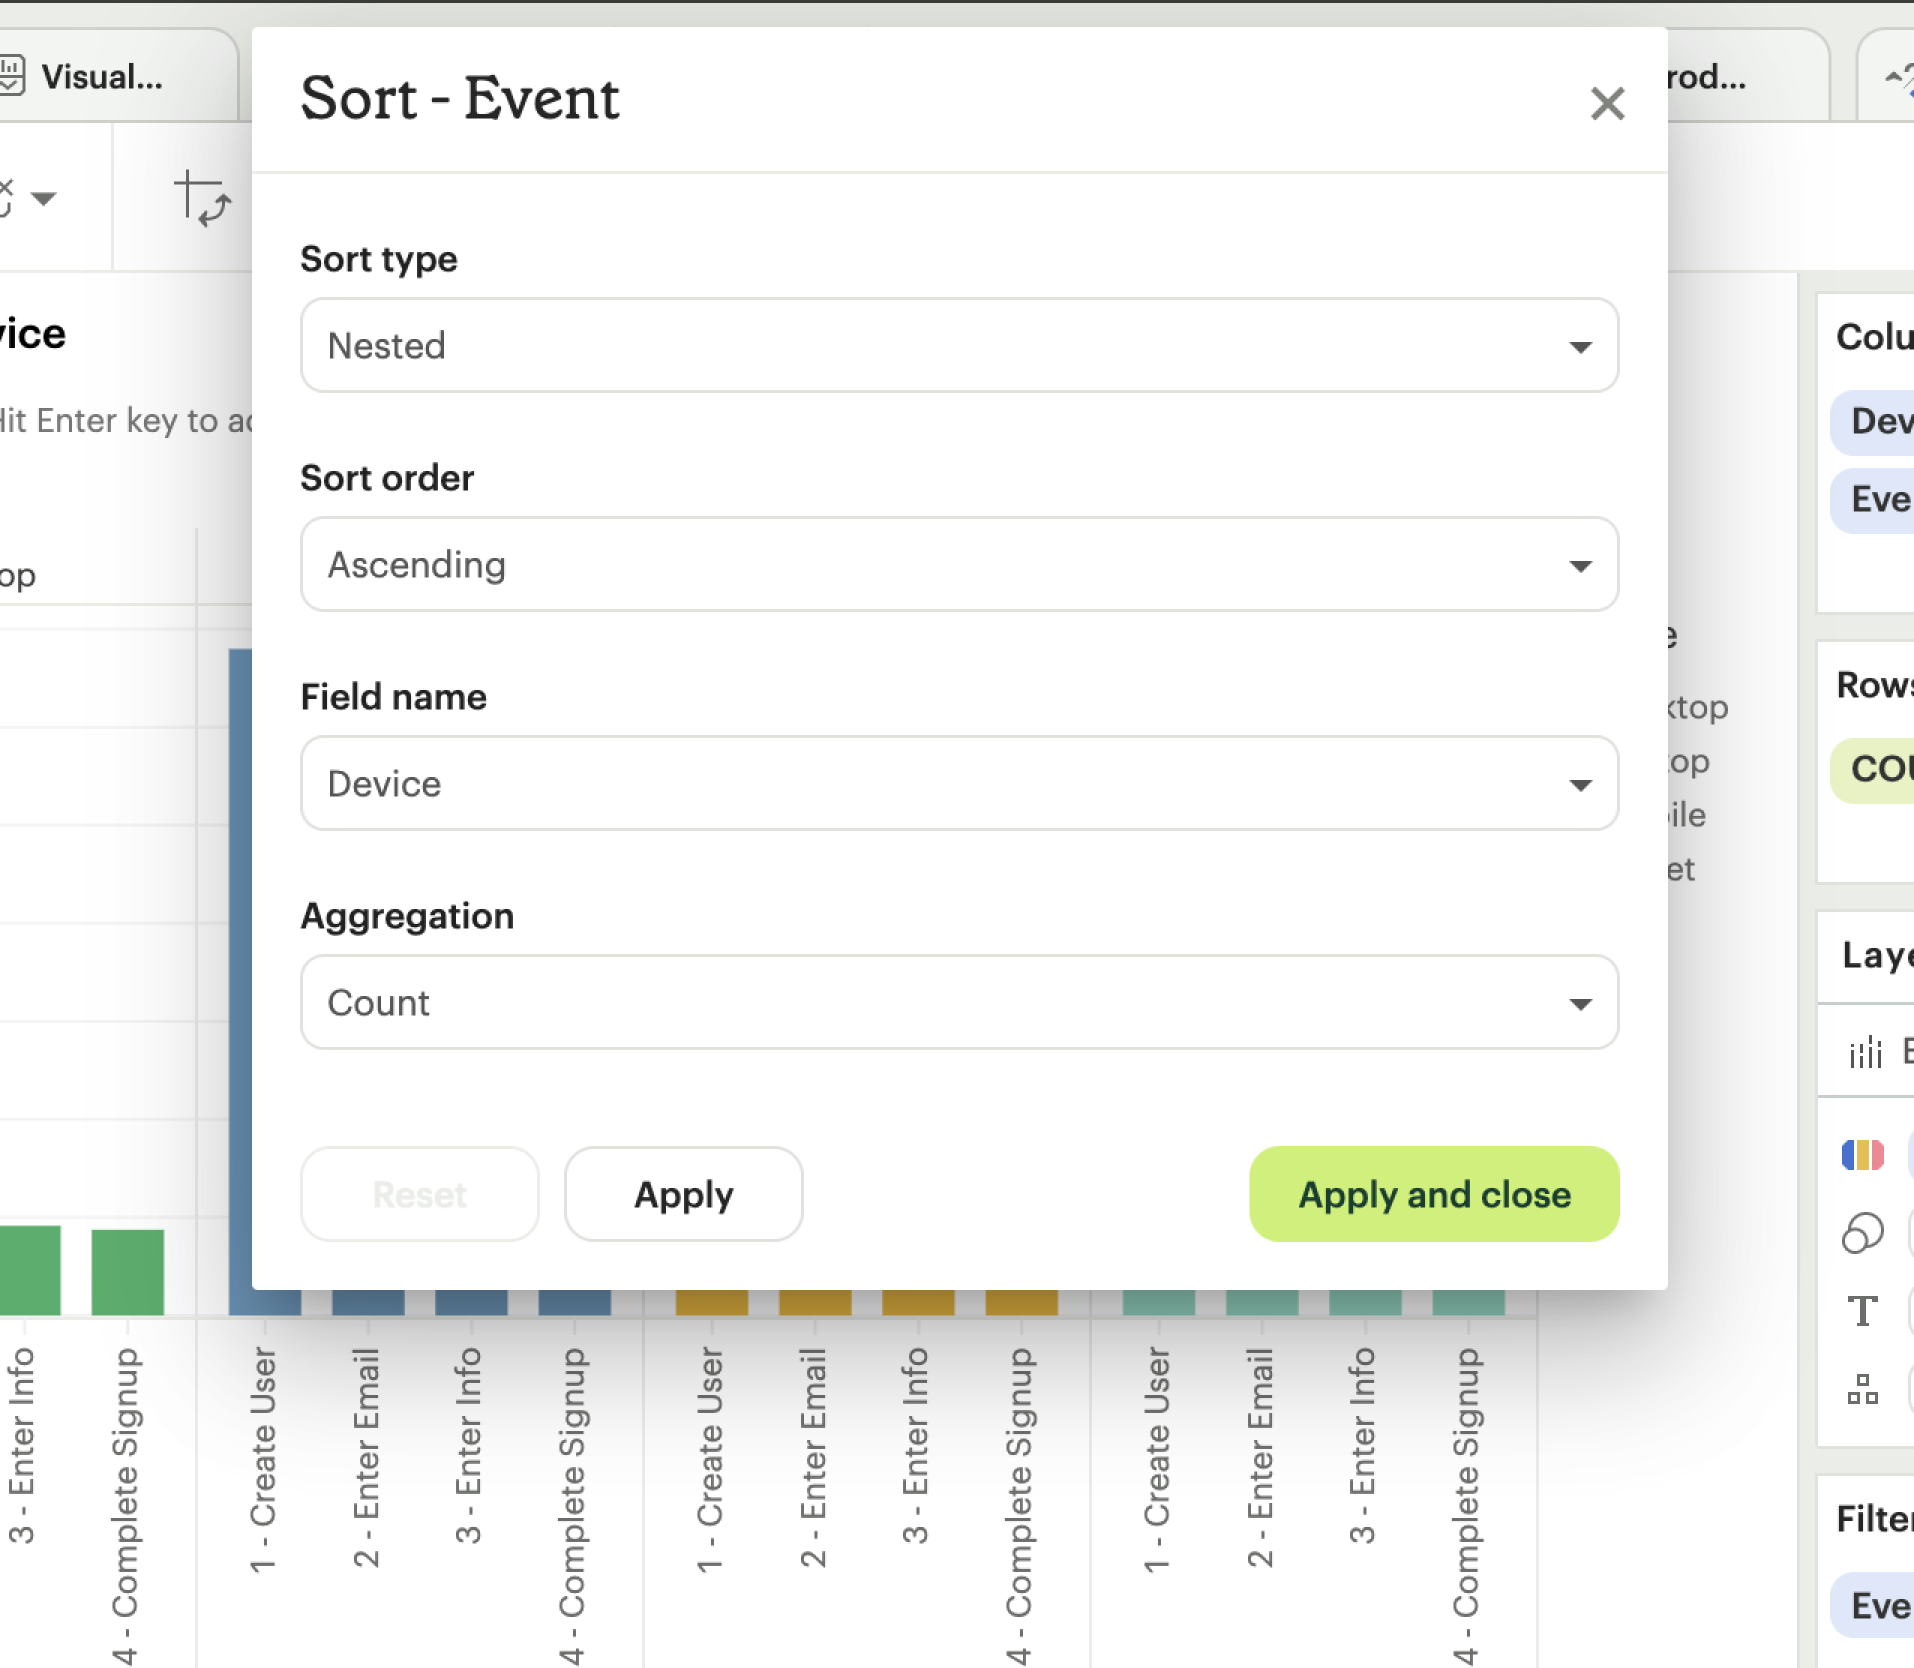
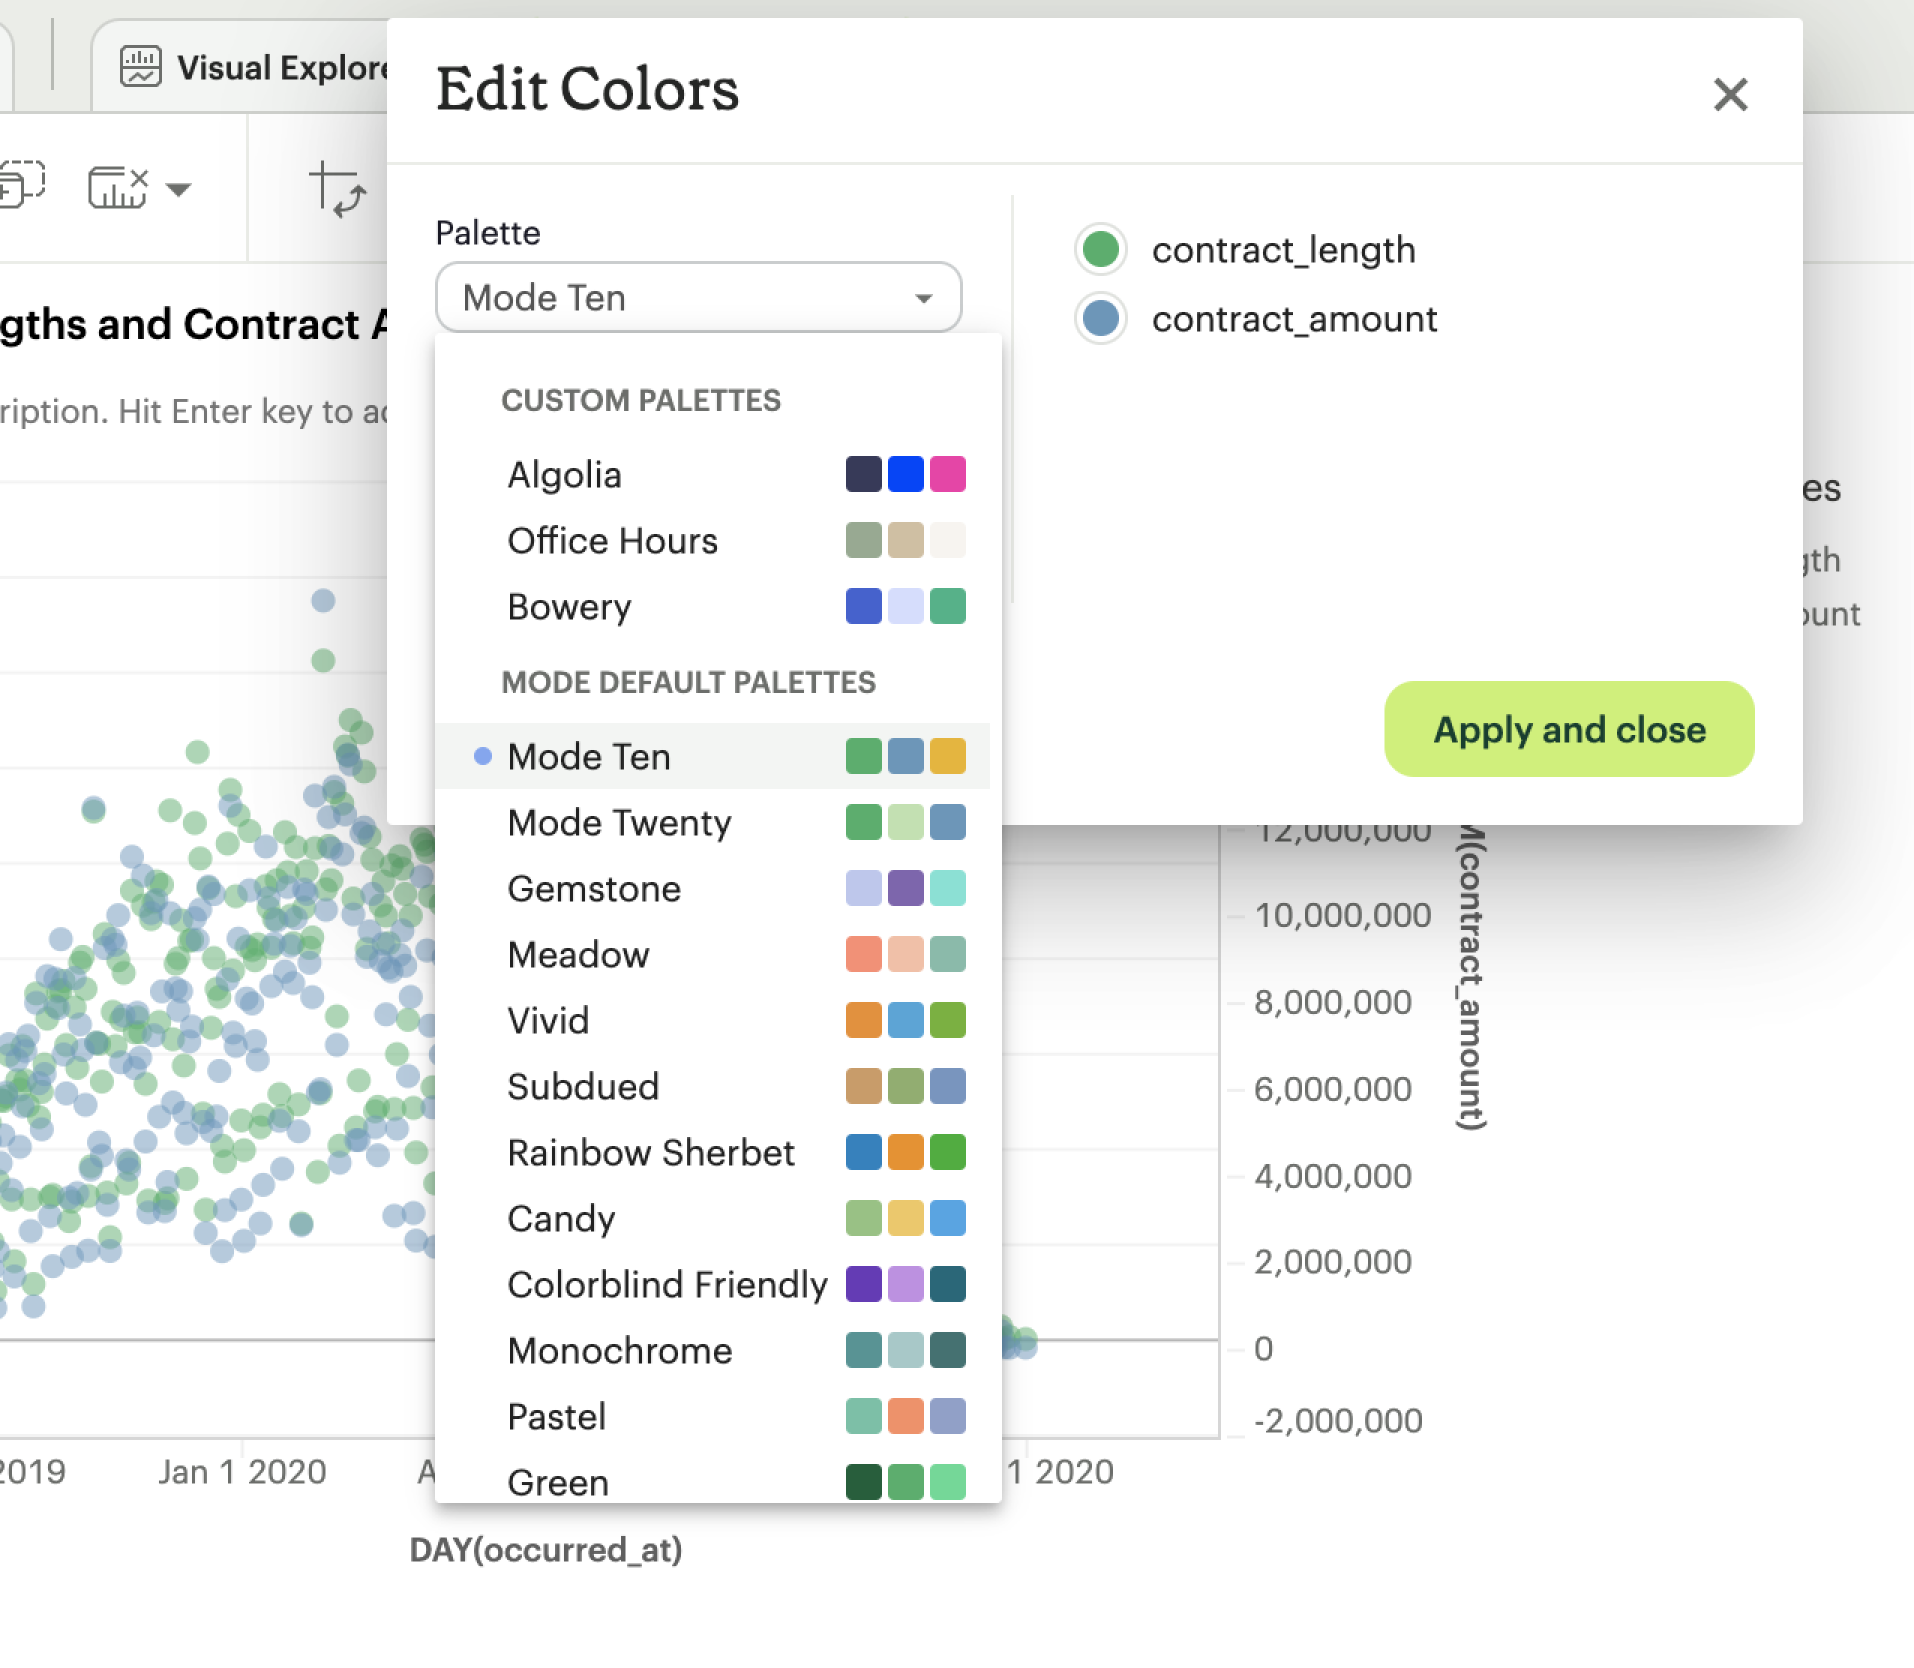
Highlight key trends
Change the color or form of individual chart elements, and show off your ideas with clarity and style.

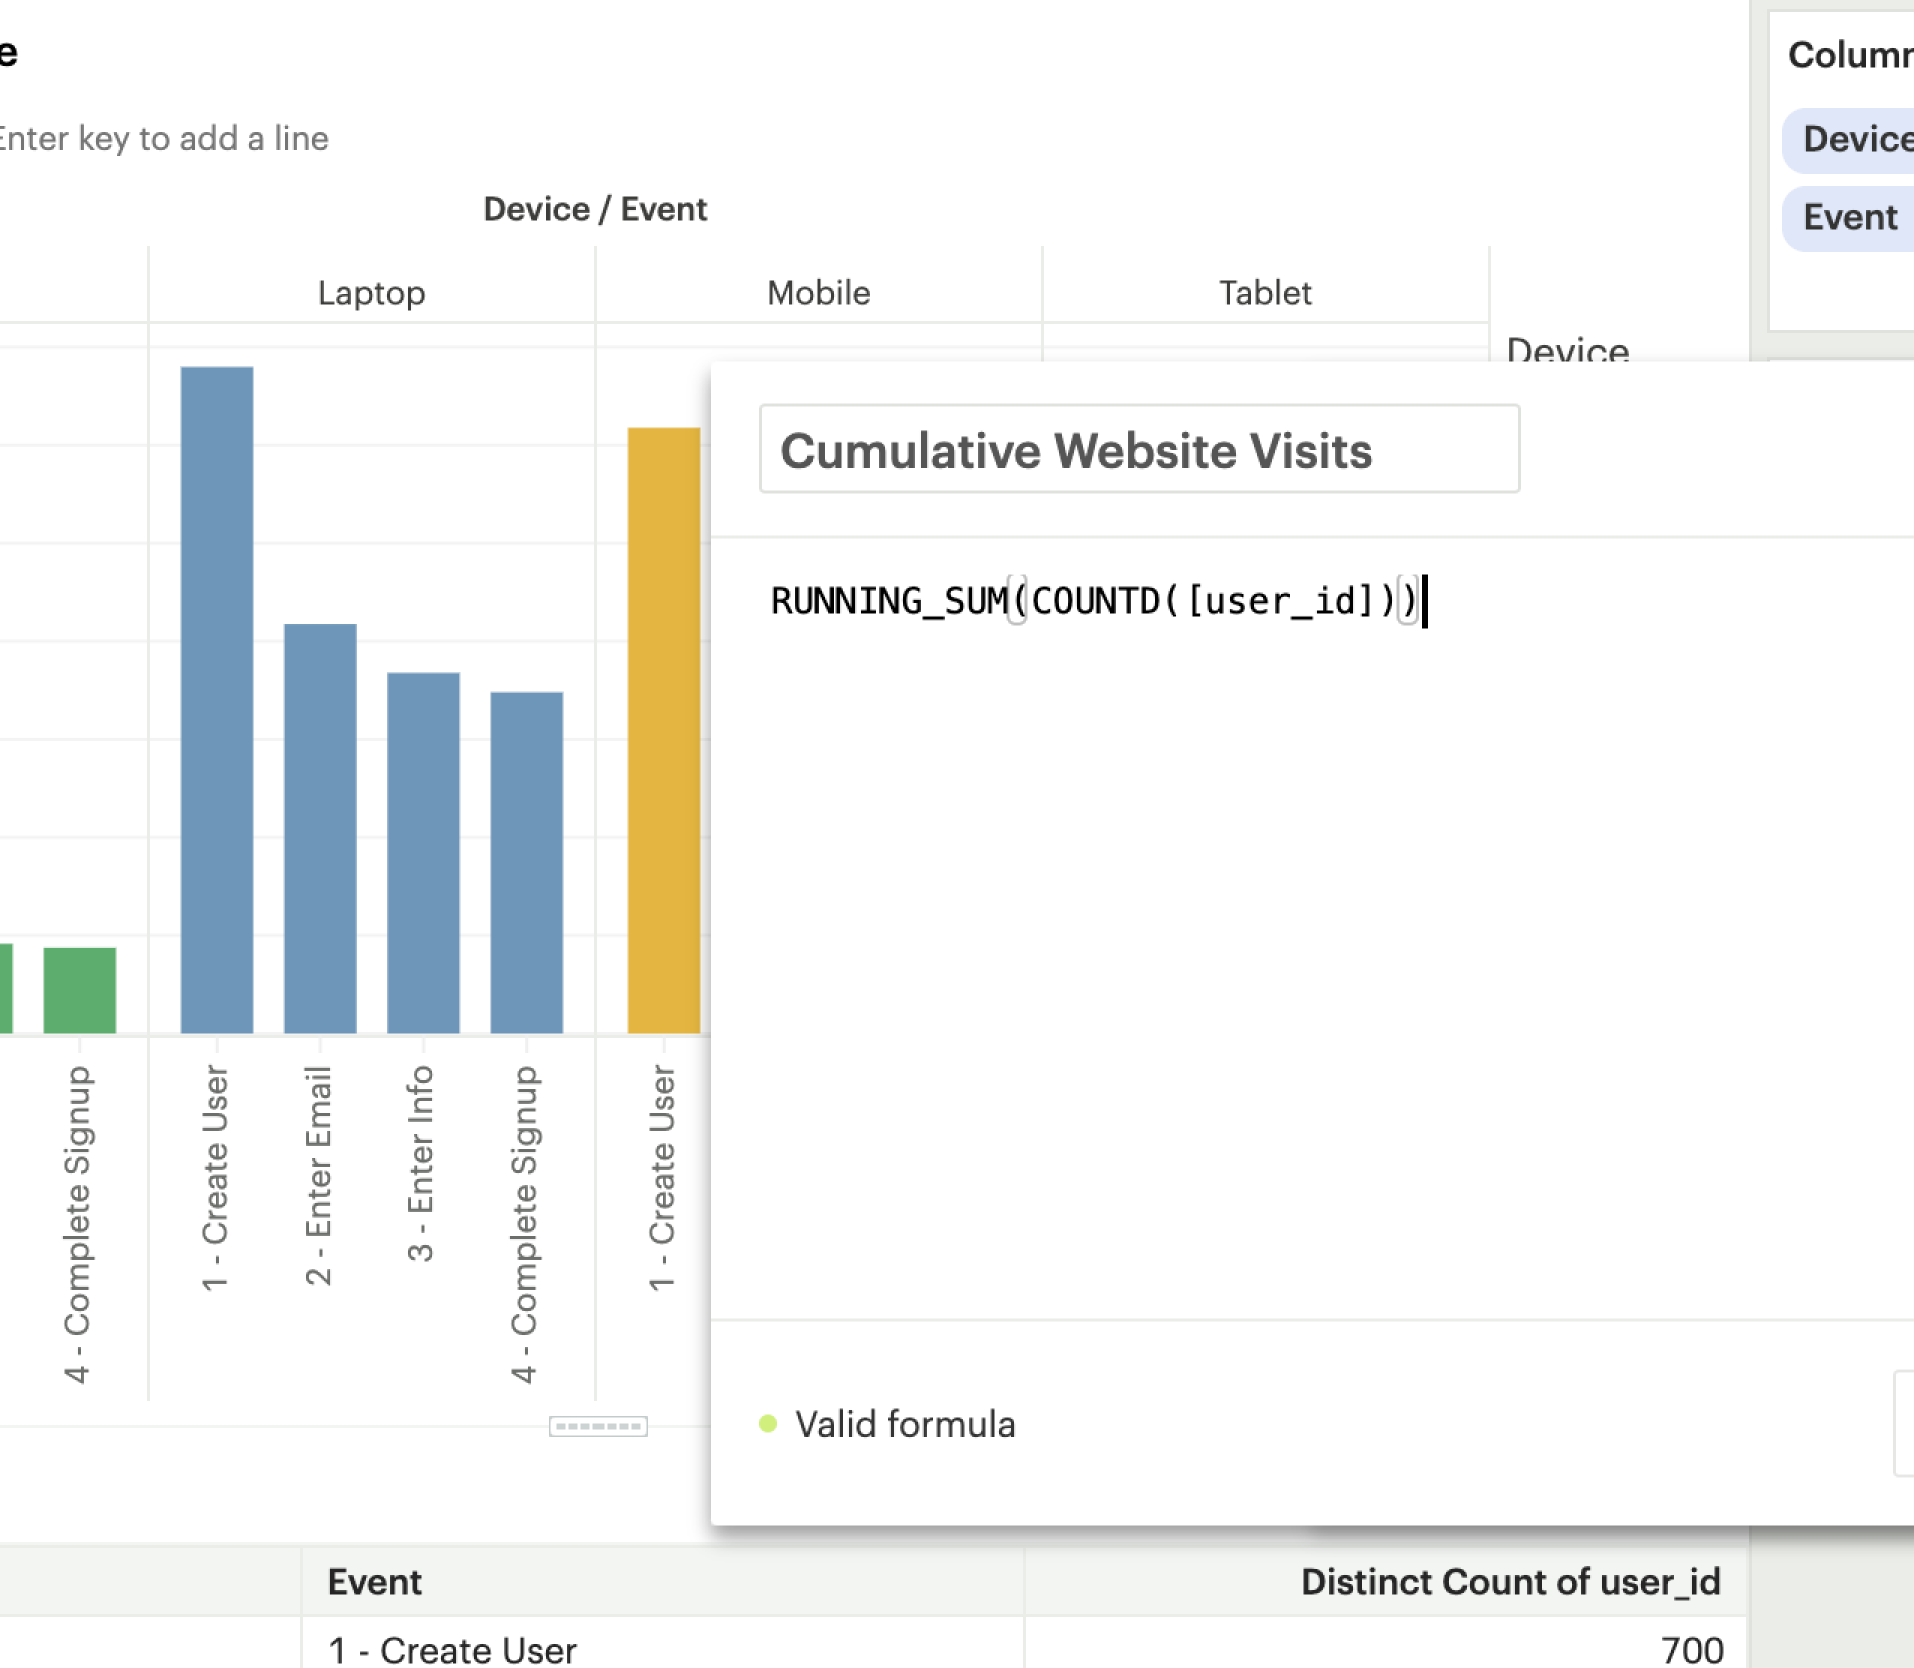
Build hundreds of visualizations
Get ahead of your colleagues’ questions with visualizations that help you answer before they ask.
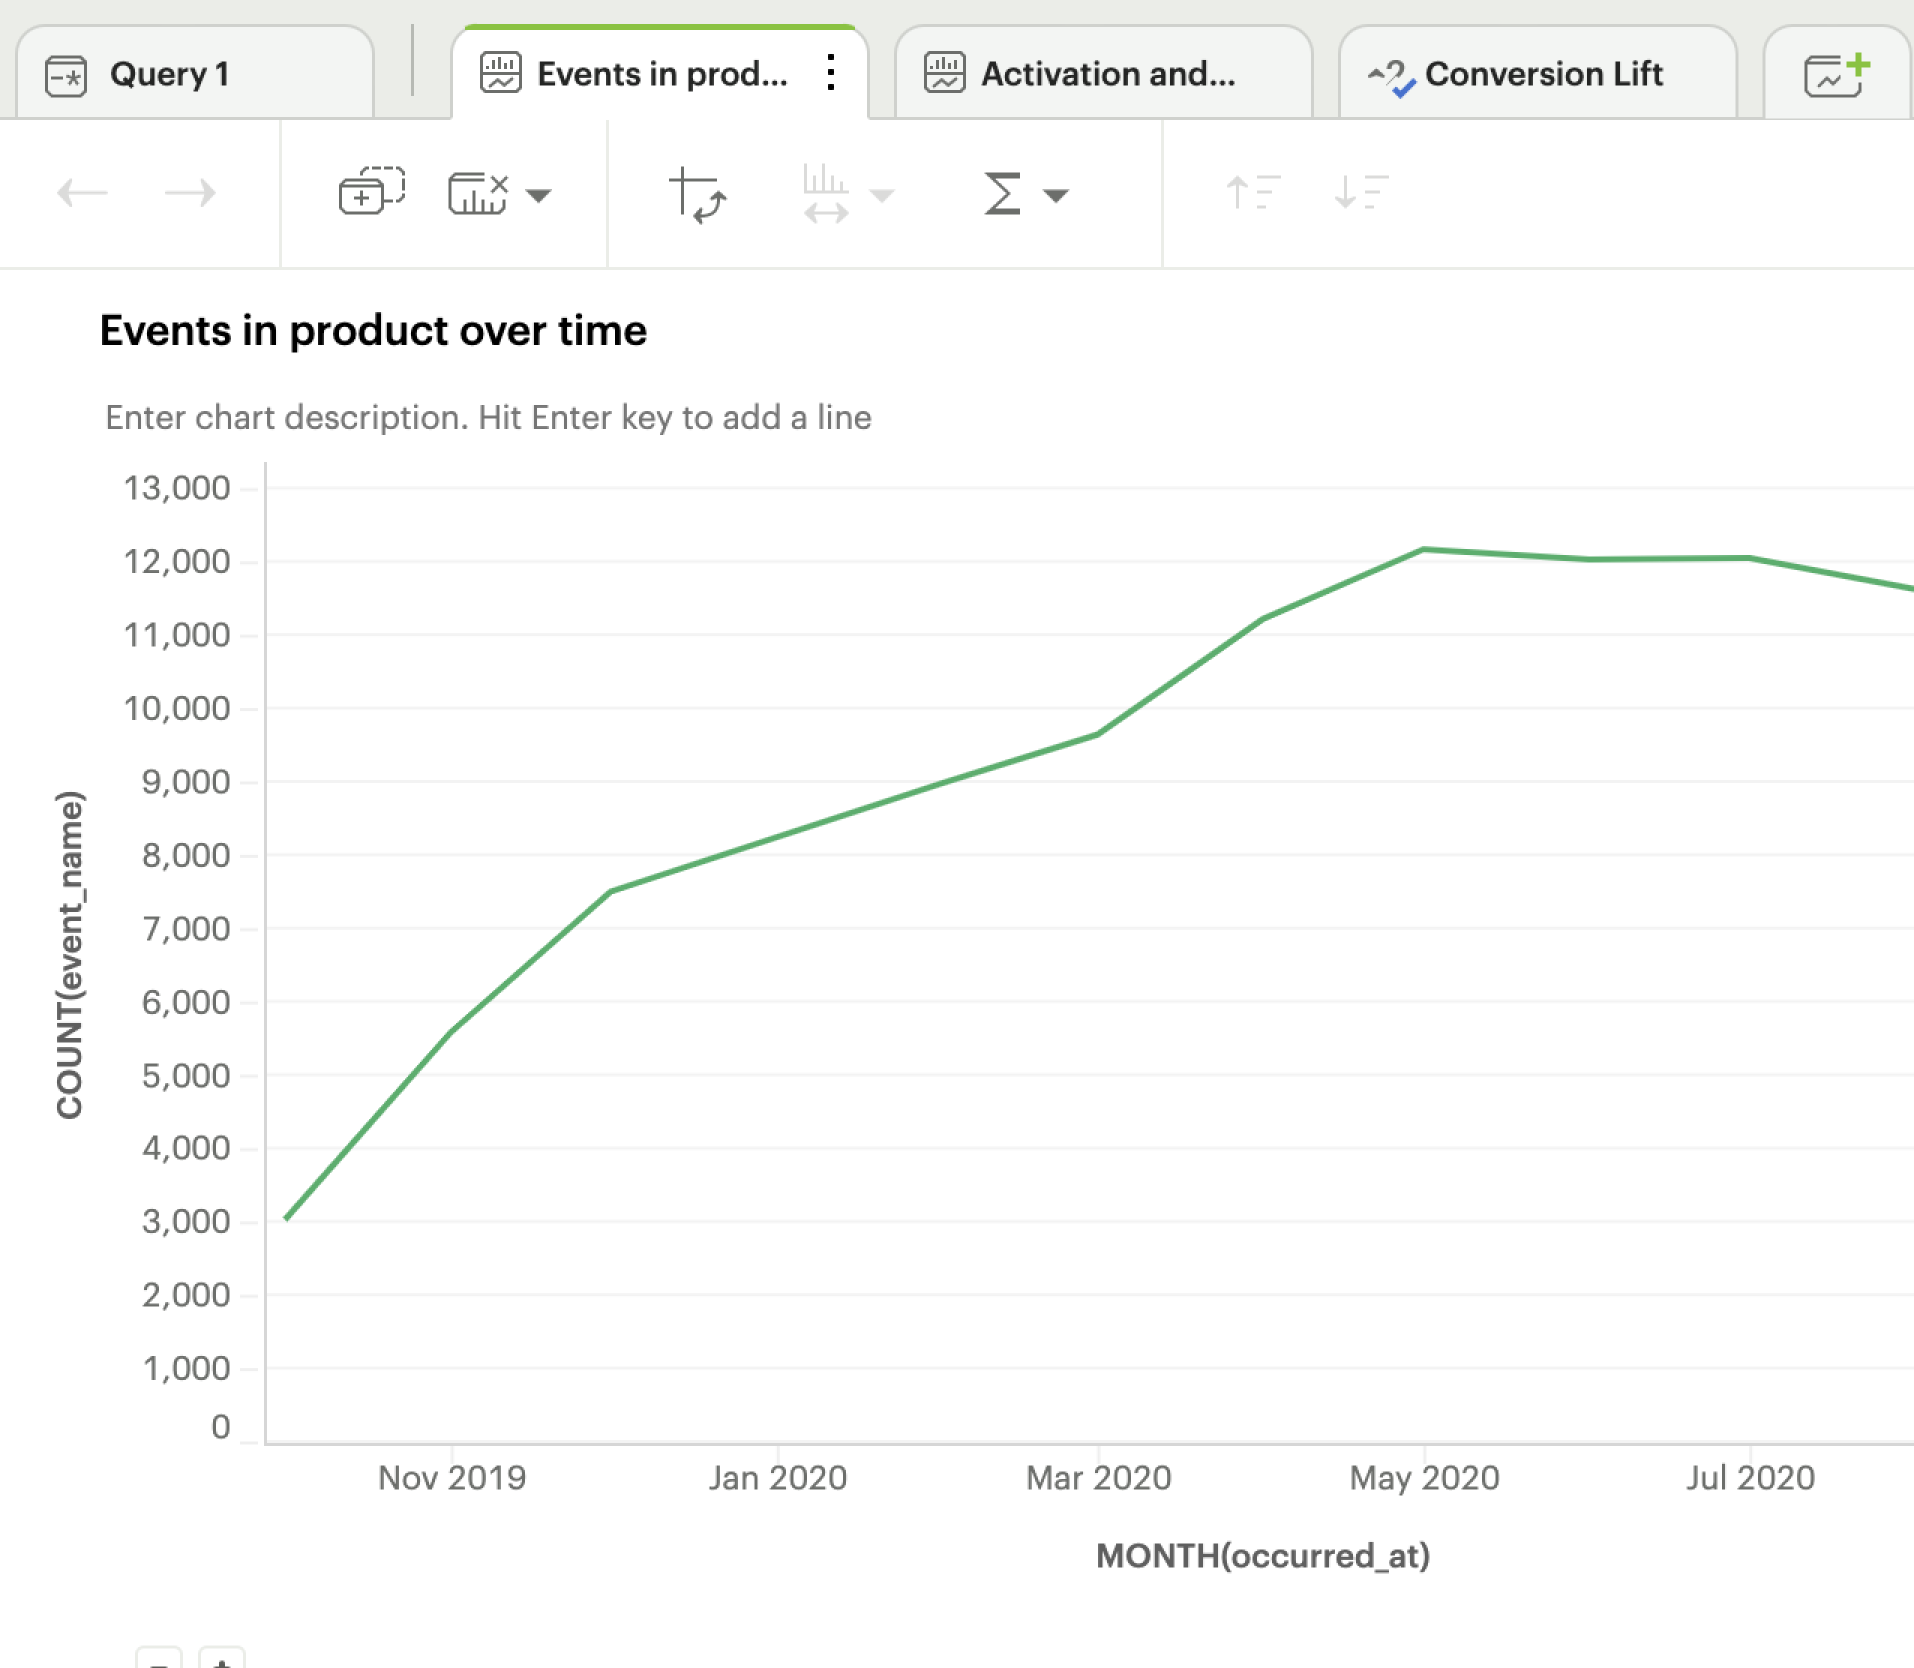
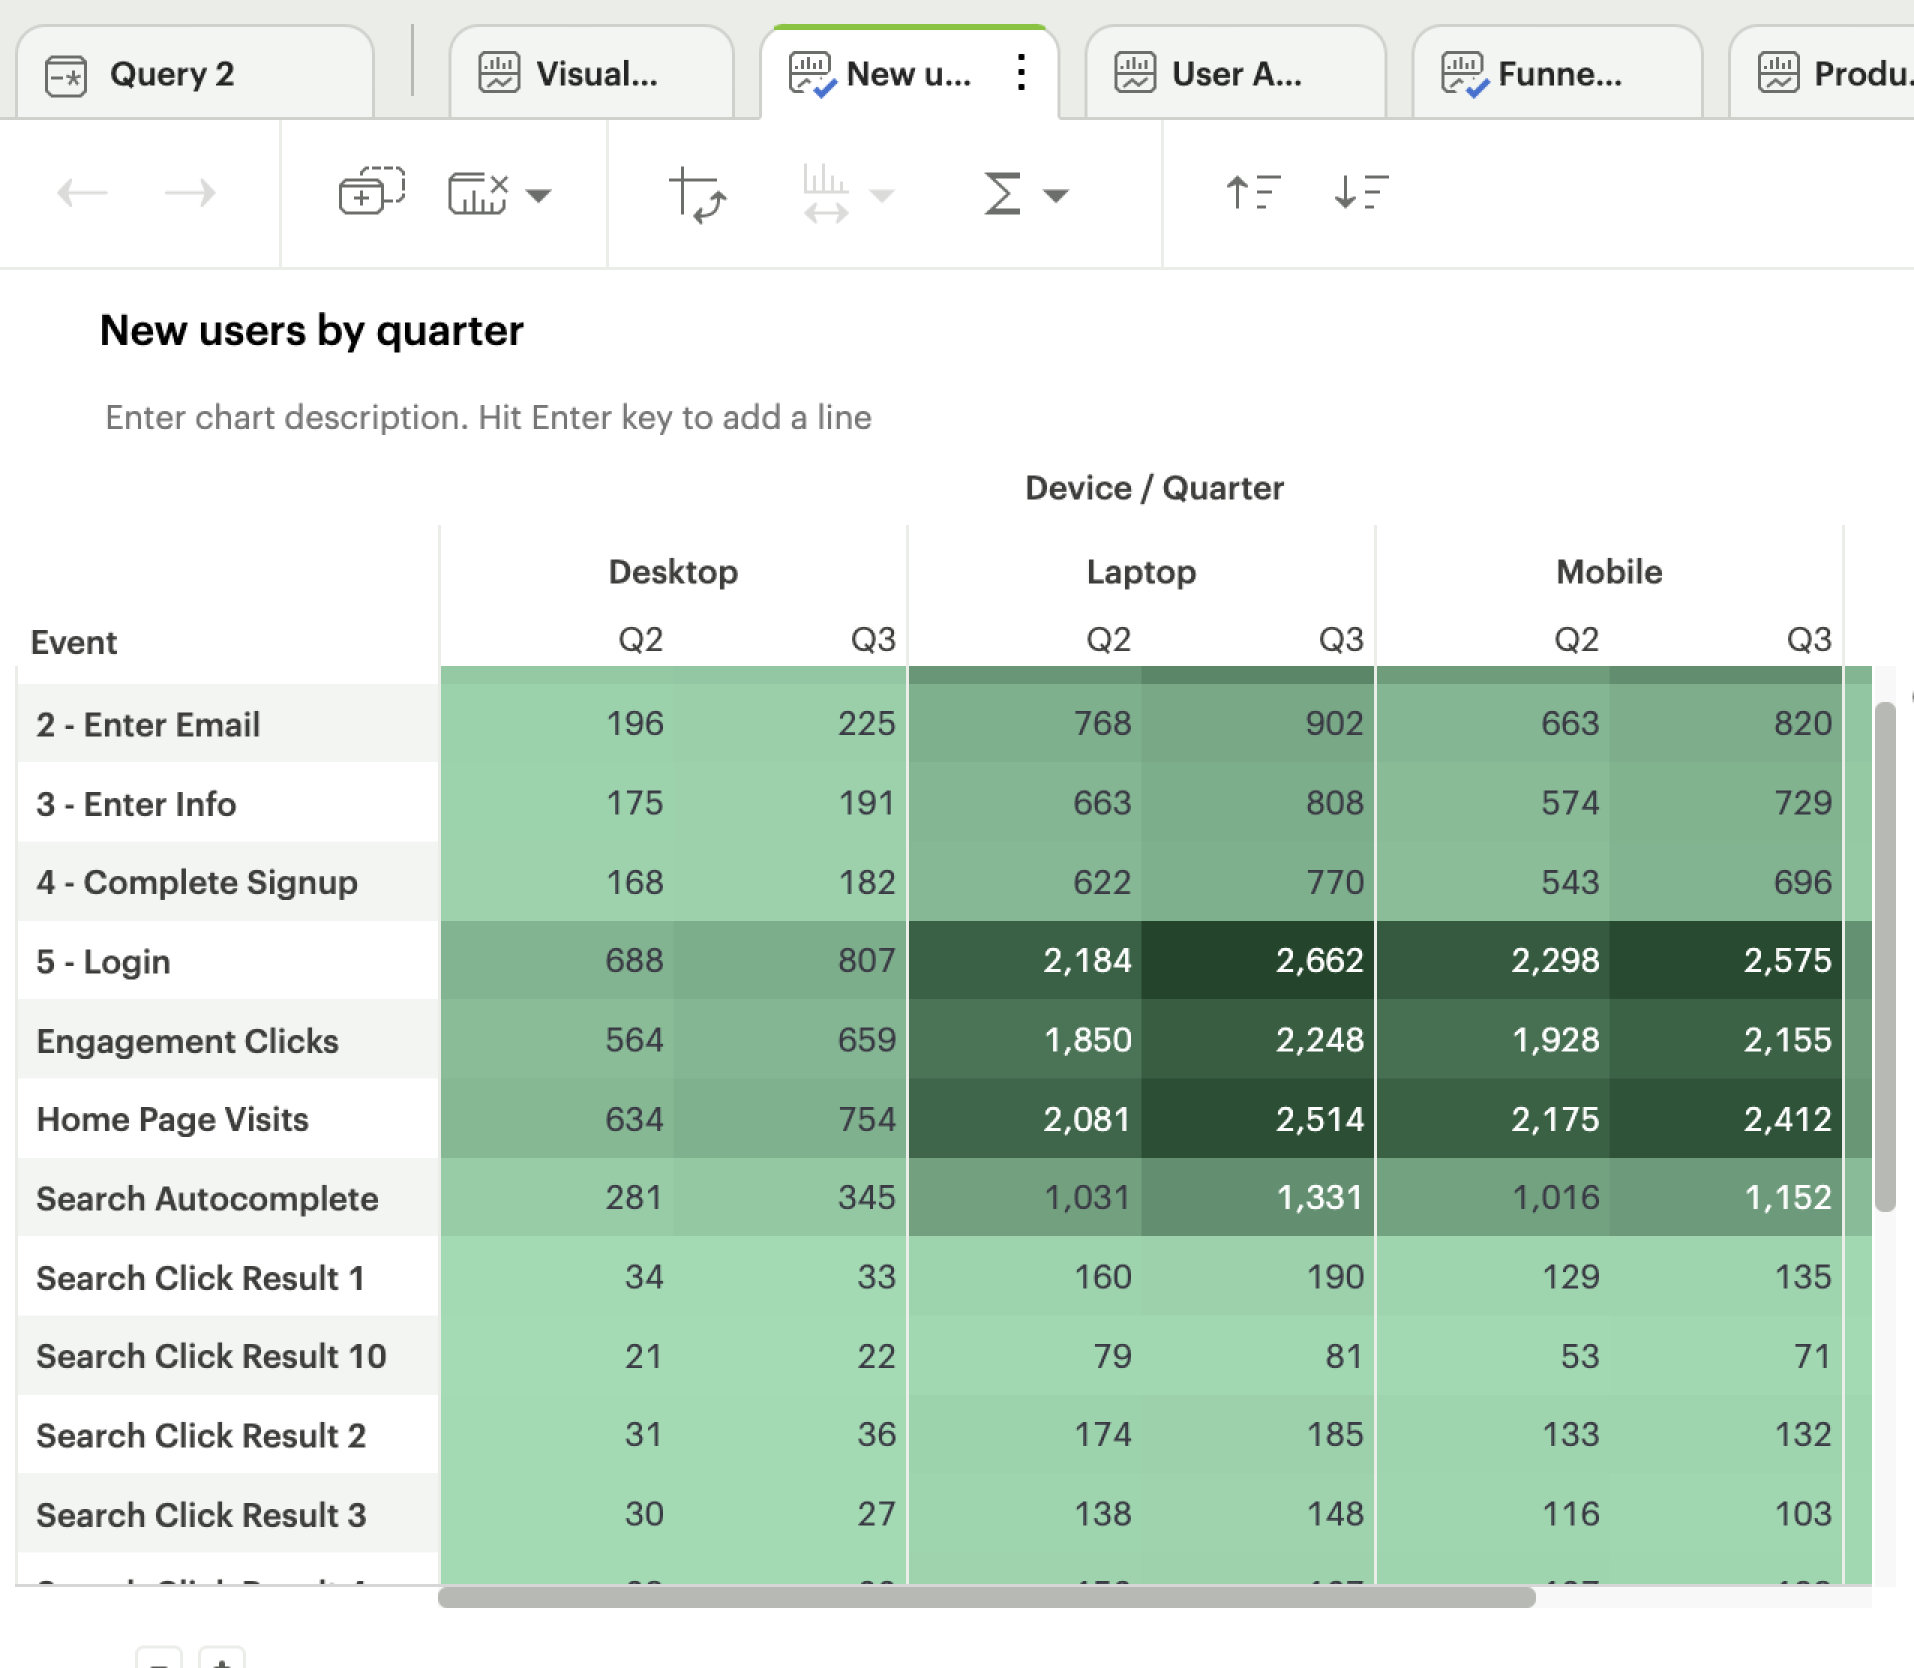
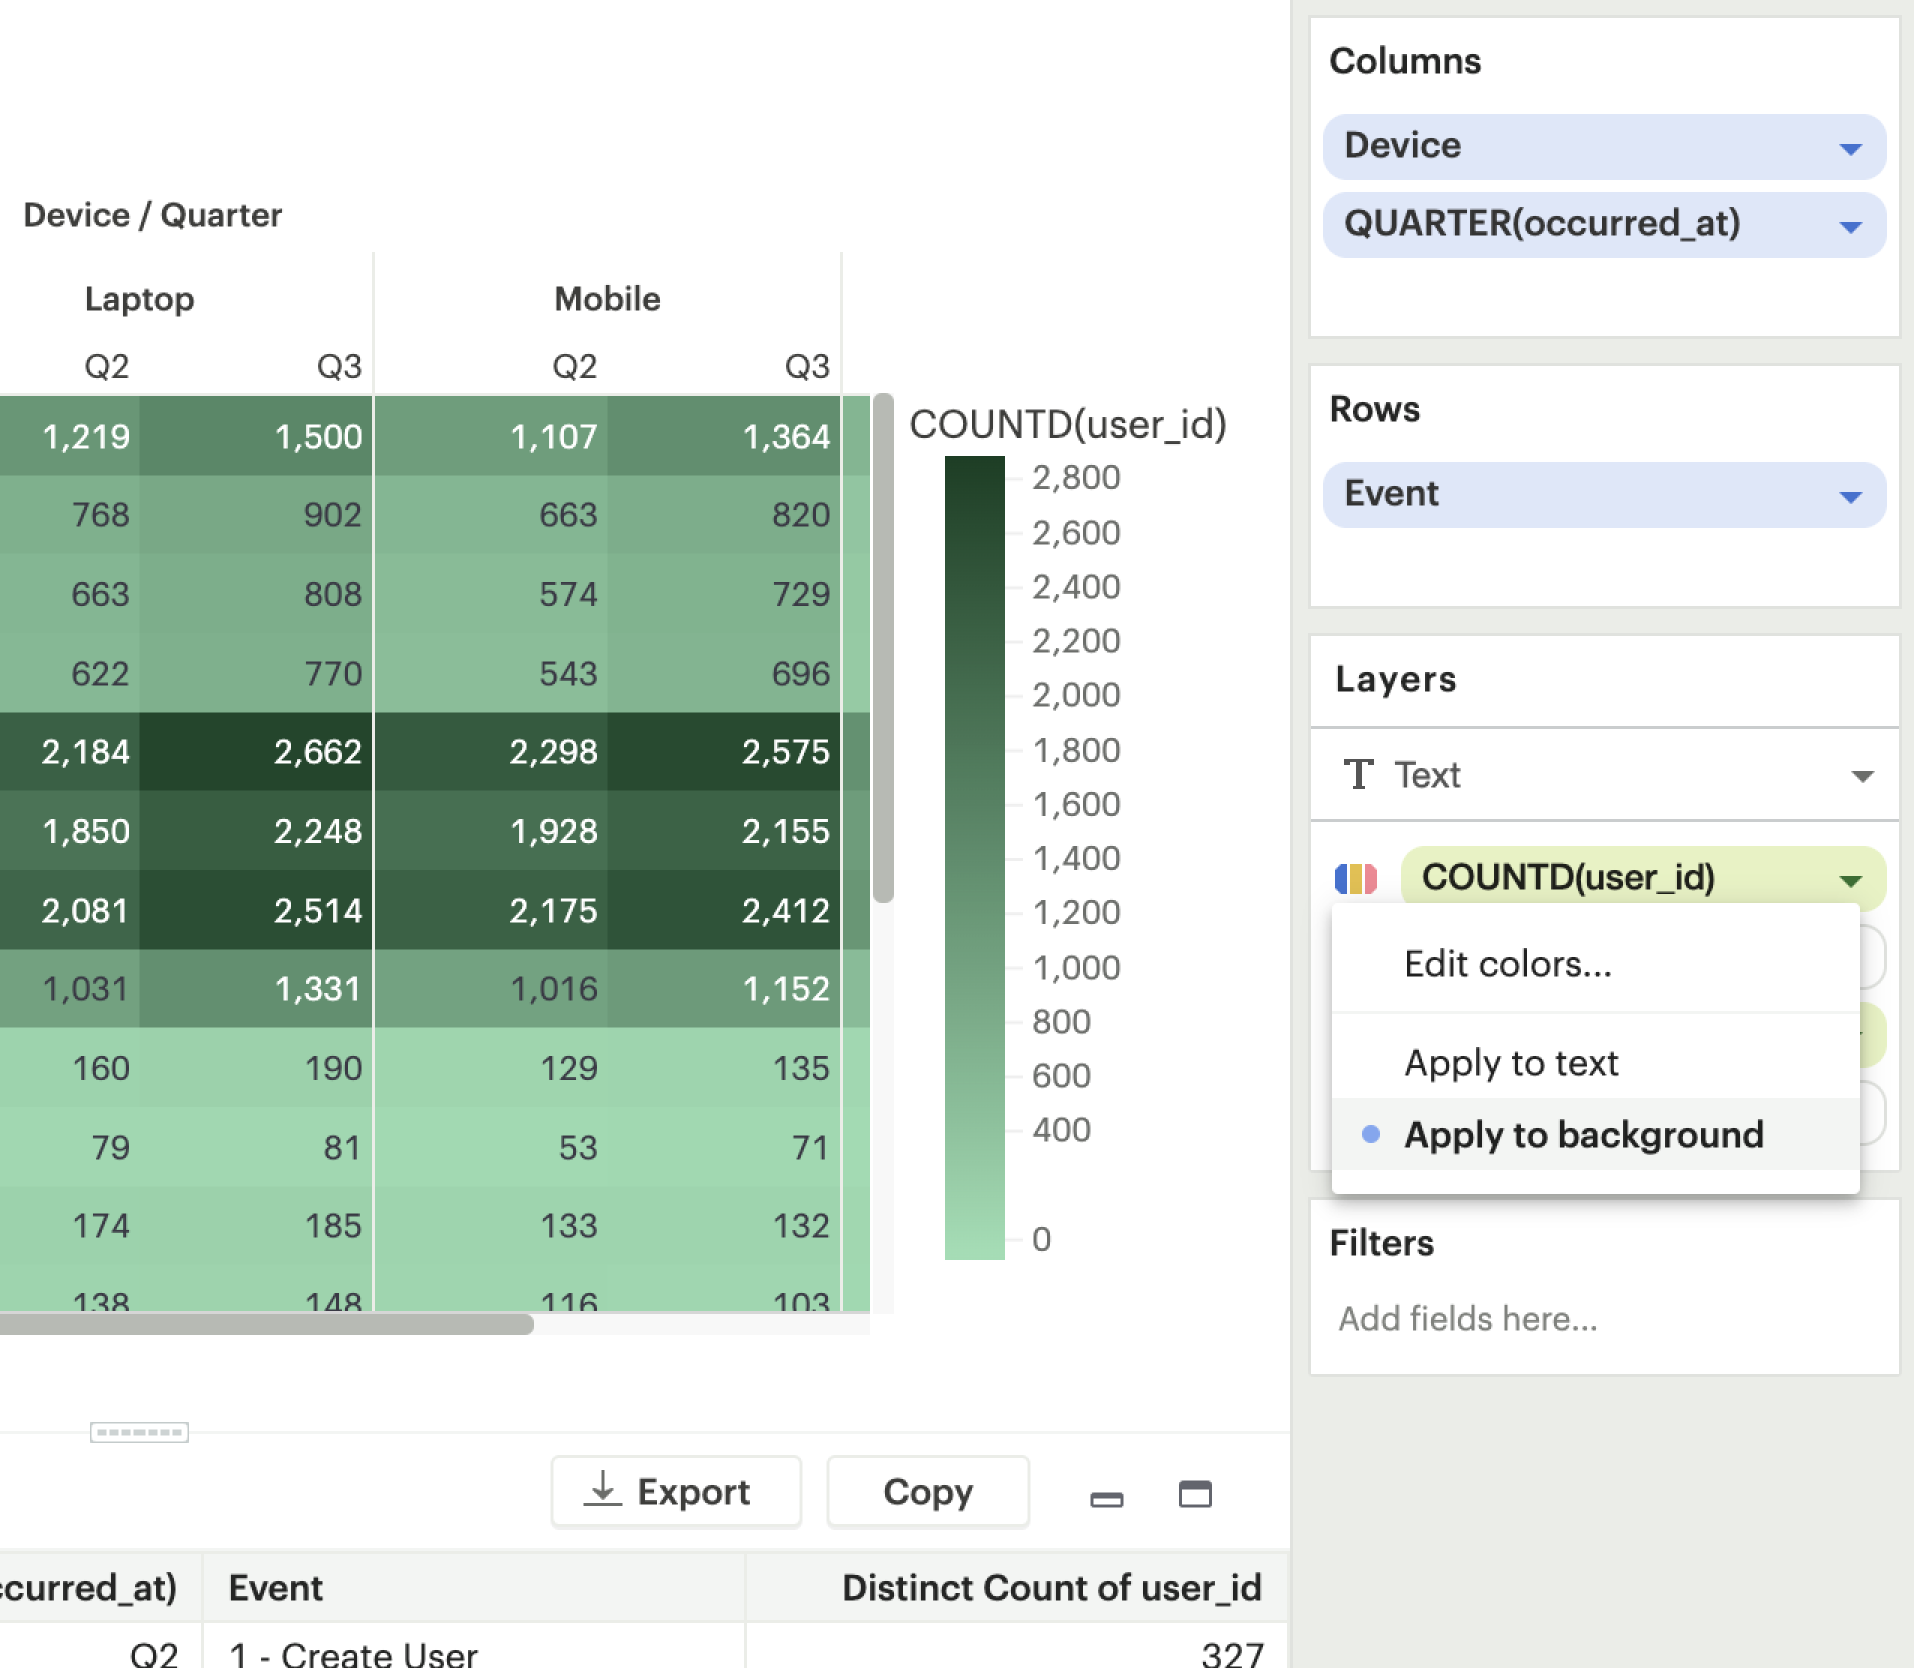
The approach to data viz you know and love
Quickly spin up bar charts, line graphs, and tables to share your insights.
Self-serve reporting starts here
Create approachable and engaging starting points for data exploration, storytelling, and decision making – for everyone in your organization.


Get more from your data
Your team can be up and running in 30 minutes or less.