
Mode Help
Visualize and present data
Report layout and presentation
Name and description
After a report has been successfully run at least once, you can change its name and description:
- From the report editor, click Report in the header and then click Rename.
- Enter a name and, optionally, a description.
- Click Save.
You can remove the report's name and/or description from the report layout using the HTML editor.
{{ title }} and {{ description }} template code. These templates will render to the report's name and description values when the report is viewed.Report themes
Your Workspace includes a number of built-in themes which you may be able to compliment with custom themes. Themes can be applied to a report in report settings. In addition, you may style any report by including custom CSS using the HTML editor.
Add a new custom theme
- Navigate to the Mode home page, click on your name in the upper left corner of the screen and click Workspace Settings from the dropdown menu.
- Under Features, select Colors & Themes.
- Click on the Report Themes tab.
- Click on the New Theme button.
- Enter a name for your theme. In the CSS box, paste or write the CSS for this theme. To import a hosted CSS file, you can use an
@importstatement (e.g.,@import url("https://example.com/stylesheet.css")). - When you are finished, click Save.
Any valid CSS can be included in a custom theme. While you cannot include any JavaScript in a custom theme, you can embed JavaScript in reports directly using the HTML Editor.
Manage custom themes
Any member can use or create a custom theme, however a custom theme can only be edited or deleted by it's creator or and Workspace admin. You cannot delete any of the built-in color themes. To manage:
- Navigate to the Mode home page, click on your name in the upper left corner of the screen and click Workspace Settings from the dropdown menu.
- Under Features, select Colors & Themes.
- Click on the Report Themes tab.
- To modify a custom theme, locate it in the list and click on it. Make any changes and click Save.
- Click on the three vertical dots next to a theme for additional options:
- Set as default: Admins only. Set this theme as the default for all new reports. Does not impact any existing reports.
- Delete: Deletes the theme.
Color palettes
Your Workspace includes a number of pre-defined color palettes which you may be able to compliment with additional custom color palettes.
Add a custom color palette
- Navigate to the Mode home page, click on your name in the upper left corner of the screen and click Workspace Settings from the dropdown menu.
- Under Features, select Colors & Themes.
- Click the New Color Palette button.
- Enter a unique name and select categorical, sequential or divergent palette type:
- Categorical: Input between 2 and 20 different color hex codes. After writing or pasting in a value (e.g. #37B067), press enter to confirm. Use the X button to remove the value.
- Sequential: Input a color hex codes for the start and end of the color gradient.
- Divergent: Input a color hex codes for the start, middle and end of the color gradient.
- Click Save.
Manage custom color palettes
Any member can use or create a custom color palette, however a custom color palette can only be edited or deleted by it's creator or and Workspace admin. You cannot delete any of the built-in color palettes. To manage:
- Navigate to the Mode home page, click on your name in the upper left corner of the screen and click Workspace Settings from the dropdown menu.
- Under Features, select Colors & Themes.
- To modify a custom color palette, locate it in the list and click on it. Make any changes and click Save.
- Click on the three vertical dots next to a color palette for additional options:
- Set as default: Admins only. Set this palette as the default for all new reports. Does not impact any existing reports.
- Delete: Deletes the palette.
Report details
Open a report and click View Details in the header to see additional details about the report, including the logic and data behind it. Along the left side you may see some or all of the following sections, depending on your level of access to the report:
- Details: Includes the names of any collaborators (users who have modified the report) and the report's run history.
- HTML: The HTML code that defines the report layout as well as any embedded custom HTML, JavaScript or CSS.
- Notebook: Any input, output, and markup cells (including Python or R code) if defined in the report's Notebook.
- SQL and Results: The SQL code and results for each query in the report.
Run history
Every time you run a report, Mode saves a copy of its configuration and results (excluding Notebook code, HTML, Chart configuration, and Calculated Field formulas) so you can see exactly how a report looked from a given point in time. A historical run is saved even if the queries in the report do not complete successfully. Historical report runs are accessible indefinitely unless the report is deleted.
You can access a report's run history from report details. Click on one of the historical report runs in the list to view the report as it appeared at that time. Each historical run has a unique static report run URL so that specific run can be shared with others.
Report builder
The report builder is a drag-and-drop interface for laying out and adding context to the components of your report. When editing a report, access the report builder by clicking on Report Builder on the left side of the window.
Common keyboard shortcuts are available while editing. You can re-arrange or re-size your text elements the same way you would any other report element. To remove a text box, click on it and then click Remove in the toolbar.
To move a component, click and drag it to move it around the layout. To resize a component, click on it and the drag the grab icons on either side to change its width, or click Set Height to adjust its height. You may choose between small, medium (the default size), and large. For display tables, you may also set the height to full to show up to 1000 records.
Text boxes
In the report builder, you can add text boxes (including text, links, images and more) to provide more context for your report:
- In the report builder, click Add Text.
- Add any text or links. You can also embed an image.
- When you are finished editing, click anywhere outside the text box to save.
HTML editor
To modify the HTML of a report, click Edit HTML at the top of the report builder. After modifying code in the HTML editor, click Update to preview your changes. Any valid HTML can be added to a report using the HTML editor, including JavaScript inside <script> tags and CSS inside <style> tags.
The report's HTML will automatically adjust as you rearrange and resize any of the elements using the drag-and-drop interface. However, for more fine-grained control over report layout and styling, or to add advanced visualizations using JavaScript, you must use the HTML editor.
This report shows how you can combine various built-in and custom visualizations. Use the Details tab to view the HTML code and see how it works.
Layout grid
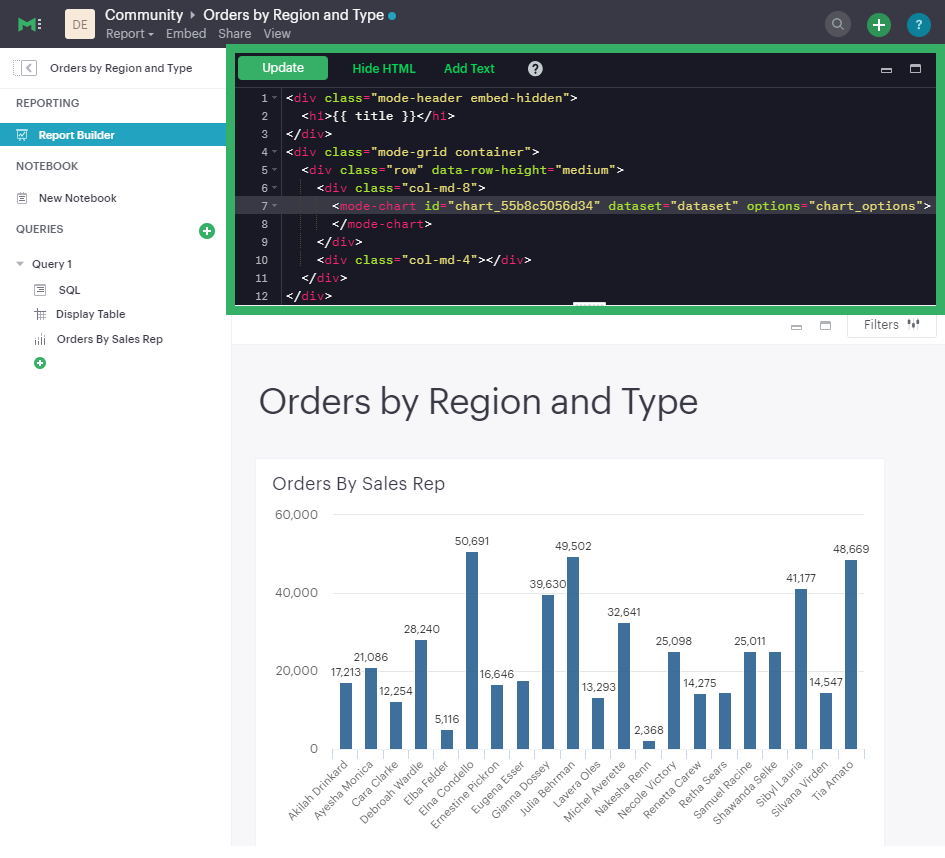
Built-in charts (including tables), text boxes and Notebook visualizations are automatically arranged along a 12-column grid inside a div of class mode-grid container. The structure of the HTML is shown below:
<div class="mode-grid container">     <!-- The container div for the report grid layout.        -->

  <div class="row">                   <!-- There is a div with class "row" for each row.        -->

    <div class="col-md-7">            <!-- Each chart is inside a div with class "col-md-X".    -->
      <mode-chart ... ></mode-chart>  <!-- X equals the the number of columns wide (of 12) the  -->
    </div>                            <!-- chart should be. This chart is 7 of 12 columns wide. -->

    <div class="col-md-5">            <!-- The second chart is 5 columns wide, occupying the    -->
      <mode-chart ... ></mode-chart>  <!-- remaining space in same row as the first chart.       -->
    </div>

  </div>

  <div class="row">                   <!-- This div starts a new row of report components.      -->

    <div class="col-md-12">           <!-- Since this div has the class "col-md-12", the        -->
      <mode-chart ... ></mode-chart>  <!-- component nested within it (a chart) will fill        -->
    </div>                            <!-- the entire row.                                      -->

  </div>

</div>
The HTML for the layout grid will update automatically as you modify elements in the drag-and-drop interface of the report builder. However, please note:
- Deleting a reference to a chart or table from the report's HTML will remove it from the layout, but will not delete the underlying chart or table from the report editor.
- You can add custom HTML elements (e.g., paragraphs, images, links, etc.) within or outside the grid generated for you by Mode. Note that adding custom HTML elements within the grid generated for you by Mode (i.e., inside the
divtags with classmode-grid container) will result in unexpected behavior and as such is not recommended at this time. - We recommend positioning and sizing built-in visualizations with the drag-and-drop interface before modifying the HTML directly, because custom HTML content cannot be modified using the drag-and-drop interface.
The report's name and description are automatically added to all reports inside a <div> with the class mode-header. Either can be removed from the layout by deleting them using the HTML editor. When a report is embedded, the contents of this <div> (including the name and description), will not be rendered in the embed output unless the embed-hidden class is removed.
External assets
You may include external assets (e.g., JavaScript libraries, stylesheets, images, JSON files, etc.) in your report by referencing them via URL with the appropriate tags in the report's HTML. Note:
- Any external assets must be hosted on the internet (Mode does not host custom assets) and loaded securely using HTTPS, not HTTP.
- D3 (v3.5.17) and JQuery (v2.2.4), two JavaScript libraries commonly used for data visualization, are pre-loaded into all Mode reports. You do not need to add
<script>tags to your report to use these libraries.
For example, consider the following Population Map report, specifically the HTML code:
- JavaScript libraries TopoJSON and Underscore.js are included at the beginning of the
<body>tag. - A hosted JSON file required to draw the U.S. map is loaded on line 257.
Loading state customization
In the HTML editor or in a custom theme you can target a number of CSS classes to customize elements of a report's presentation while data is being loaded and visualizations are being rendered:
.editor-chart.chart-header: The title of the fully rendered visualization (charts and notebook output)..mode-placeholder.placeholder-title: The title of the chart placeholder..mode-placeholder.loading-message: The message appearing in a chart placeholder. Default: “Fetching your data...” with an animated ellipses..mode-python.loading-message: The message appearing in the notebook placeholder. Default: “Fetching your notebook data...” with an animated ellipses..ph-color-light: The first of three colors included in the placeholder image that appears in the center of the loading state..ph-color-medium: The second of three colors included in the placeholder image that appears in the center of the loading state..ph-color-dark: The third color included in the placeholder image that appears in the center of the loading state. Note: Only some of the SVGs feature three colors.
Access query results with JavaScript
Results from any query in your report can be accessed using JavaScript in the HTML editor via the datasets array available in any JavaScript scope. The content property of any dataset within datasets contains the query results.
If the query result exceeds our legacy limit, the content property of the dataset associated with this query will be empty. Note that users will still be able to view and create Mode charts and tables in these instances.
The datasets array contains the following information for each query in the report:
| Key | Type | Description |
|---|---|---|
| id | string | 12 character GUID for the query (equal to query_token) |
| isLoaded | boolean | Is always true |
| content[] | JSON | The query result set; one JSON object per row |
| columns[] | JSON | Metadata about the columns available in the query result set |
| columns[].type | string | Data type of the column at the given position in columns[] |
| columns[].name | string | Name of the column at the given position in columns[] |
| count | integer | The number of rows in the query result set |
| state | string | succeeded if the query successfully ran; failed otherwise |
| queryName | string | The given name of the query in Mode |
| reportDataUrl | string | URL for viewing the query result set in Mode |
| reportQueryUrl | string | URL for viewing the query SQL code in Mode |
| query_token | string | 12 character GUID for the query (equal to id) |
| oversized | boolean | Is true if the query's results are too large to access in the browser. If true, content[] will be empty. |
| csv | string | URL for downloading the query result set as a CSV file |
Queries are added to datasets[] in the order that they were added to the report, regardless of the order that they appear in Mode.
Example
For example, suppose the first query (named "2006 Oscar Nominees") in a report returned the following data:
| nominee | category | movie |
|---|---|---|
| Alan Arkin | actor in a supporting role | Little Miss Sunshine |
| Forest Whitaker | actor in a leading role | The Last King of Scotland |
| Helen Mirren | actress in a leading role | The Queen |
| Jennifer Hudson | actress in a supporting role | Dreamgirls |
Accessing datasets[0] would return the following JSON object containing all of the query's results and metadata (use ⊕ and ⊖ to explore):
{{< renderjson "/other/datasets-demo.json.svg" />
You can see a live example of this dataset, and learn more about accessing and using the datasets[] JSON object, in this example report.
Accessing data by query name
Use the JavaScript filter() method to search datasets[] and return the result set for that query. This example declares a new variable (data) and sets it equal to the results of a query called "My Query":
var data = datasets.filter(function(d) { return d.queryName == "My Query"; })[0].content;
Report Virtualization
Virtualization, or virtual scrolling allows the display of a large number of visualizations in a Report by prioritizing displaying only content that is currently visible to the user. Subsequently, when content is no longer in view it can be “detached” or temporarily hidden, which helps maintain consistent performance regardless of the number of visualizations in the Report.
Virtualization allows us to render Reports with large number of interactive visualizations without causing a significant delay to the display of charts that are immediately visible to the user. Our virtualized rendering logic will only apply Quick Charts and Visual Explorer charts.
Customization of chart sizes, arrangements, and layouts via CSS, custom JQuery plugins, etc might result in the virtualization behavior not working correctly. The following line can be added to the top of the HTML layout <!-- no-virtual-scroll --> to turn off virtualization if needed.
Additional options
Settings
To access additional report settings from the report editor view, click Report in the header and select Settings:
- Report Theme: Applies the selected theme to the report's styling.
- Full width: Disabled by default. When enabled, report elements will expand to fill the available viewing window.
- Disable the refresh button from the report view: Prevents report viewers from being able to refresh the report, including running the report's queries. When the button is disabled, reports will run on their scheduled times, and logged-in users with edit access can trigger report runs from the editor view.
- Enable drill anywhere in Report View: Allow viewers to drill into Visual Explorer and pivot table charts by any field in the underlying data set.

Fullscreen mode
Fullscreen mode maximizes the content of your report so it occupies the entire screen, eliminating all other parts of the Mode interface and browser window. A report in fullscreen mode will automatically refresh and display the latest data whenever the report is successfully run unless you access it using a static run link. To enable fullscreen mode:
- In the report header, click Fullscreen (this option may be in the More menu).
- Your report will expand to fill the screen. Only the margins of the report will expand. The report elements themselves will not. To include more elements in your dashboard, enable full width mode in report settings.
- To exit fullscreen mode, press the Escape key.
URL query string
You may add one or more field-value pairs to a Mode report's URL query string to control that report's behavior. You may combine multiple field-value pairs in a report's URL query string, separated by &.
run
Forces the report to re-run and refreshes all query results, Notebook output, and visualizations.
- If present in the query string, must be equal to the value
now. - Whenever a report URL is accessed that includes
run=nowin the query string, the report will re-run. Ifrun=nowis not included in the query string, Mode will return data from the most recent time the report was run. - If the URL query string includes values for parameters then the report will be run each time the URL is accessed, even if
run=nowis not included.
The following example URL will update all queries and visualizations each time it is accessed:
https://app.mode.com/benn/reports/31baa986cdfd?run=now
param_[PARAMETER_NAME]
Specifies the value that should be used for a given report parameter of [PARAMETER_NAME].
- Parameter names and values in report URLs are case sensitive.
- Remember to URL encode any special characters used in your parameter names or values.
- If no value or an invalid value is provided for a parameter in the URL query string, the value of the
defaultproperty in the parameter definition will be used. - For multiselect parameters, each distinct value must be provided as a separate field-value pair in the format
param_[PARAM_NAME][]=[PARAM_VALUE].
The following example URL will run the target report with "Midwest" and "Northeast" selected for the sales_region multiselect parameter and "2000" as the value for the order_max text parameter:
https://app.mode.com/modeanalytics/reports/a9e1fe690f93?param_sales_region[]=Midwest¶m_sales_region[]=Northeast¶m_order_max=2000
Report builder keyboard shortcuts
Text boxes
| Action | Mac | PC |
|---|---|---|
| Bold | ⌘ B | Ctrl B |
| Italic | ⌘ I | Ctrl I |
| Underline | ⌘ U | Ctrl U |
| Link | ⌘ K | Ctrl K |
| Indent | Tab | Tab |
| Outdent | Shift Tab | Shift Tab |
| Top of container | ⌘ ↑ | Ctrl ↑ |
| Bottom of container | ⌘ ↓ | Ctrl ↓ |
HTML editor
| Action | Mac | PC |
|---|---|---|
| Save / update layout | ⌘ Enter | Ctrl Enter |
| Comment line / selection | ⌘ / | Ctrl / |
| Indent | Tab | Tab |
| Outdent | Shift Tab | Shift Tab |
| Move lines down | Option ↓ | Alt ↓ |
| Move lines up | Option ↑ | Alt ↑ |
| Copy lines down | Option Shift → | Alt Shift ↓ |
| Copy lines up | Option Shift ← | Alt Shift ↑ |
FAQs
Q: Why does the custom styling on chart titles appear to be broken?
Mode made some updates to chart titles and chart descriptions that would require changes to the CSS code. Please see the example below to update your custom report theme accordingly.
/* Chart titles */
.mode-object.big-number .chart-title .in-place-edit-text,
.embed-preview .mode-object.big-number .chart-title .in-place-edit-text,
.editor-table .chart-header,
.editor-chart .chart-header,
.editor-chart .chart-header mode-in-place-input input,
.editor-table .chart-header mode-in-place-input input,
.mode-placeholder .placeholder-title {
  color: $dark-chart-title-color;
  font-size: $font-med-large;
  font-weight: $font-weight-regular;
}
Q: Why does the custom styling on pivot tables appear to be broken?
Mode made some updates to pivot tables that would require changes to the CSS code. The CSS selector muze-layer-text-cell is now two selectors:
muze-layer-text-inner-cell
muze-layer-text-outer-cell
Please update your custom report theme accordingly.
Was this article helpful?