
Self-Serve Reporting
Analytics is a team sport
Give anyone the freedom to answer their own questions and build their own reporting. With Mode, reports are powered by centralized datasets and metrics maintained by your data team – in record time.
Slice, dice, filter, explore
Code-free entry points allow every team to better understand the data most relevant to them, driving deeper analysis with your data team.
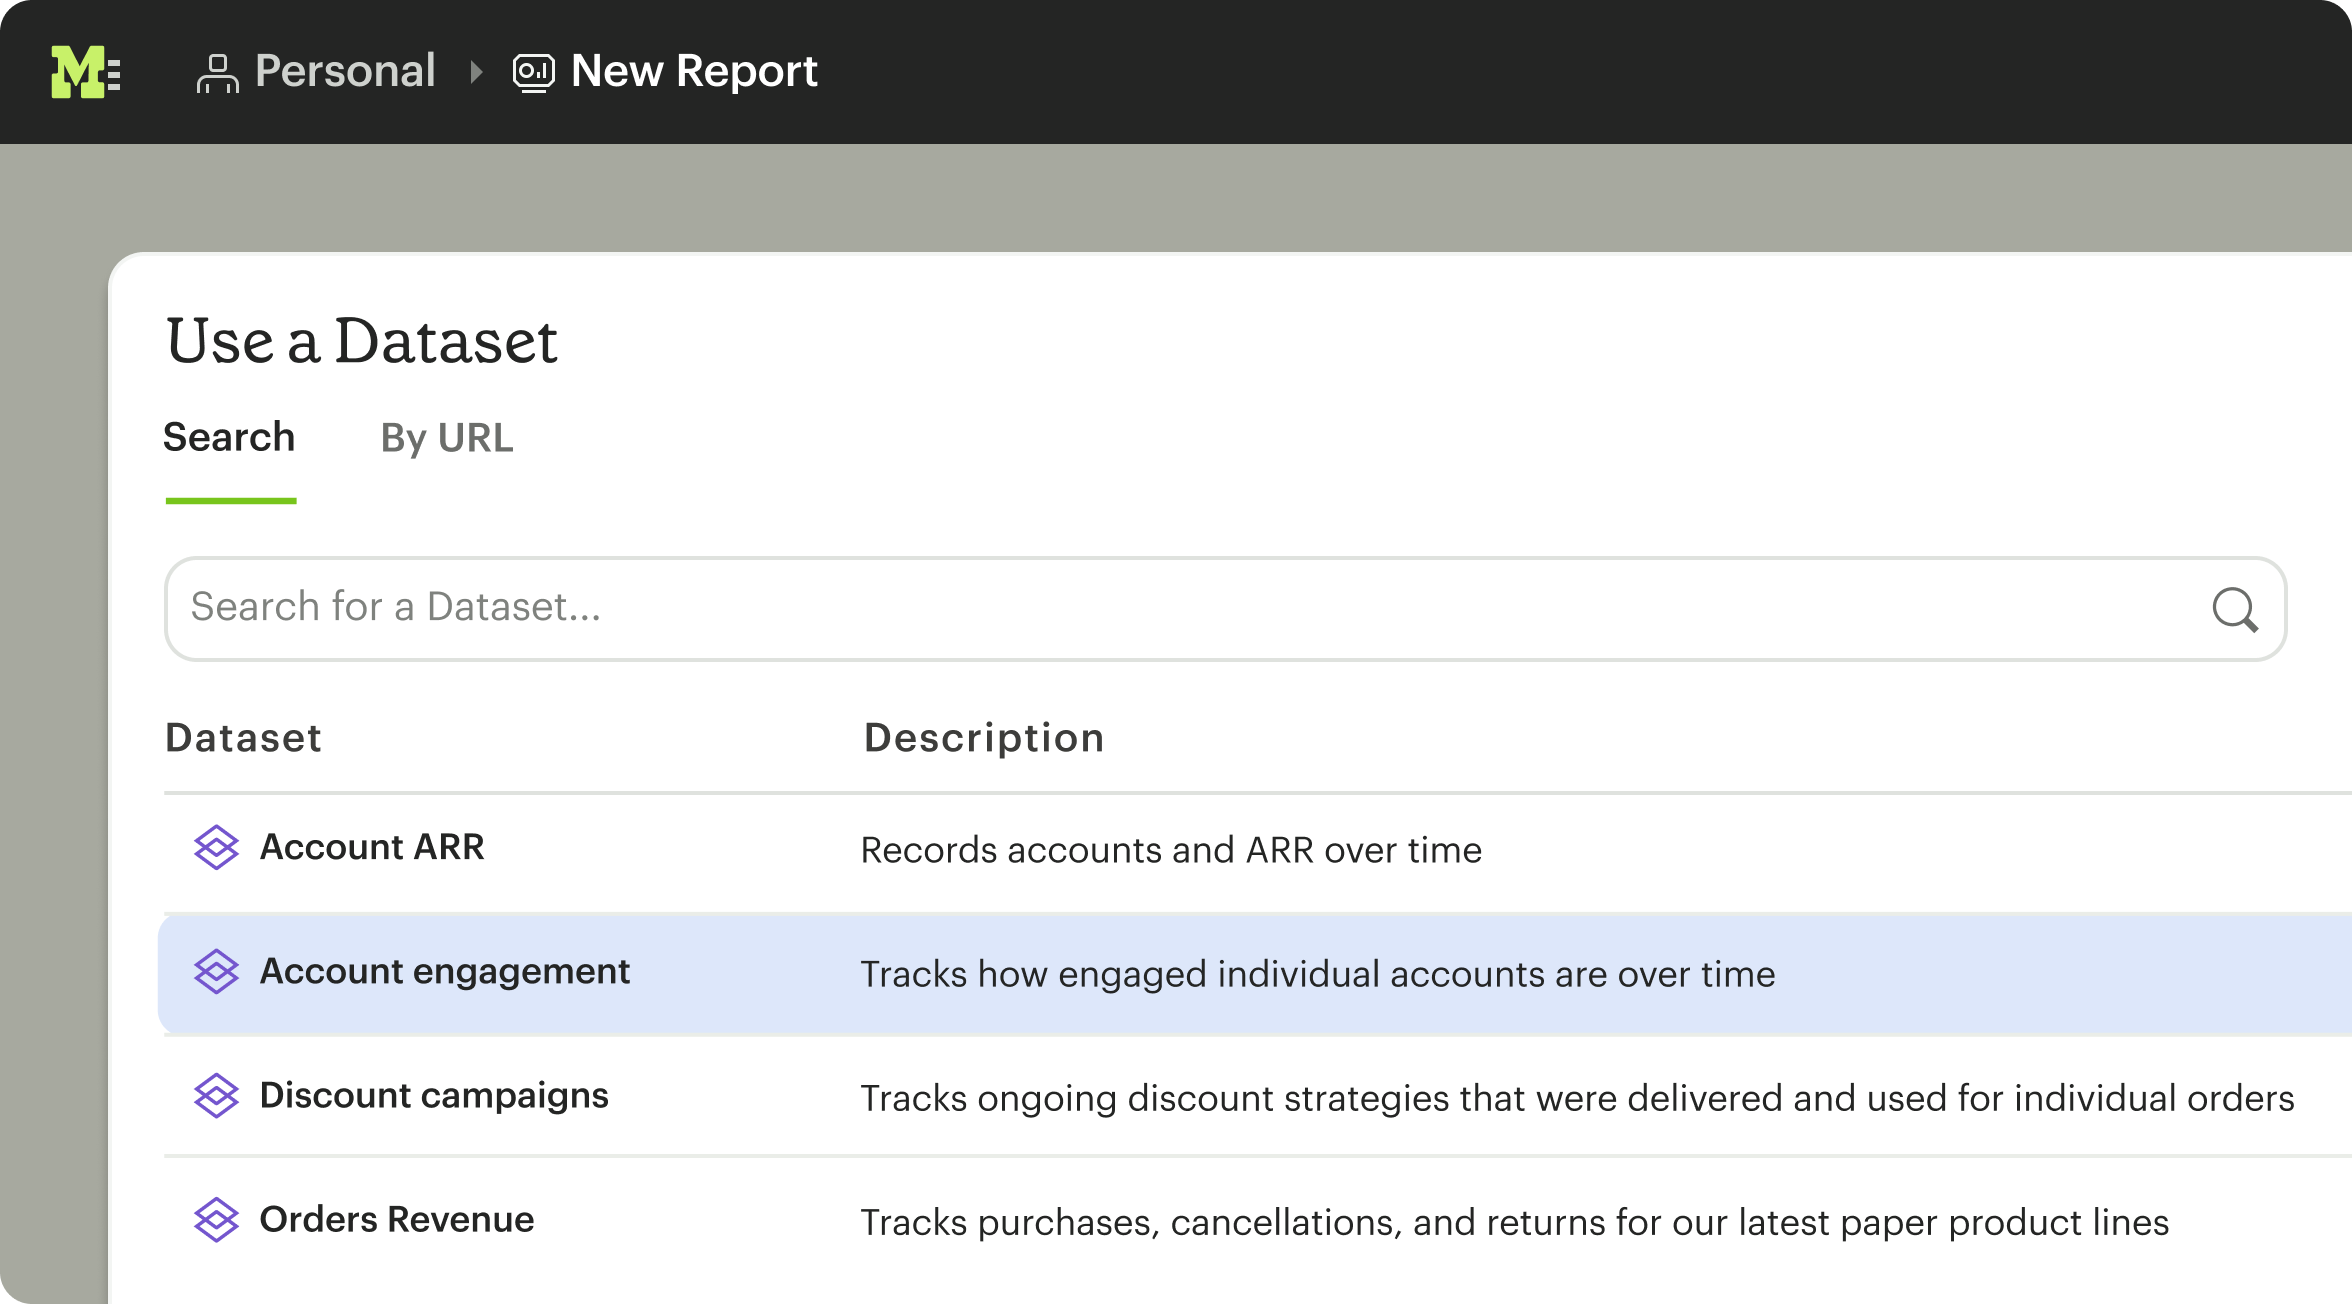
Curated and governed data, ready to be explored
The best self-serve reporting comes from confident understanding of data. Starting with trusted data designed by your data team, you can explore and build your own analysis, no code required.
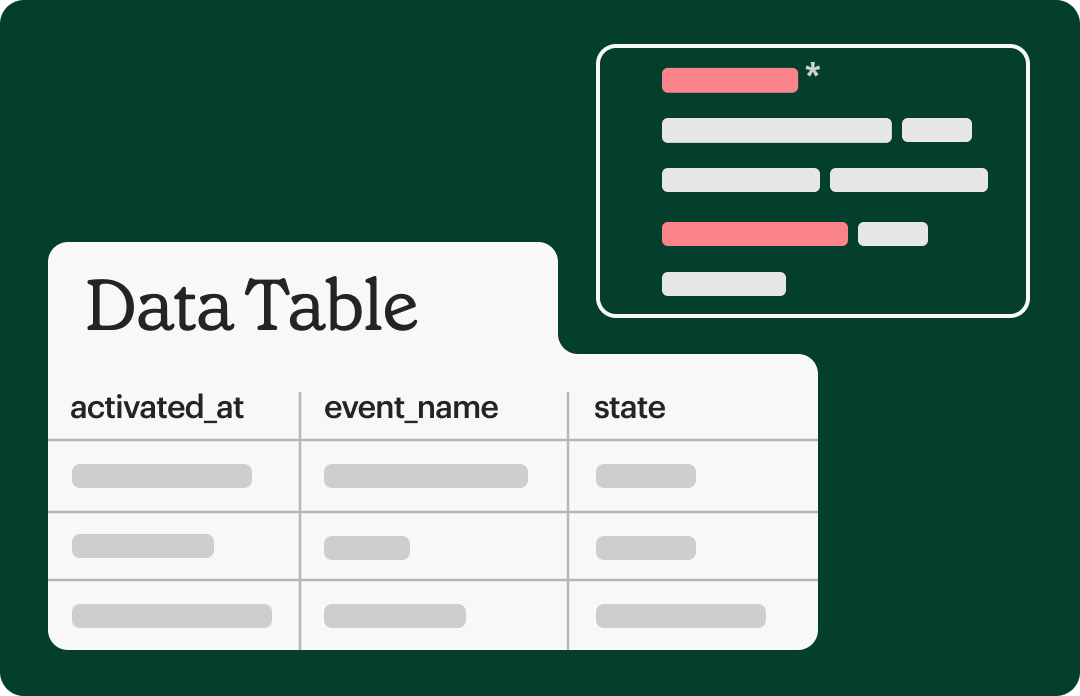
Datasets
Built by analysts in tight partnership with domain experts, datasets are go-to starting points with all the dimensions and measures needed to answer zillions of questions.
Learn more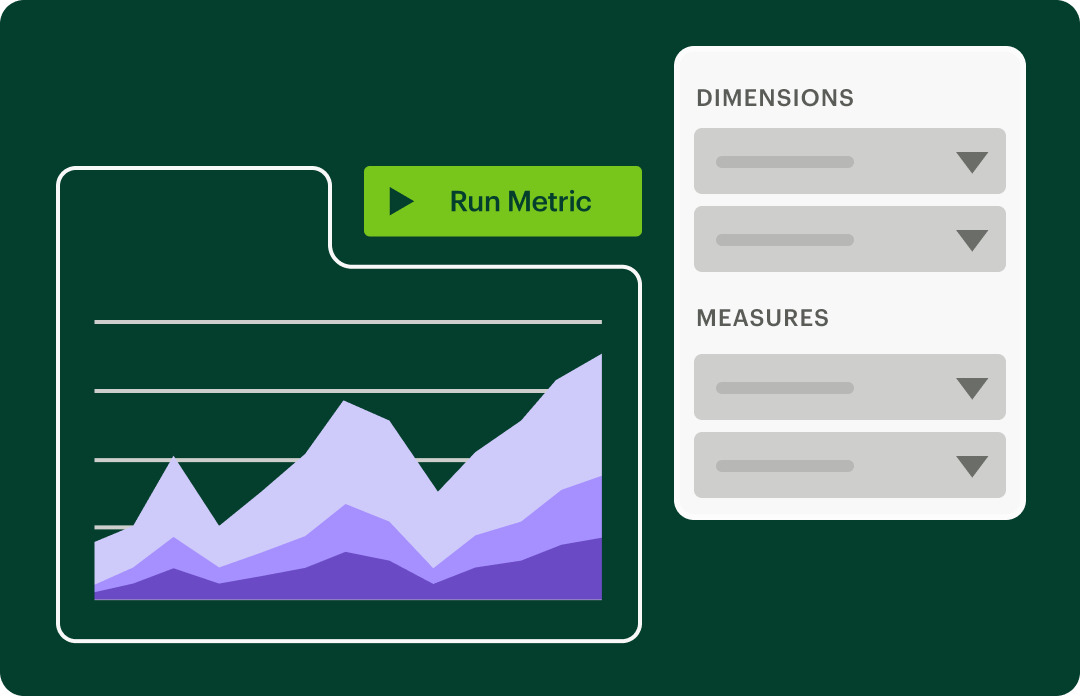
dbt metrics
Governed at the source, the dbt Semantic Layer integration serves up mission critical KPIs for exploration, so everyone's numbers match across the board.
Learn moreVisual thinkers welcome
Drag-and-drop your way through governed datasets and metrics, iterating through as many visualizations as you need to understand your data and find that aha moment.
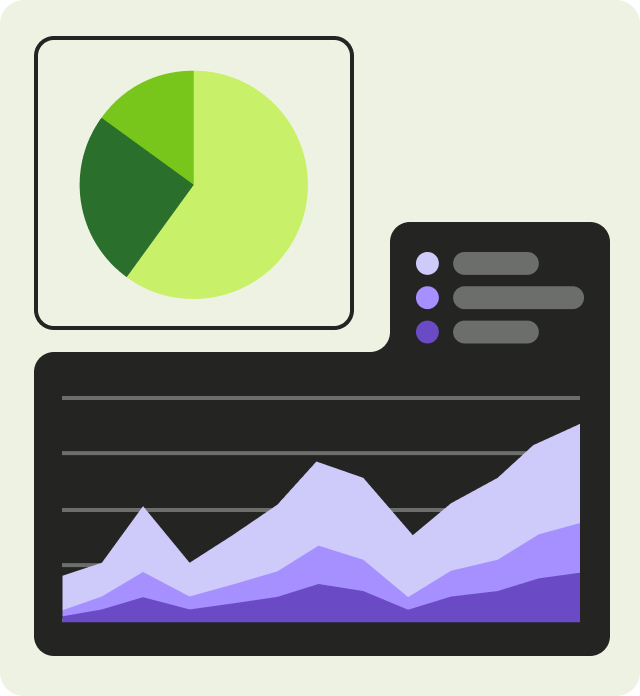
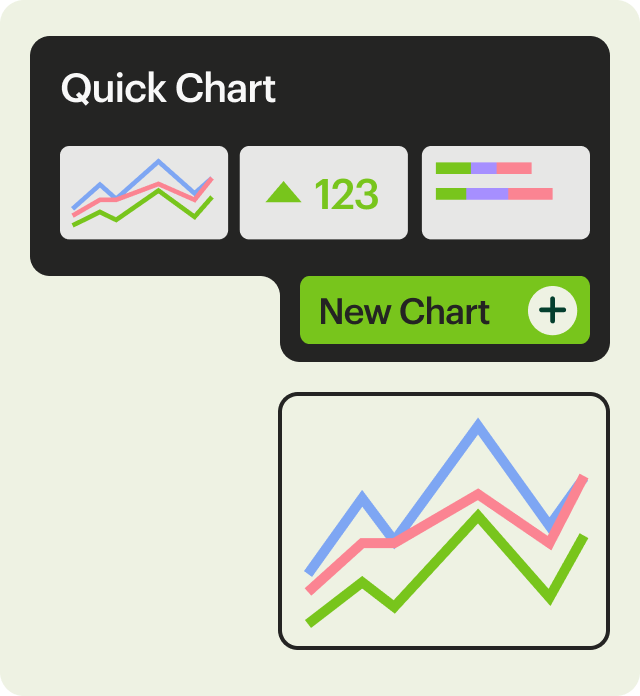
Simple charts
Spin up bar and line graphs, pie charts, pivot tables, and more in seconds.
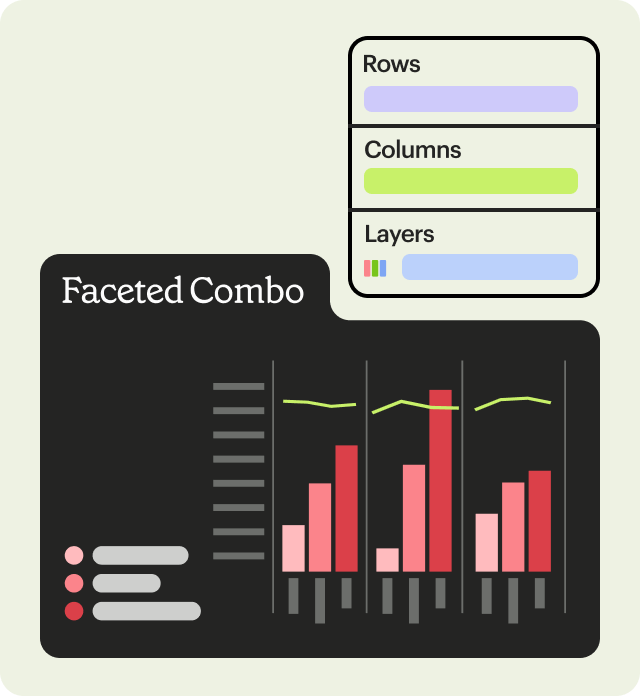
Multi-faceted, multi-dimensional
Building complex charts is possible with drag-and-drop charting visual analysis that is anything but basic.
Endless iteration
Visualize your data, then quickly iterate through as many versions of the chart you need to get your point across.
Put it all together
Start with your trusted data, build your visualizations, then share your insights across your organization by building your own one-off report or always-on dashboard with the most relevant data to your team.


Text write-ups
Don't just share the charts. Give them context with a quick explanation.

Plenty of charts
Add as many visualizations as you need to monitor your metrics or share your insights.

Automatic refresh
Reports built on datasets are automatically refreshed based on the dataset schedule.

Schedule and share
Schedule once, and don't think twice about automated sharing of your reports over Slack or email.

Always accurate
Reports powered by dbt metrics are 100% accurate, 100% of the time.

Automatically updated
Reports built on curated data sources like datasets and dbt metrics will automatically be updated when any foundational data changes.
Building a self-serve experimentation platform in Mode enabled the product team to dig deep into product usage, while freeing up the data team to drive strategic product experimentation.

Neil Chainani
Data Science Lead

30%
increase in data team bandwidth
Modern Business Intelligence
Beyond BI as you know it
Behind every great idea is really great data. Mode is the single platform to unite data teams and business teams around analytical work.
Platform overview


Get more from your data
Your team can be up and running in 30 minutes or less.