Mode updates
5 Python Libraries for Creating Interactive Plots
According to data visualization expert Andy Kirk, there are two types of data visualizations: exploratory and explanatory. The aim of explanatory visualizations is to tell stories—they're carefully constructed to surface key findings.
Exploratory visualizations, on the other hand, “create an interface into a dataset or subject matter... they facilitate the user exploring the data, letting them unearth their own insights: findings they consider relevant or interesting.”
Editor’s picks in Mode updates
5 Python Libraries for Creating Interactive Plots
October 12, 2016• 6 minute read
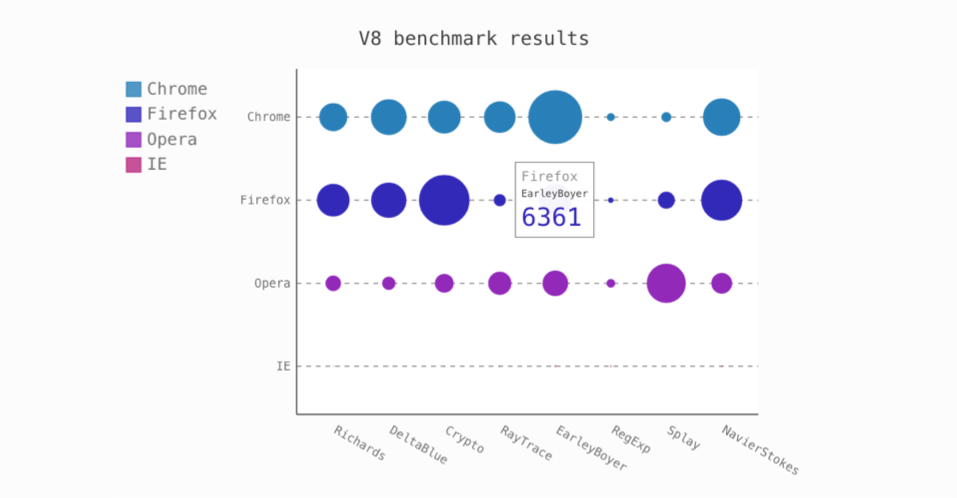
According to data visualization expert Andy Kirk, there are two types of data visualizations: exploratory and explanatory. The aim of explanatory visualizations is to tell stories—they're carefully constructed to surface key findings.
Exploratory visualizations, on the other hand, “create an interface into a dataset or subject matter... they facilitate the user exploring the data, letting them unearth their own insights: findings they consider relevant or interesting.”
Melissa Bierly
Content Marketing

Making Simple Visualizations Easy: A Front-End Engineer's Perspective
September 15, 2016• 9 minute read

Since the beginning, one of Mode's goals has been to make simple things easy and complex things possible.
In the past year, we added on data visualization capabilities on both fronts. We've added support for Python and its most popular data viz libraries and surfaced the ability to customize reports with HTML, CSS, and JavaScript.
Melissa Bierly
Content Marketing
