


Problem
Analytics are hard to get right – especially for complex business models (like API-first SaaS).
Building a flexible analytics stack is typically a challenging, non-trivial project. Everyone wants accurate, comprehensive data that can be easily consumed by teams across the company, but getting there hasn’t always been easy. This often requires a team of data engineers to build, test, and monitor a custom ETL (extract, transform, load) pipeline that cleans, aggregates, and loads data from disparate data sources into a single data warehouse. Once the pipeline is in place, it’s not as simple as “set-it-and-forget-it.” Brittle ETL scripts often break, data schemas frequently change, and databases in the warehouse need version upgrades or run out of disk space. Not to mention the fact that a small army of SQL-proficient analysts is often needed to make sense of the data, building dashboards and visualizations for executives and other teams to consume. This presents a significant challenge for large companies with near-infinite resources, whereas it becomes nearly impossible for small, lean teams with limited time and resources. Clearbit is no exception.
Our Challenge
Like any rapidly growing, early-stage startup, the engineering team at Clearbit is primarily focused on shipping product and maintaining uptime, leaving limited bandwidth for ancillary projects like analytics. Because of this, our early efforts aimed at tackling this problem revolved around the use of pre-built, out-of-the-box analytics tools like Kissmetrics, Mixpanel, and ChartMogul. These tools were simple to set up, but we quickly ran up against the inherent limitations in these products as our needs grew more sophisticated. We’d inevitably run into questions we couldn’t answer using an opinionated analytics UI, which led to many calls with support engineers (one of whom told us they couldn’t solve the problem because “data is inherently unwieldy”). As a temporary workaround we ended up writing scripts to aggregate the data and export to a local Postgres database for ad-hoc querying. It quickly became clear that a new approach was required.
Our ideal approach was one that:
- Required minimal engineering resources for setup and maintenance
- Provided a flexible and easily customizable data schema
- Allowed for simple data aggregation across multiple services and sources
- Enabled accessible data exploration with robust visualizations and dashboards
- Most importantly, provided the ability to easily append Clearbit data to everything!
Our Solution
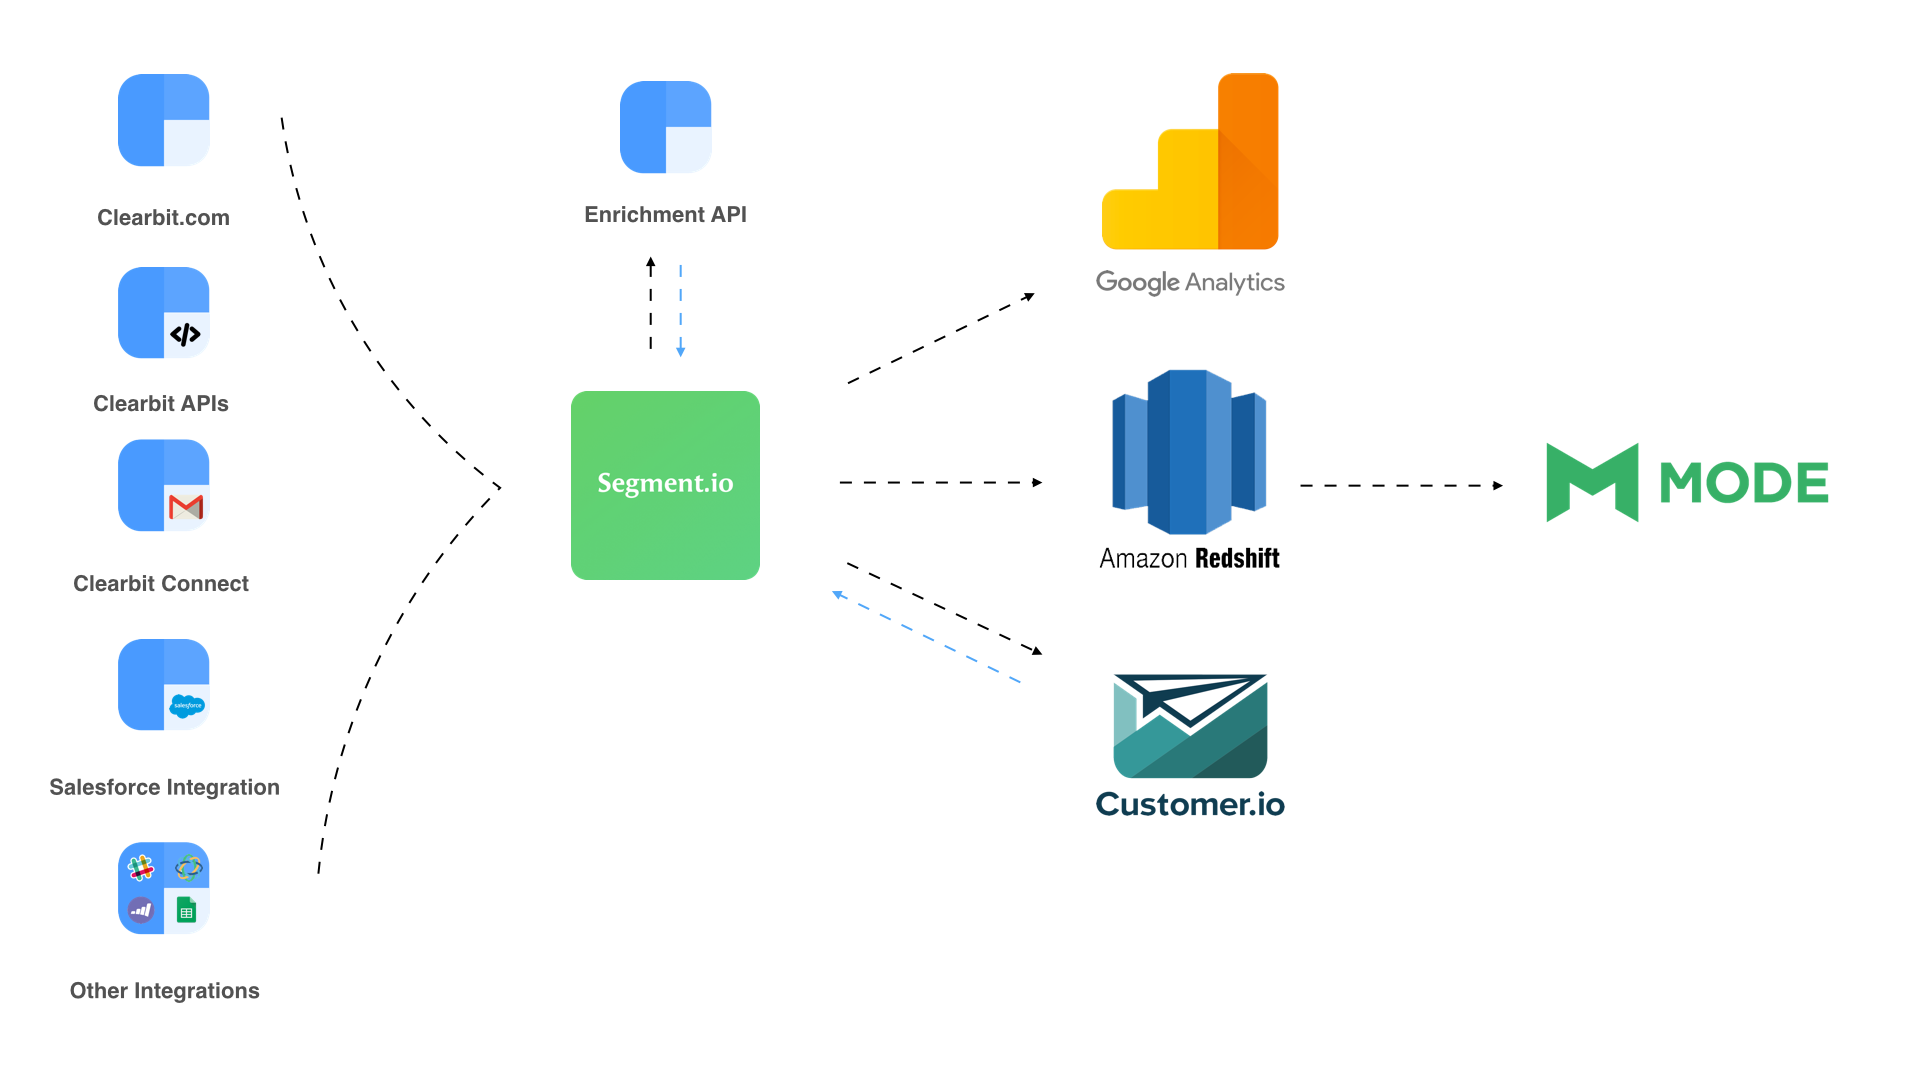
After analyzing our options, ranging from open source ETL libraries to third-party data pipelines, we concluded that no single vendor was going to solve all of our needs. Instead, we landed on a trio of providers: Segment + Redshift + Mode.
Step 1: Segment
Segment’s robust API and Ruby library enabled our engineering team to quickly build an event emitting service that sends usage and behavioral data from Clearbit applications and services into Segment, tracking everything from API usage and page views to signups and subscribe events. Once users are sent to Segment, the native Clearbit integration automatically enriches them with valuable demographic and firmographic attributes. Because of Segment’s flexibility, as Clearbit evolves and new products are added, new traits and events can be added quickly with minimal code changes.
Segment then handles the complex process of collating all of this data and syncing daily into our Redshift instance, automatically creating new tables, managing indexes, and adding columns as new traits and events are added.
Step 2: Redshift
Redshift is Amazon’s data warehouse product. It is based on a heavily modified version of PostgreSQL and makes use of massive parallel processing for incredibly performant querying using standard SQL syntax. Each Redshift cluster is horizontally scalable and capable of ingesting larger quantities of data than Clearbit will ever produce. Data is replicated across multiple nodes and is continuously and redundantly backed up to S3. We’ll never have to worry about running out of disk space and can sleep soundly at night knowing our data is backed up and safe.
Step 3: Mode
Mode easily connects to Redshift, making it simple to explore the data in our warehouse. Everyone on the Clearbit team is at least minimally SQL proficient, so everyone from sales to marketing to engineering is empowered to ask questions of the data that’s been collected. Queries can be saved and shared for repeat use, and Mode’s beautiful charts and reports make it easy to build automatically-refreshing dashboards to monitor key metrics and trends. For more advanced analysis, Mode’s Python notebook is invaluable, allowing us to build predictive models and complex regressions.
We’ve been really happy with how this analytics toolkit has been working for us so far. It’s enabled us to answer questions like:
- Which Clearbit attributes correlate most strongly with frequent API usage?
- How do churn rates vary by product type?
- Which user segments are most most likely to convert to paying users?
- What’s the best model to use historical invoice totals to predict future revenue?
What’s next?
We’re always refining and adding to our analytics, and as our business grows we’ll continue adding and building new attributes. We’re specifically interested in using the data we’ve collected to improve our advertising efforts, build laser-targeted custom audiences and better measure effectiveness. We’ve also experimented with using machine learning to build a buying propensity model to help us recognize the best inbound leads.
Building out a flexible analytics stack is equally important to startups as it is to the enterprise. As an API company, we’re thinking a lot about making data accessible to everyone. It shouldn’t require an infinite budget to collect and analyze data – that’s part of our mission. And thanks to tools like Mode, Segment and Redshift, it’s easier to do than ever.

