


As a demand generation marketer, I'm constantly searching for the right mix of ad platforms and publishers to bring in leads. But when each platform reports on different performance metrics, in different formats, with varying levels of automation, aggregating metrics quickly becomes a nightmare. I've spent countless hours copying and pasting across files, formatting cells, and writing complex Excel formulas to report on paid performance.
At Mode, we store our ad data into the same Redshift data warehouse as our product data. With this data integrated, I'm able to use SQL to automate paid performance reporting. I can quickly determine metrics like average click-through-rates, cost per signup, and daily ad spend. The bulk of my time can be focused on the actual programs I'm developing.
I like to organize all of these metrics in one dashboard. Here's an example of a spend reporting dashboard (with all placeholder numbers, of course). We'll show you how to start building Definitions and the queries you'll need to report on performance of your own advertising campaigns.
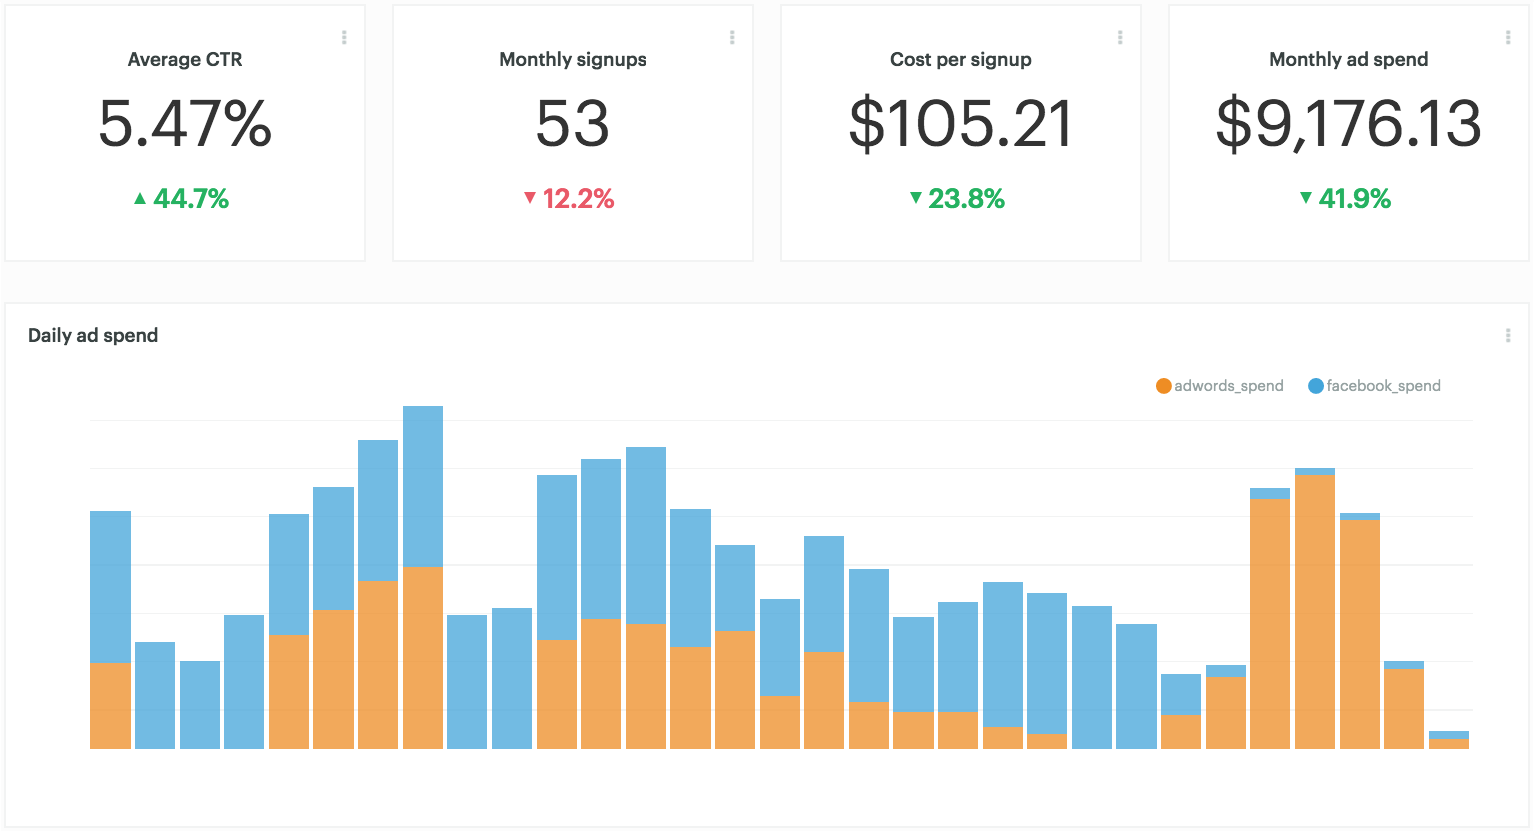
We'll walk through a Definition that aggregates daily spend on Facebook and AdWords and powers the “Monthly ad spend” and “Daily ad spend” charts in the dashboard above. In addition to laying the foundation for dashboards, Definitions can be combined with product data and data from other SaaS tools to conduct detailed funnel analyses. Let's get started!
Getting familiar with Facebook and AdWords tables
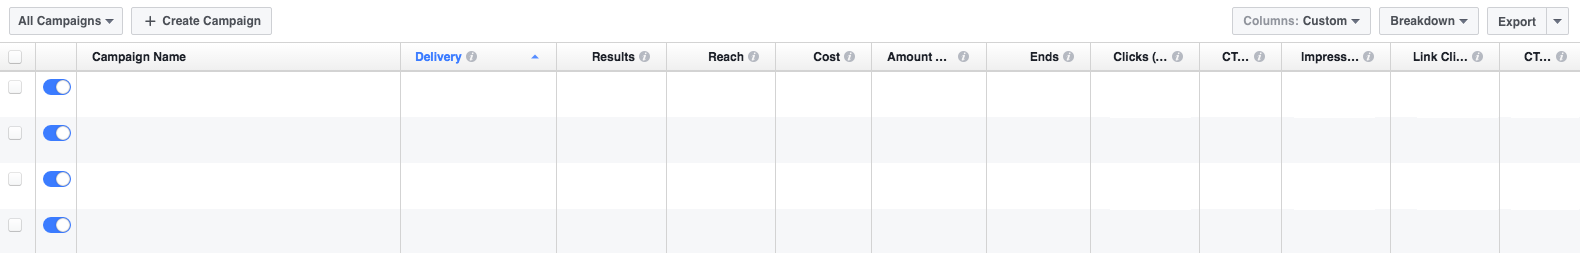
I'm used to seeing ad data all together in one table in the Facebook Ads Manager UI, like this:
But in our Redshift database, raw Facebook and AdWords data is split up into several tables.
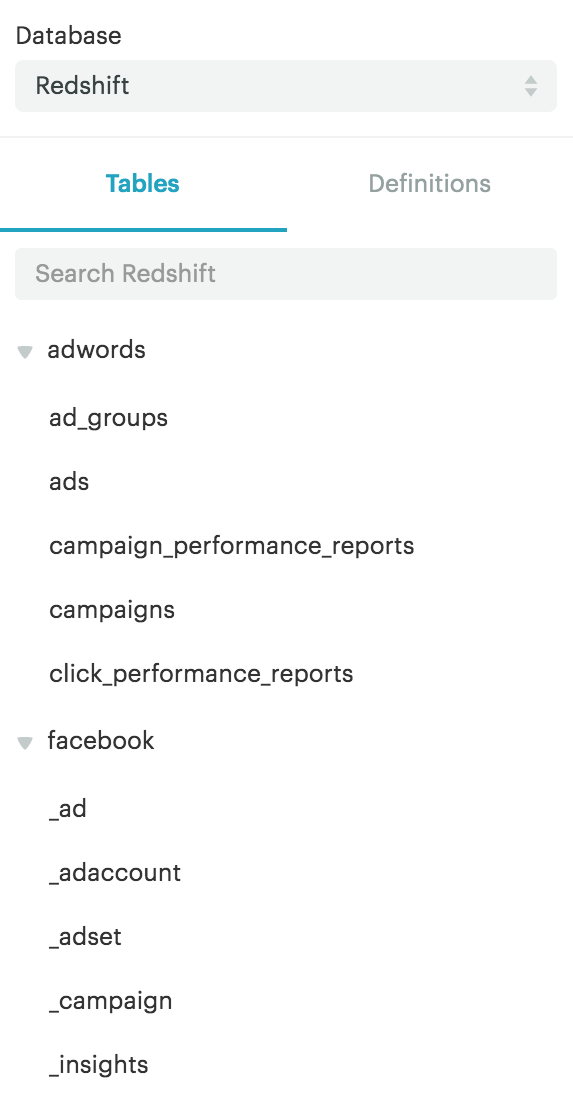
These tables may have different names depending on your ETL provider, but the tables' contents are similar. Segment Sources created some schema visualizations to help folks understand what each table contains and how they connect to each other:
AdWords campaign data is found in the campaign performance table (in this case, adwords.campaign_performance_reports), and Facebook campaign data is found in the insights table (facebook._insights).
Data is structured differently in each table. The adwords.campaign_performance_reports table features a row for each campaign by day. The facebook._insights table, on the other hand, features both a daily and a weekly row for each campaign.
We used data from both of these tables in our Definition to aggregate daily ad spend. This ensures that everyone is calculating ad spend in the same way. If table names change, we can update the Definition once, rather than trudging through multiple reports to fix queries. And any time a new question about ad spend pops up, we can reference this Definition and immediately dig into the analysis.
Of course, there are a ton of other publishers and platforms besides AdWords and Facebook, but these two powerhouses are a good place to start. If you work with more publishers or platforms, and have the data synced into your data warehouse, you can add additional spend data to the Definition—or modify the Definition any time you add a new platform to the mix. Every report where the Definition is referenced will be automatically updated.
Writing a SQL query to determine ad spend
Here's the marketing_spend_daily Definition that aggregates AdWords and Facebook daily spend:
	SELECT d.day,
	   	   aw.adwords_spend,
	   	   fb.facebook_spend
  	  FROM (SELECT DATE_TRUNC('day',r.created_at) AS day
          	  FROM webapp.reports r
        WHERE r.created_at >= '2016-01-01'
        GROUP BY 1) d
LEFT JOIN (SELECT DATE_TRUNC('day',aw.date) AS day,
              	  SUM(aw.cost) AS adwords_spend
         	 FROM adwords.campaign_performance_reports aw
     		GROUP BY 1) aw
   	   ON d.day = aw.day
LEFT JOIN (SELECT LEFT(fb.date_start,10)::timestamp AS day,
              		   SUM(fb.spend) AS facebook_spend
         	 FROM facebook._insights fb
        	WHERE fb.date_start = fb.date_stop
     	    GROUP BY 1)fb
   	   ON d.day = fb.day
ORDER BY 1
There's a lot going on here, so let's look at the query piece by piece.
1. Generate a list of dates
The query pulls three columns, which come from three different subqueries (d, aw, fb):
	SELECT d.day,
      	   aw.adwords_spend,
      	   fb.facebook_spend
The first subquery (d) provides a list of dates—one for every day. Some days there isn't any marketing spend, so we had to pull this list of dates from another table that has at least one event each day (in this case, we chose a table called webapp.reports — leveraging product data that we know has at least one row every day).
	(SELECT DATE_TRUNC('day',r.created_at) AS day
   	   FROM webapp.reports r
   	  WHERE r.created_at >= '2016-01-01'
	  GROUP BY 1) d
Without this step, days with zero marketing spend events would be omitted from the results. Say we wanted to make a line chart of spend by day: the x-axis would be missing any days with zero spend, and so would our chart.
2. Calculate AdWords spend
The spend values come from two subqueries aliased as aw (Adwords) and fb (Facebook) respectively.
Subquery aw selects two columns; one for day (which we'll use to join onto subquery d), and another for adwords_spend. Since we wanted to add up all the cost events each day, we used the SUM function to aggregate the cost.
	(SELECT DATE_TRUNC('day',aw.date) AS day,
      		SUM(aw.cost) AS adwords_spend
 	   FROM adwords.campaign_performance_reports aw
	  GROUP BY 1) aw
3. Calculate Facebook spend
Subquery fb also selects two columns; one for day and another for adwords_spend. Once again we used the SUM function to aggregate spend events by day.
The facebook._insights table includes multiple rows for the same spend, some for weekly spend and others for daily spend. To avoid counting the same dollars multiple times, we added a WHERE clause to filter out the unwanted weekly rows. We were able to do that by only selecting rows WHERE fb.date_start = fb.date_stop , which limits the results to only the daily spend.
	(SELECT LEFT(fb.date_start,10)::timestamp AS day,
      			 SUM(fb.spend) AS facebook_spend
 	   FROM facebook._insights fb
	  WHERE fb.date_start = fb.date_stop
	  GROUP BY 1)fb
4. Join subqueries
Since we wanted to include all days (even those where spend happens to be NULL), we used LEFT JOINs to connect subqueries aw and fb to subquery d:
LEFT JOIN (SELECT DATE_TRUNC('day',aw.date) AS day,
              	  SUM(aw.cost) AS adwords_spend
         	 FROM adwords.campaign_performance_reports aw
     		GROUP BY 1) aw
   	   ON d.day = aw.day
LEFT JOIN (SELECT LEFT(fb.date_start,10)::timestamp AS day,
              		   SUM(fb.spend) AS facebook_spend
         	 FROM facebook._insights fb
        	WHERE fb.date_start = fb.date_stop
     	    GROUP BY 1)fb
   	   ON d.day = fb.day
5. Display results in chronological order
Since date is our first column, we ordered results chronologically using:
ORDER BY 1
6. Add more publishers
To keep adding publishers, we would use an additional LEFT JOIN with the same format of:
LEFT JOIN (SELECT day,
          SUM(cost) AS spend
     FROM new_publisher p
    GROUP BY 1) p
ON d.day = p.day
Building a report with a Definition
We can query a Definition as if it were a table and then build charts on top of the queries. In the example dashboard above, the “Monthly ad spend” metric is powered by this SQL query:
SELECT DATE_TRUNC('month',day) AS month,
   	   SUM(COALESCE(adwords_spend,0) + COALESCE(facebook_spend,0)) as total_spend
  FROM {{ @marketing_spend_daily }}
 WHERE day BETWEEN '2016-05-01' AND '2016-07-31'
 GROUP BY 1
And the “Daily ad spend” stacked bar chart is built on top of this query:
SELECT TO_CHAR(day,'Mon-DD')as day,
   	   adwords_spend,
   	   facebook_spend
  FROM {{ @marketing_spend_daily }}
 WHERE day BETWEEN '2016-07-01' AND '2016-07-31'
 ORDER BY 1
If we want to add to new publishers to these charts, we can edit the marketing_spend_daily Definition, and this report (and any others using marketing_spend_daily) will be automatically updated.
Best of all? Now we've got a robust ad performance dashboard built on live data. We can refresh this dashboard anytime to get the latest results and dig into the underlying data if we have any questions.
Make the most of your marketing data
We're co-hosting a webinar with Segment on October 13 for analysts and data-driven marketers. Learn how to analyze engagement and ROAS with SQL. Register here.
