


Since the beginning, one of Mode's goals has been to make simple things easy and complex things possible.
In the past year, we added on data visualization capabilities on both fronts. We've added support for Python and its most popular data viz libraries and surfaced the ability to customize reports with HTML, CSS, and JavaScript.
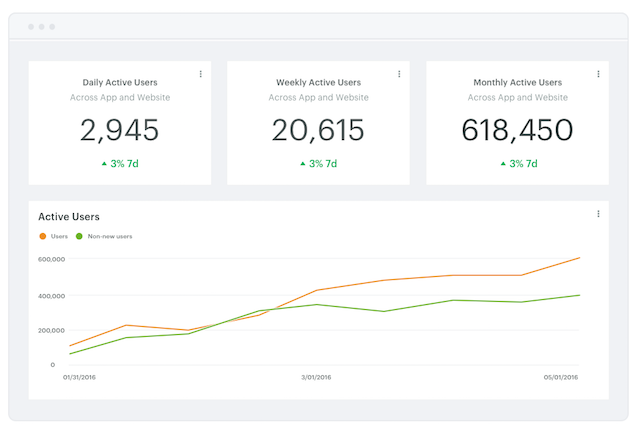
At the same time, we're constantly adding to our out-of-the-box charting capabilities. Two recent advances—filterable, sortable display tables and Big Number charts for dashboarding—have been big for reporting. Behind the scenes, front-end engineer Franklin Clark has been rebuilding our charting capabilities from the ground up.
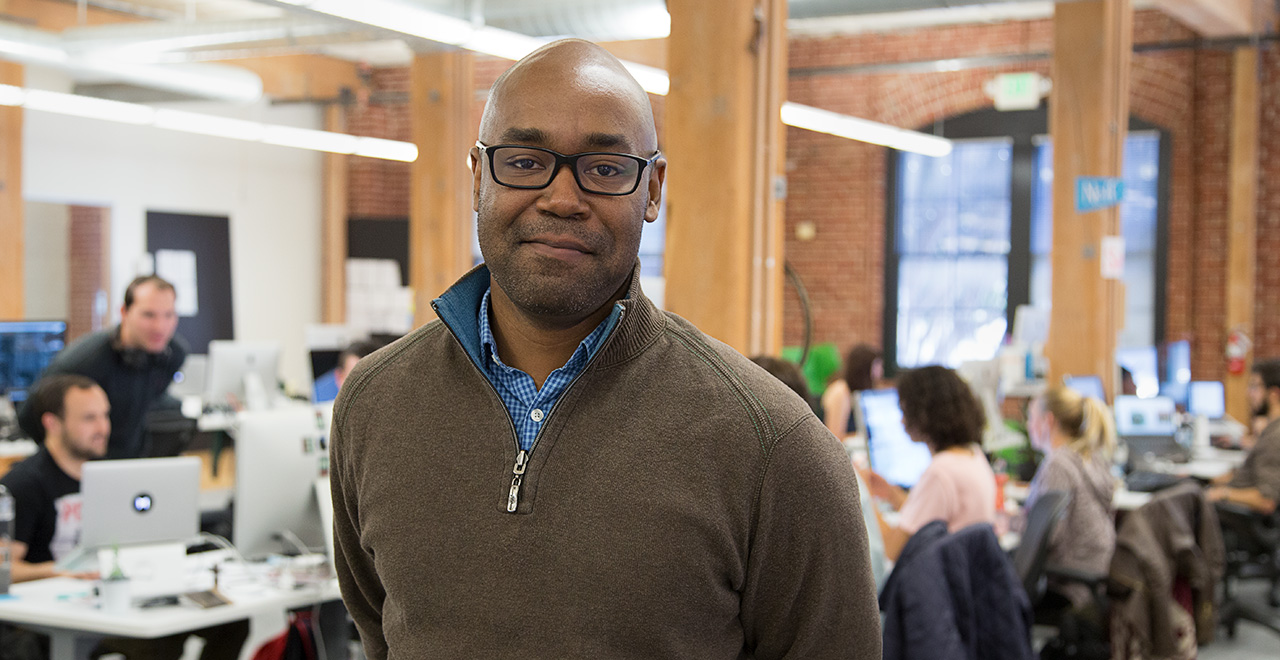
We recently took some time to chat with Franklin about what he's been up to in the six short months since he joined Mode.
Being an engineer at Mode
Hi Franklin. Let's start with what brought you to Mode?
I used Mode a lot at my previous company to identify and resolve edge-case product failures, and I really liked it. The application is pretty forgiving and very easy to use, especially for someone who doesn't spend a whole lot of time with SQL.
I was also looking for a change. I reached out to Mode because I was really excited at the prospect of working on an application that's used on a day-to-day basis. Plus, I thought Mode was a solid product; the design and the UX were very tight. I shot Mode an email and the recruiting team set up a phone screen. I had a very good feeling after meeting the team. And now here I am.
What's the product development process like at Mode?
We're light on process and the team is small. We maintain a collaborative momentum with weekly meetings and constant code reviews. During these meetings, we discuss design decisions and challenges on our projects. We get and give feedback, in regards to each others' code and in regards to our experience. The product planning and development process is collaborative, and it's constantly improving.
We have project team kickoffs, where everybody—engineers, designers, the product manager, stakeholders—come together and develop initial stories. At Mode, the project picks up momentum as stories are groomed and groundwork is done. It's been very organic and focused.
There's a lot of context given to all the team members working on a project, like how the work lines up with our marketing strategy and financial quarters. It's very different from a lot of companies where sometimes the process happens in a black box and then gets dumped on your lap. I'm a person who really finds it difficult to do something without understanding why. I ask a lot of questions, which might make me seem rebellious to managers who don't want to have those conversations. But, the team at Mode spends a lot of time sharing context up front, which makes projects much easier to execute.
Working on Mode's charts and tables
In the short six months that you've been here, you've been focused on projects related to presenting data. You launched the new display tables and the Big Number charts. Tell us about how those projects came to be.
My first project here at Mode was to make data tables that were more useful and useable. The kickoff meeting was really just a stream of requests—essentially a backlog that seemed to exist before I was here. Josh Ferguson, our CTO, wanted certain things to be faster. Customers had also requested filtering and the ability to sort columns.
I took those ideas and did my own investigation. After I got comfortable with a codebase and the domain, I talked with Mike DeCarlo, our product manager, and Blake Reary, one of our product designers, to get an understanding of implementation.
Those discussions created a collaborative momentum and a progressive energy, leading to a very fun proof of concept that brought together these different visualization initiatives.
Mode has a very mature, organic methodology in regards to planning and developing products. It allowed us to prioritize and develop the features very painlessly and deliberately. I've only been here for six months, but I've already done two large projects and now we're working on a third. I think that demonstrates the effectiveness of the collaboration and chemistry here at Mode with this team.
You mentioned doing your own investigation after that initial kickoff meeting. What did you dig into and what did you discover?
My goal was to encapsulate the concepts behind what the application does. I spent a lot of time in Mode, getting used to the product from a new perspective and figuring out how things worked.
When I dug into the codebase, it became apparent that we needed to do a large-scale refactoring. The code wasn't very clear or scalable.
When Mode started, reports could only contain one table and one chart. Since then, we've scaled to support several tables and charts of various types. Unfortunately, the rendering, all that flow-through, still went through the same single code path as the original implementation of the application. It was essentially an overgrown minimum viable product (MVP). We needed to tease out new abstractions from these monolithic methods and switch statements that our charts depended upon until that point.
How did you move from those discoveries to a proof of concept? Can you describe what the final proof of concept looked like?
After recognizing some patterns, I was able to figure out different ways of thinking about how tables and charts should operate. I brought up a couple of ideas:
- Separating rendering from the data manipulation and sorting and computation.
- Scaling a modeling concept into separate functionality groups to accommodate charts that are graphs or plot points, or that are tabular or pivoted.
The proof of concept was essentially the ground zero for our new library, called axle, that's in production today. Right now it works with straight or tabular data, but the next step is to accommodate pivoted data.
Why was separating rendering and data manipulation important?
The biggest is that the code is a lot more testable. When you're testing methods, you can now just test for a discrete input and output. You don't have to worry about a method that is going to have a series of side effects and compound the complexity of your application.
Another benefit is that the code is more learnable and scalable. We can actually think about problems in their discrete domains or in relation to the discrete domain or function. I can scale modeling. I can change our renderer from plain JavaScript, which it is today, to another web component library like React. That has a ripple effect across everything. Having that level of organization changes not only the way your applications function and are maintained, but also the way you think about your applications and how your customers think about your applications.
What's up next?
The next big thing is Pivot Tables. I think it's where the new modeling architecture is really going to lay down roots. Both tables and Big Number charts already leverage the new modeling architecture, but Pivot Tables are going to help bring it into focus as we add more functionality.
I'm very interested in the visualization juxtapositions. We're planning to ship Pivot Tables that can be heat maps or that are bar graphs. For instance, if you have a row that says 50%, 75%, 25%, it wouldn't just display those numbers—it would have visual representation.
That's going to become interesting because we're going to have to derive those values. I'm going to be applying the scales, color scales, and then applying value color scales, so if you give me a value of 50, I need to give you a blue or if you give me a 75, I need to give you a darker blue on a specific scale. It sounds like fun.
Scaling engineering work and processes
You've seen products and teams scale before. What have you learned that you're bringing to Mode?
Kyle Simpson talks about the need for a code to be learnable and effective, and I'm in agreement. Identifying patterns and creating proper abstractions is key to encapsulate the core domains and concepts represented within your code base. When you're scaling from a small team to a larger team, it's crucial to synchronize habits and, for lack of a better word, religion.
I think the goal of any effective team is to have their code base seem as though it were written by one person. That means coming together on a set of principles and style guides and stylistic guidelines for your codebase—that could result in a style guide or in a configuration that automatically validates your code against predetermined conventions. That makes your patterns and abstractions more teachable.
There a million ways to program something. Writing instructions for a computer to do something is easy. But the code we write is really for each other. When you're one or two people working on a project, you can forego dedicating too much attention to your methodology, but when you're a team, it's pretty important. That's something that we're focused on at Mode as we transition toward scale.
At your last company, you were the first front-end engineer and then the team grew. But at Mode, you came in to a front-end engineering team. What differences have you experienced coming into a growing team versus being one person that scaled into a team?
When you're the first engineer at a company, you dedicate a lot of time and energy to creating the codebase. As people join, you have to relate and assimilate other perspectives and personalities into not only the code but into your process, or into THE process. To do so, you have to be able to take criticism and emotionally distance yourself from your work.
When you join an established team, you first need to integrate and adopt practices. Start by following the rules of the road, and once empathy and appreciation and understanding is achieved, then volunteer ideas. That's when you bring in ideas from your own past experiences into a group that's trying to improve processes, code, and all these other cultural artifacts.
I find them to be totally different, but they both require empathy.
Fun at Mode
What's been your favorite moment at Mode so far?
I was recently the emcee at Modal Dialogue. That was fun. Modal Dialogue is a weekly meeting that we have, where different departments in the company share insights from their past week. It could be wins; it could be losses. It could be just insight into their general direction and learnings.
Every week, a different employee emcees the meeting—you're kind of king or queen for the day. You can orchestrate the meeting as you see fit. I DJ'ed in between presenters, and that was fun. I picked songs based on the content and personality of the presenter. For example, I played Beyonce's "Formation" before the announcements from our head of people ops. I thought it was appropriate.
Modal is a cool time to hang out and learn about how everything else is going. I think it brings everyone together.
Any parting words? Things you wish people knew about Mode or engineering at Mode?
The maturity, experience, and unselfish personalities that everyone brings to the team make working at Mode a very dynamic and healthy day-to-day experience. Mode has a lot of unspoken, very healthy values that resonate with the team. I think you can have conversation with anyone here and be able to get a sense of what it's like to work at Mode.
Want to join us?
We're hiring software engineers, particularly those with Ruby and JavaScript experience. If you're interested in working with us, check out our careers page. We'd love to hear from you!

