


From the start, Mode's goal has been to make data more accessible. When analysts and their business partners work together on one data platform, everyone is empowered to explore data in ways they're comfortable with. As analysts build and share SQL-powered dashboards, business partners can self-serve answers. Analysts are freed up for ad hoc analysis that inspires more questions, and the cycle continues.
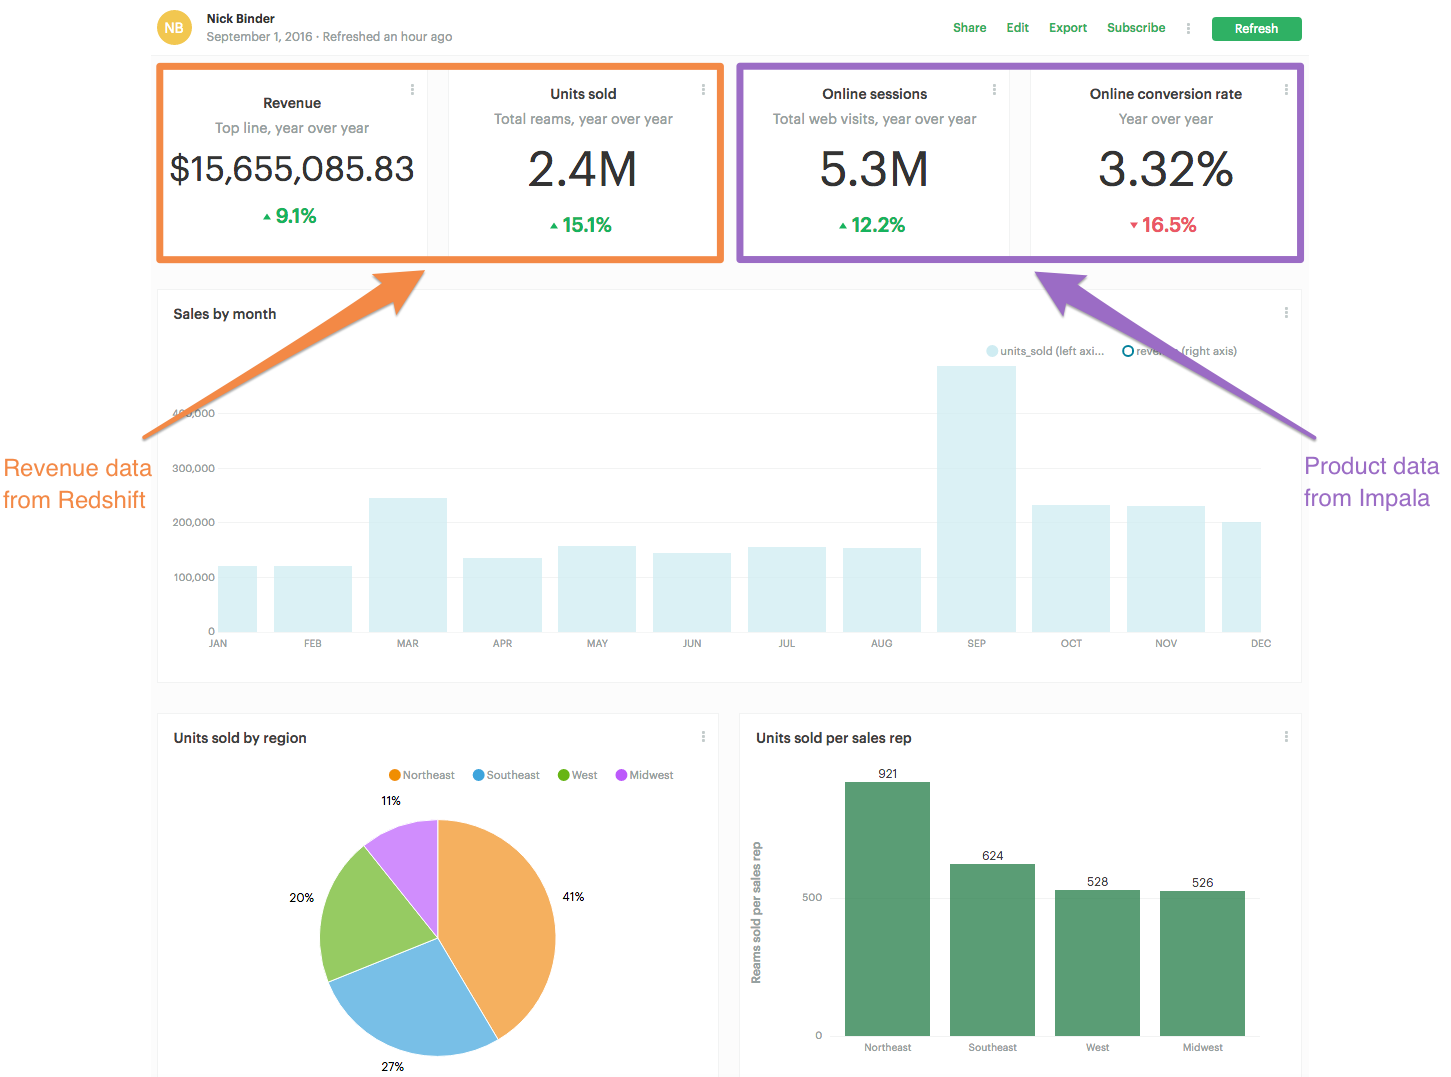
An organization's data lives in a few different databases, such as a production database replica and an analytics warehouse like Redshift. Sometimes you need to look at data from these multiple sources side-by-side. Now, you can write queries against multiple data sources in a single Mode report, which makes it easier to build dashboards and KPI reports.
Seamless exploration
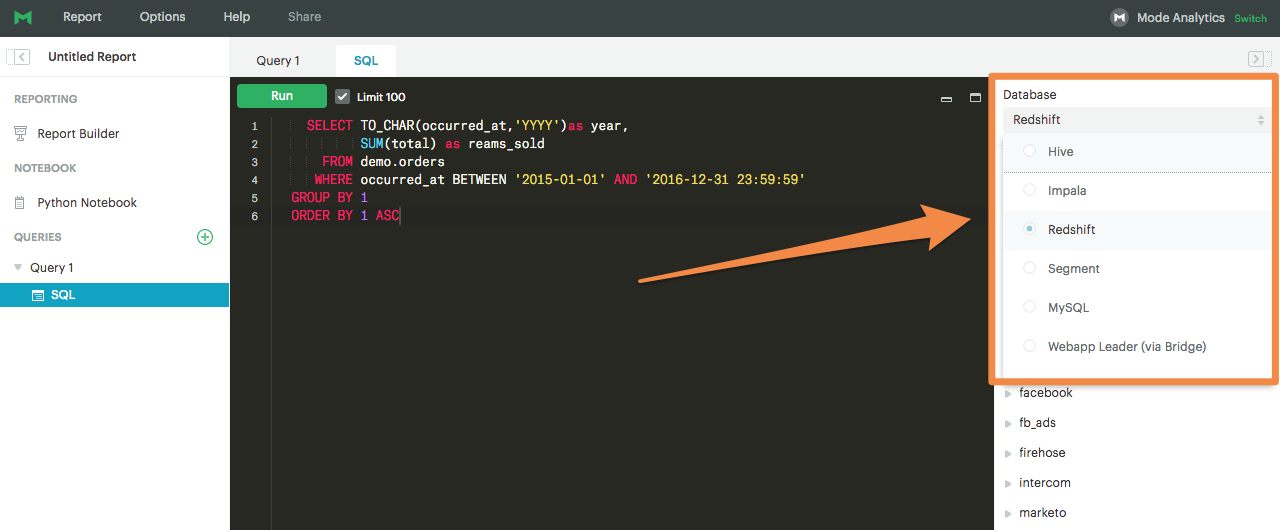
But let's say something looks off in a dashboard and it's time to dig in. Multi-source reports can make this troubleshooting process much faster, especially if the report is powered by a database that depends on an ETL process. Simply duplicate the query in question, switch data sources, modify the column references as needed, and run it. You can compare the metrics side-by-side without starting an entirely new report or switching windows.
Just select a new data source from the dropdown in schema browser.
Easy dashboarding tools for fast-moving analytics teams
Multi-source reporting is just the latest dashboarding feature Mode has added this summer. When it comes to sharing dashboards with teams throughout your company, you need tools that empower others while keeping your workload manageable. Powering dashboards with SQL is one of the fastest and most flexible to ways to deliver data to everyone in your business. Here are some of the other ways Mode makes lightweight dashboard reporting easy on analysts:
- Write broad queries and use Pivot charts to explore data visually and perform aggregation calculations.
- Big Number charts help clearly communicate KPIs.
- Take advantage of the Report Builder to resize and format your dashboard elements in just a few clicks. Or, customize everything using the HTML Editor. For a little inspiration, browse our example gallery.
- Schedule an email to land the dashboard in inboxes every Monday morning and enable teammates to filter data using parameters—and the brand new dynamic parameters.
Jump into Mode to experiment with these dashboarding features and more. And when a dashboard has people asking follow up questions, you can just clone the report to kick-off an ad hoc exploration rather than switching tools and starting from scratch. If you have any questions, reach out to us at hi@modeanalytics.com—we love hearing from you!

