
Charts
Links in Big Number charts
Sparklines in Big Number charts
Bullet chart
Chart annotations
Chart heights
Choropleth map
Force-directed graph
Funnel chart
Geographic heat map
Google Maps with markers
Heat map
Hive plot
How to implement gallery examples using the HTML editor
Horizontal bar chart
Network matrix
Creating Chart Annotations using Matplotlib
Creating Histograms using Pandas
Creating Horizontal Bar Charts using Pandas
How to Create R Histograms & Stylize Data
Creating Horizontal Bar Charts using R
State choropleth map
Sunburst chart
Word cloud
World choropleth map
Zipcode choropleth map
How to implement gallery examples using the HTML editor
The Mode example gallery features a variety of customizations you can apply to Mode charts, tables, and reports by editing the HTML. While you can customize the entirety of a Mode report—just like coding a web page—these examples provide quick wins for common modifications. We hope these examples provide inspiration for what's possible using the HTML editor.
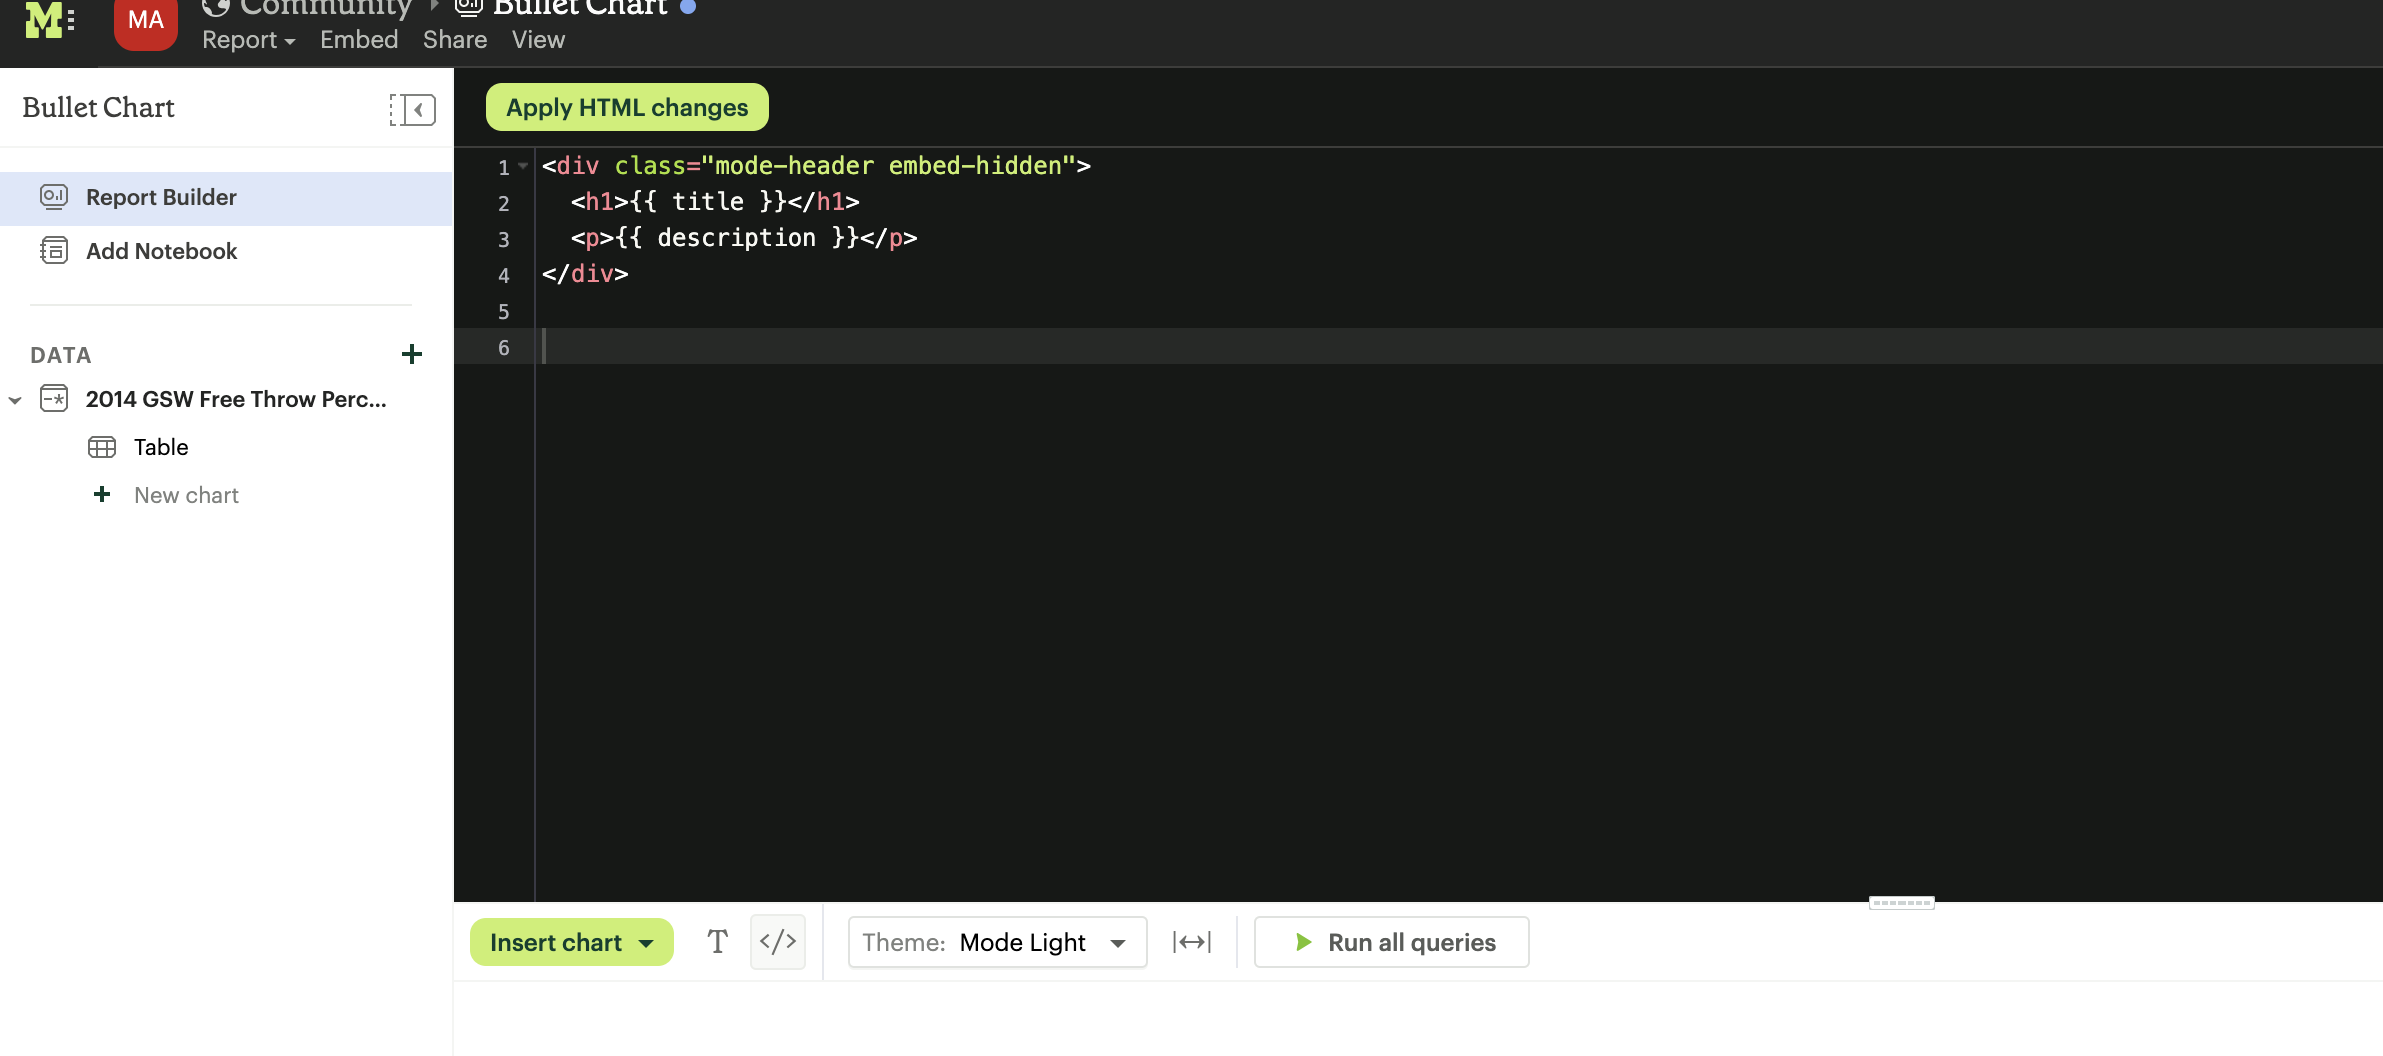
Step 1: Navigate to the HTML editor
Once you've run your SQL queries, click into the Report Builder and select “</>” to open the HTML editor.
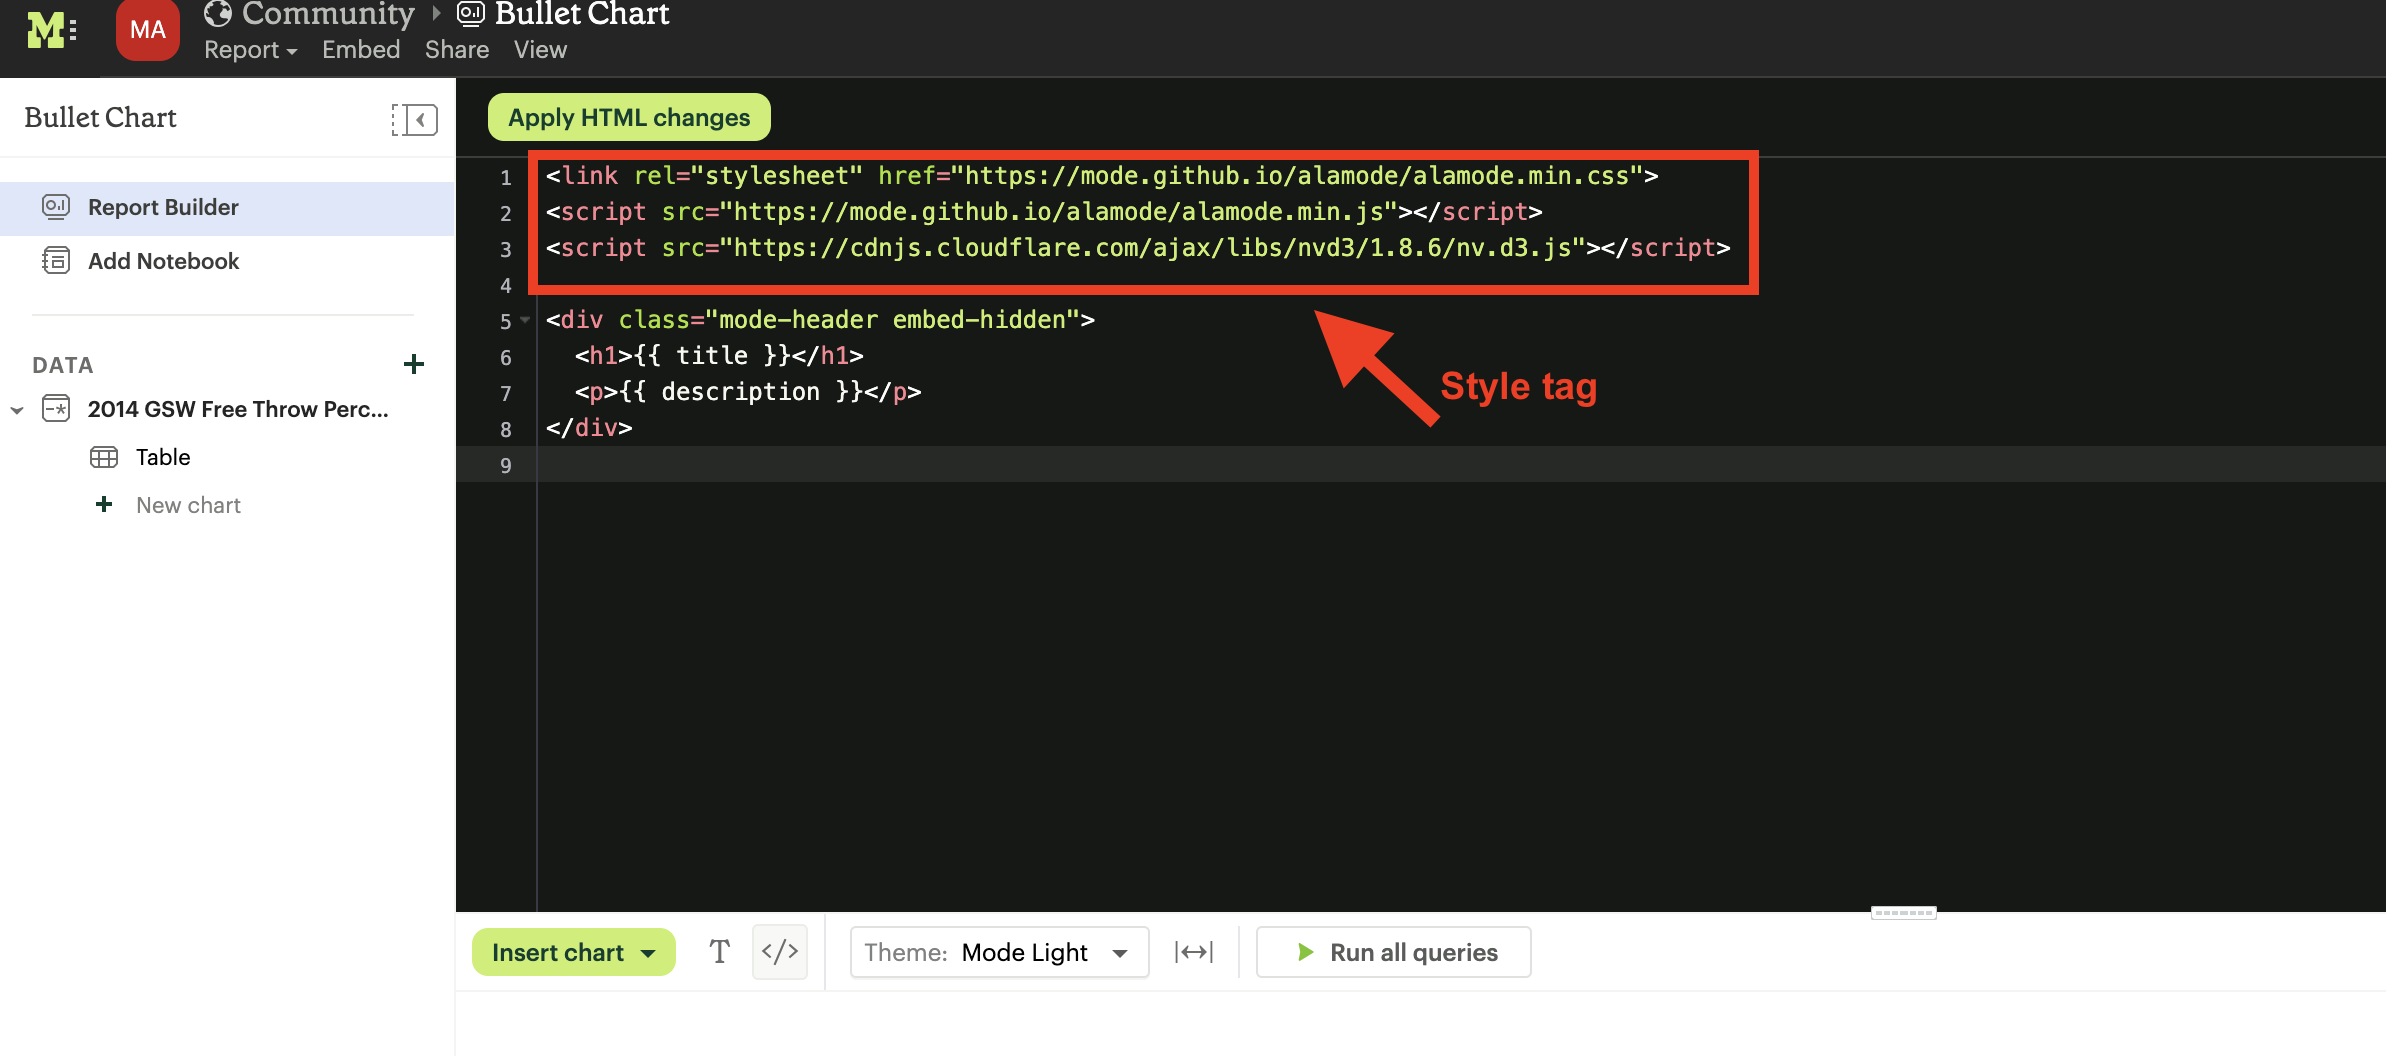
Step 2: Add the stylesheet and script tag
Mode hosts the lion's share of the custom HTML, CSS, and Javascript code need for these examples in a Github repository. Using it isn't required (leverage whichever Javascript libraries you like!), but it makes the specific modifications featured in the gallery faster to implement.
Start by adding this code to the very top:
<link rel="stylesheet" href="https://mode.github.io/alamode/alamode.min.css">
<script src="https://mode.github.io/alamode/alamode.min.js"></script>
<script src="https://cdnjs.cloudflare.com/ajax/libs/nvd3/1.8.6/nv.d3.js"></script>
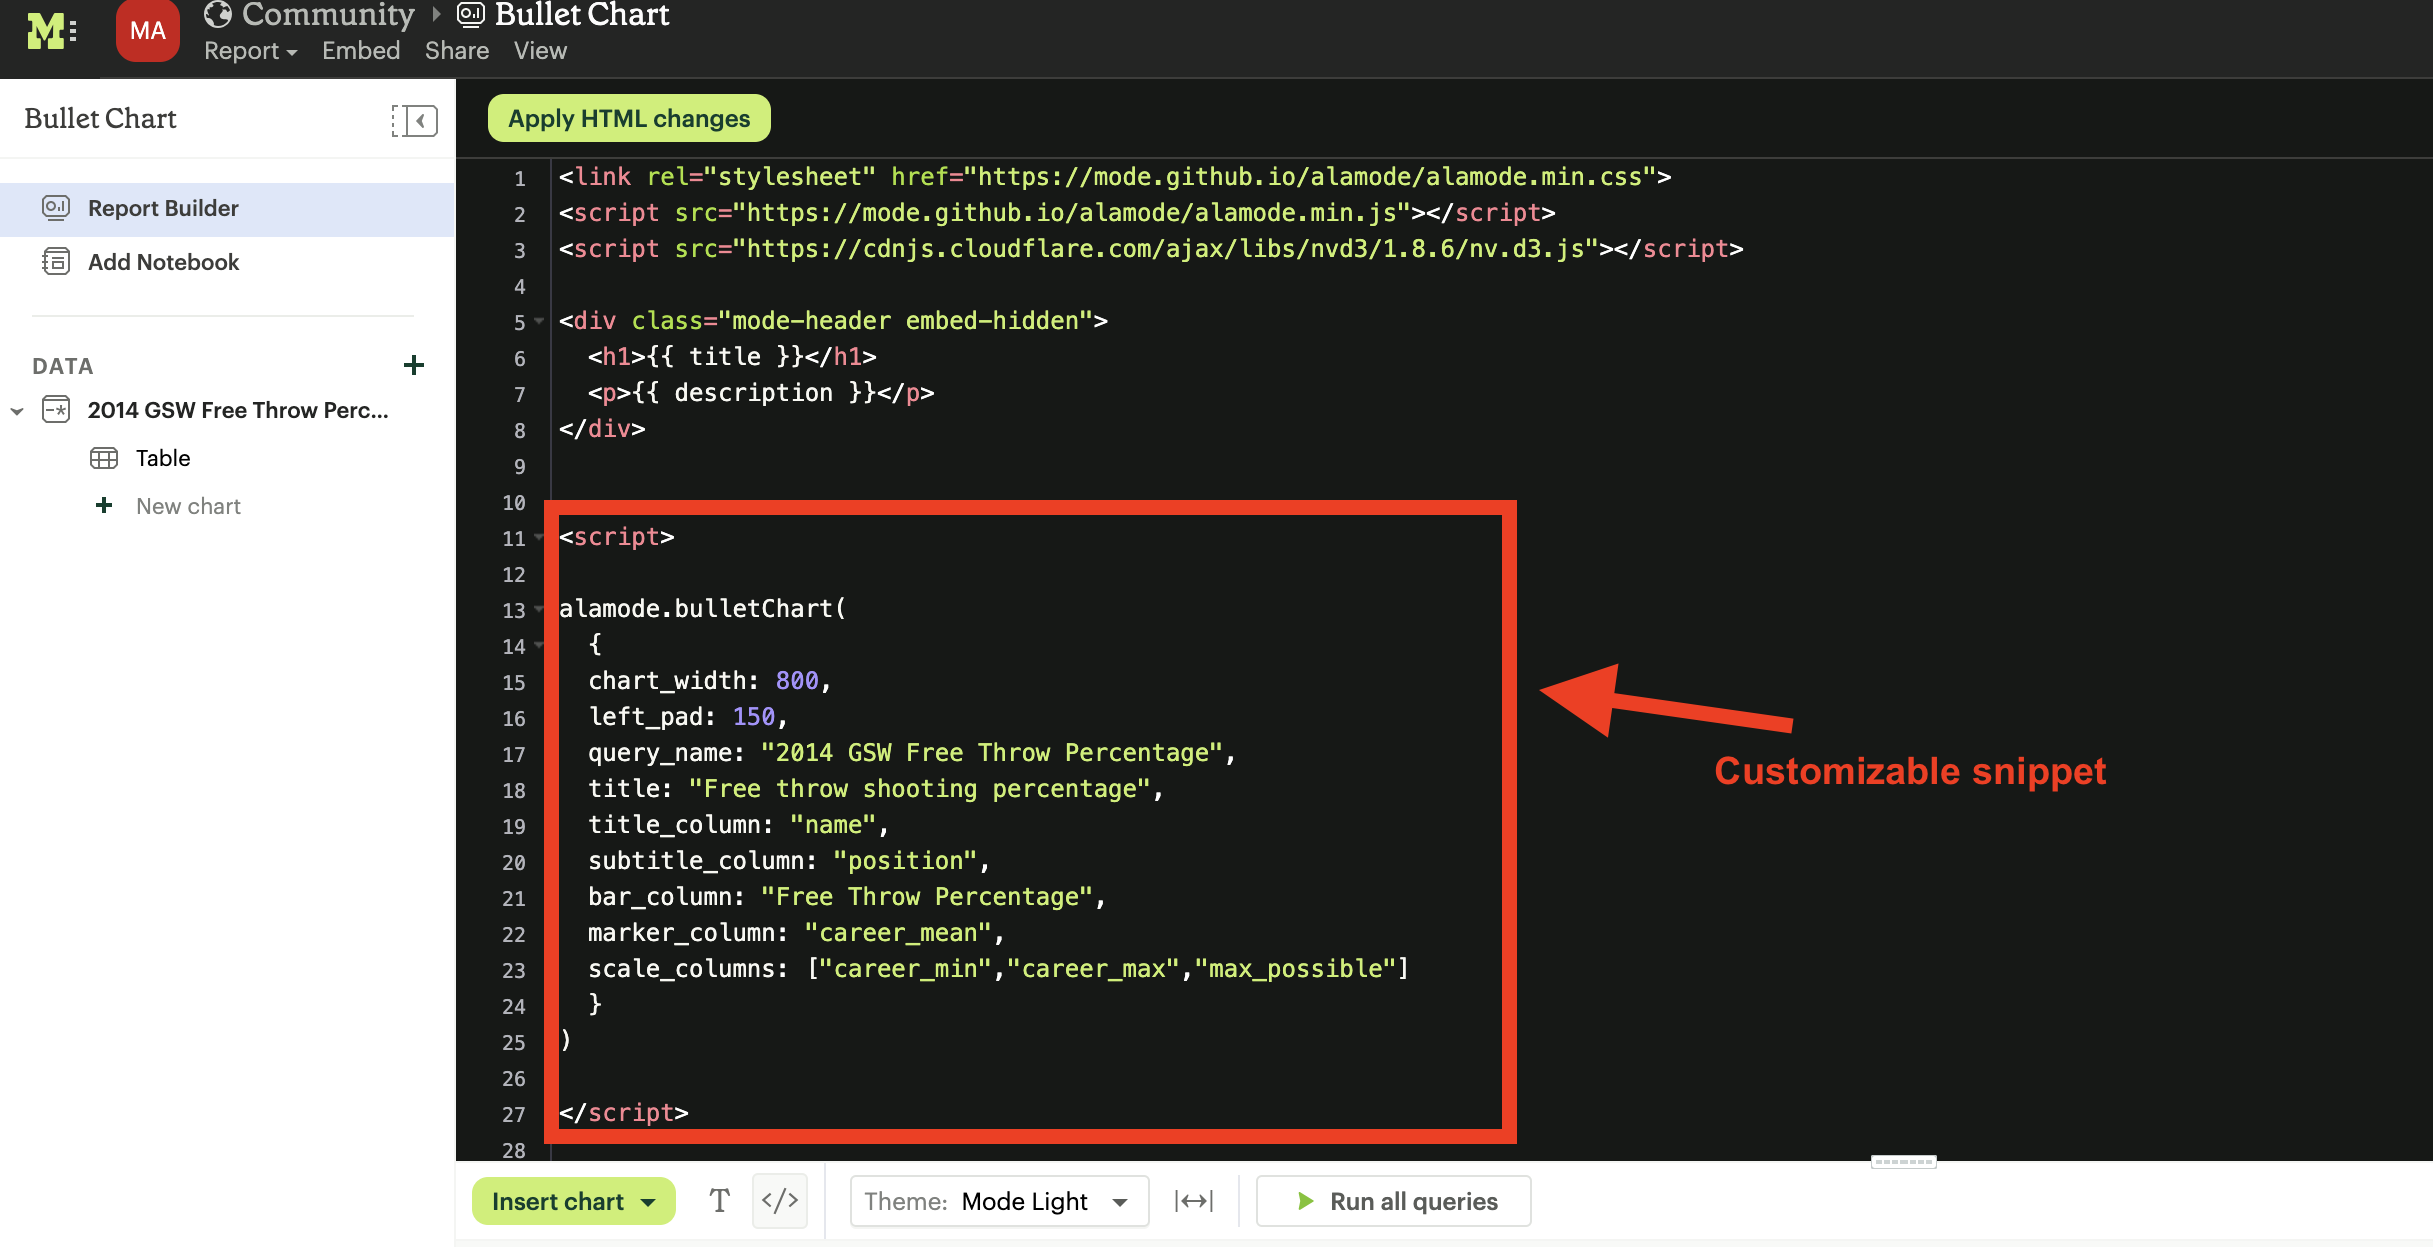
Step 3: Add the customizable snippet
The next step is to drop in the customizable snippet. This is the block of code that allows you to indicate specific preferences for colors, font styles, dimensions, etc. It's also where you'll make a few tweaks to point the code to your dataset.
Customizable snippet:
<script>

alamode.bulletChart(
  {
	chart_width: 800,
	left_pad: 150,
	query_name: "2014 GSW Free Throw Percentage",
	title: "Free throw shooting percentage",
	title_column: "name",
	subtitle_column: "position",
	bar_column: "Free Throw Percentage",
	marker_column: "career_mean",
	scale_columns: ["career_min","career_max","max_possible"]
  }
)

</script>
Step 4: Update the report
Click Apply HTML changes as you go to preview your work.
Share new customization ideas and your projects with the Mode community by emailing hi@modeanalytics.com or submit a pull request to the alamode.js repo on Github.