Charts
Links in Big Number charts
Sparklines in Big Number charts
Chart heights
Choropleth map
Bullet chart
Force-directed graph
Chart annotations
Funnel chart
Geographic heat map
Google Maps with markers
Heat map
Hive plot
Horizontal bar chart
How to implement gallery examples using the HTML editor
Network matrix
Creating Chart Annotations using Matplotlib
Creating Histograms using Pandas
Creating Horizontal Bar Charts using Pandas
How to Create R Histograms & Stylize Data
Creating Horizontal Bar Charts using R
State choropleth map
Sunburst chart
Word cloud
World choropleth map
Zipcode choropleth map
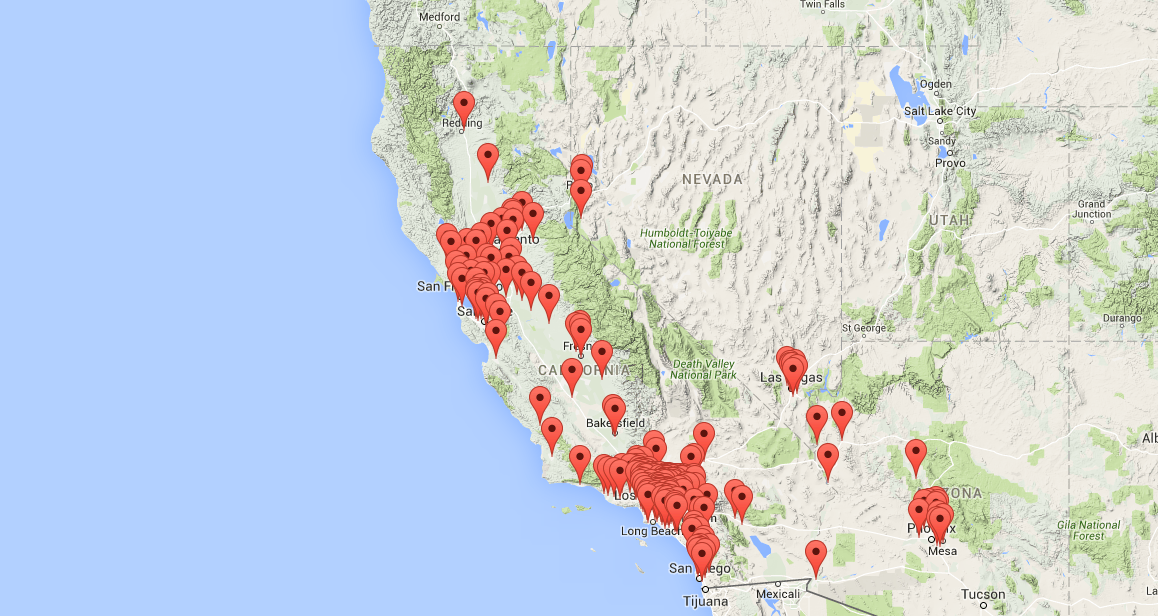
Google Maps with markers
Pinning locations using Google Maps visually ties your geo-data to specific addresses.
The example below shows a Google map with markers indicating In-N-Out locations.

*Learn more about using HTML to customize your reports.
Create a Google Map with markers
Add the stylesheet link and script tag to the top of the HTML:
<link rel="stylesheet" href="https://mode.github.io/alamode/alamode.min.css">
<script src="https://mode.github.io/alamode/alamode.min.js"></script>
Add the customizable snippet at the bottom of the HTML:
<script>

alamode.googleMap(
  {
  	  google_maps_api_key: "YOUR_API_KEY",
	  title: "In-n-Out locations",
	  lat_column: "lat",
	  lng_column: "long",
	  label_column: "city",
	  query_name: "Query 1",
	  center_lat: 36.75,
	  center_lng: -119.77,
	  starting_zoom: 6,
	  map_type: "terrain",
	  height: 600
  }
)

</script>
You can customize the map by editing the parameters in the snippet:
html_element: If not provided, the map will be added as the last element in the report. To place it elsewhere, select an element in your report with this parameter.google_maps_api_key: A required Google Maps Javascipt API key. You can create a free key by clicking on the Get a Key button on this page.title: The map's title.lat_column: The dataset column that returns latitude vaules.lng_column: The dataset column that returns longitude vaules.label_column: The dataset column that returns the label values for each map marker.query_name: The name of the query that returns the map's dataset. If you update the name of the query, you’ll need to update it here as well.center_lat: The default center latitude value for the map.center_lng: The default center longitude value for the map.starting_zoom: The default zoom. Typically ranges from 1 to 18. The higher the value, the greater the zoom.map_type: The default map type. You can find more about available types here.height: Height of the chart in pixels.