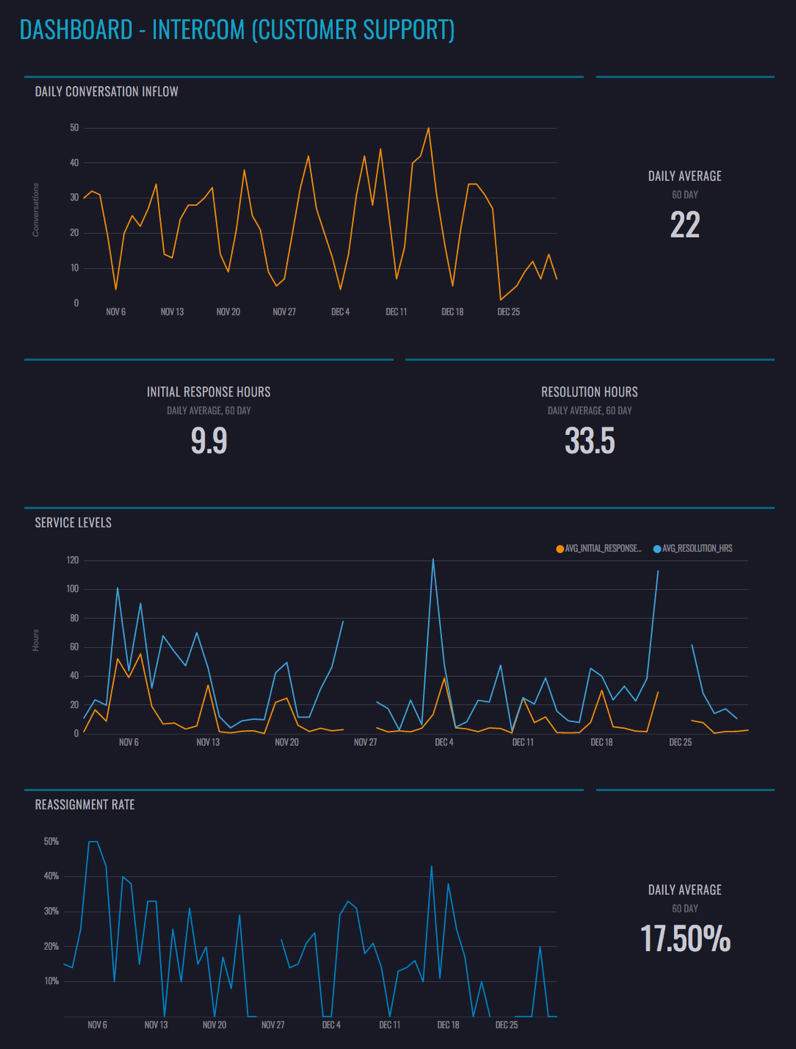
Intercom dashboard
We've made it easy to create a dashboard of your Intercom customer support data in Mode, surfacing insights into daily conversation volumes, service levels, and reassignment rates. Follow these steps to generate a report like the one below using your own data.
 See the Mode report
Create a “Daily Support” Definition
Mode Definitions are saved SELECT statements that you can reference in queries throughout the platform. The Intercom Customer Support Dashboard uses a Definition called @daily_support
Postgres:
WITH

  day AS (
    SELECT time_id
      FROM demo.rollup_periods
     WHERE period_id = 1
       AND time_id BETWEEN '2016-01-01' AND CURRENT_DATE
          ),

  conversations AS (
    SELECT DATE_TRUNC('day',c.created_at AT TIME ZONE 'America/Los_Angeles') AS time_id,
           COUNT(c.id) AS new_conversations,
           COUNT(r.id) AS reassigned_conversations,
           ROUND(AVG(EXTRACT('epoch' FROM ir.initial_response_at - c.created_at) / 60)::numeric,0) AS avg_irt_min,
           ROUND(AVG(EXTRACT('epoch' FROM ir.resolution_at - c.created_at) / 60)::numeric,0) AS avg_resolution_min
      FROM demo.intercom_conversations  c
      LEFT JOIN (
    SELECT p.conversation_id,
           MIN(p.created_at) as initial_response_at,
           MIN(CASE WHEN p.part_type = 'close' THEN p.created_at ELSE NULL END) AS resolution_at
      FROM demo.intercom_conversation_parts p
     WHERE p.author_type = 'admin'
       AND p.part_type NOT IN ('note','assignment')
  GROUP BY 1
           ) ir
        ON ir.conversation_id = c.id
      LEFT JOIN (
    SELECT DISTINCT c.id
      FROM demo.intercom_conversations  c
      JOIN demo.intercom_conversation_parts p1
        ON c.id = p1.conversation_id
      JOIN demo.intercom_conversation_parts p2
        ON c.id = p2.conversation_id
       AND p1.assigned_to_id != p2.assigned_to_id
           ) r
        ON c.id = r.id
     WHERE c.message_author_type = 'user'
  GROUP BY 1
      ),

  conversation_parts AS (
    SELECT DATE_TRUNC('day',p.created_at AT TIME ZONE 'America/Los_Angeles') AS time_id,
           COUNT(DISTINCT CASE WHEN p.author_type = 'user' THEN p.conversation_id ELSE NULL END) AS inflow,
           COUNT(DISTINCT CASE WHEN p.author_type = 'admin' THEN p.conversation_id ELSE NULL END) AS outflow
      FROM demo.intercom_conversation_parts p
      JOIN demo.intercom_conversations  c
        ON c.id = p.conversation_id
  GROUP BY 1
      )

    SELECT day.time_id,
           COALESCE(conversation_parts.inflow,0) AS conversation_inflow,
           COALESCE(conversation_parts.outflow,0) AS conversation_outflow,
           COALESCE(conversations.new_conversations,0) AS new_conversations,
           COALESCE(conversations.reassigned_conversations,0) AS reassigned_conversations,
           conversations.avg_irt_min / 60 AS avg_initial_response_hrs,
           conversations.avg_resolution_min / 60 AS avg_resolution_hrs,
           ROUND(COALESCE(conversations.reassigned_conversations,0) / conversations.new_conversations::NUMERIC,2) AS reassignment_rate
      FROM day
      LEFT JOIN conversations
        ON day.time_id = conversations.time_id
      LEFT JOIN conversation_parts
        ON day.time_id = conversation_parts.time_id
     ORDER BY 1 DESC
Redshift:
WITH

  day AS (
    SELECT time_id
      FROM demo.rollup_periods
     WHERE period_id = 1
       AND time_id BETWEEN '2016-01-01' AND CURRENT_DATE
          ),

  conversations AS (
    SELECT DATE_TRUNC('day',CONVERT_TIMEZONE('America/Los_Angeles',c.created_at)) AS time_id,
           COUNT(c.id) AS new_conversations,
           COUNT(r.id) AS reassigned_conversations,
           AVG(DATEDIFF('MINUTE', c.created_at, ir.initial_response_at)) AS avg_irt_min,
           AVG(DATEDIFF('MINUTE', c.created_at, ir.resolution_at)) AS avg_resolution_min
      FROM intercom.conversations c
      LEFT JOIN (
    SELECT p.conversation_id,
           MIN(p.created_at) as initial_response_at,
           MIN(CASE WHEN p.part_type = 'close' THEN p.created_at ELSE NULL END) as resolution_at
      FROM intercom.conversation_parts p
     WHERE p.author_type = 'admin'
       AND p.part_type NOT IN ('note','assignment')
  GROUP BY 1
           ) ir
        ON ir.conversation_id = c.id
      LEFT JOIN (
    SELECT DISTINCT c.id
      FROM intercom.conversations c
      JOIN intercom.conversation_parts p1
        ON c.id = p1.conversation_id
      JOIN intercom.conversation_parts p2
        ON c.id = p2.conversation_id
       AND p1.assigned_to_id != p2.assigned_to_id
           ) r
        ON c.id = r.id
     WHERE c.message_author_type = 'user'
  GROUP BY 1
      ),

  conversation_parts AS (
    SELECT DATE_TRUNC('day',CONVERT_TIMEZONE('America/Los_Angeles',p.created_at)) AS time_id,
           COUNT(DISTINCT CASE WHEN p.author_type = 'user' THEN p.conversation_id ELSE NULL END) AS inflow,
           COUNT(DISTINCT CASE WHEN p.author_type = 'admin' THEN p.conversation_id ELSE NULL END) AS outflow
      FROM intercom.conversation_parts p
      JOIN intercom.conversations c
        ON c.id = p.conversation_id
  GROUP BY 1
      )

    SELECT day.time_id,
           COALESCE(conversation_parts.inflow,0) AS conversation_inflow,
           COALESCE(conversation_parts.outflow,0) AS conversation_outflow,
           COALESCE(conversations.new_conversations,0) AS new_conversations,
           COALESCE(conversations.reassigned_conversations,0) AS reassigned_conversations,
           conversations.avg_irt_min / 60 AS avg_initial_response_hrs,
           conversations.avg_resolution_min / 60 AS avg_resolution_hrs,
           ROUND(COALESCE(conversations.reassigned_conversations,0) / conversations.new_conversations::NUMERIC,2) AS reassignment_rate
      FROM day
      LEFT JOIN conversations
        ON day.time_id = conversations.time_id
      LEFT JOIN conversation_parts
        ON day.time_id = conversation_parts.time_id
     ORDER BY 1 DESC
Create a Definition on your data source using the above code. Note that you'll need to update the demo. schema to match how it appears in your data source.
Intercom data typically syncs into a data warehouse with a table for intercom.conversation_parts and intercom.conversations. This Definition also uses a rollup table called demo.rollup_periods which has a record for every day. If you don't have a rollup table, you can substitute any other table in your data source that will have a timestamp column with at least one record per day.
Duplicate the Dashboard
Once you have the Definition set up, duplicate the dashboard by clicking “Duplicate” at the top. Once in the Editor, be sure to switch from the “Mode Public Warehouse” to your connected database. Then click run. When you click into the Report Builder, the dashboard will be ready and waiting, with your customer support data. Be sure to set a schedule so this dashboard refreshes each morning, and choose how you would like to distribute it to the team (via Slack, email, or embed, or present it on a TV).
Optional: Apply Report Theme
You can brand your dashboard using Mode themes. This report uses Mode Subway theme, but feel free to update it to your preferred look. Customers on the Plus Plan can also create custom themes to keep the dashboard on brand.
Other Ways to analyze Intercom data
This dashboard is just the beginning of different ways you can analyze your Intercom customer support data in Mode. Using Mode's Python notebook, create a customer support forecast. Join the @daily_support definition with your product data to understand what product events generate support conversations. Identify seasonal patterns and plan accordingly.