
Mode Help
Query and analyze data
Visualization filters
Overview
Filtering is an essential step in your analysis workflow, and it is a powerful and easy way to see different cuts of your data. Now with Helix, you can easily load millions of rows of raw data and filter on top of your large dataset.
Report vs visualization filters
There are two types of filters in Mode:
- Report-level filters: These are filters that you create from the Report Builder and apply to all charts in your report. Generally, you create these for your report viewers to be able to filter data themselves. For more information on report filters, refer to this section in our Reports page.
- Visualization-level filters: These are filters that you create from the Chart Editor and apply only to that one chart. Report viewers will not see the visualization filters that you’ve applied. Generally, you create these to filter data completely from view.
Getting started
Once you have your dataset and have created a visualization, you can add and apply visualization filters.
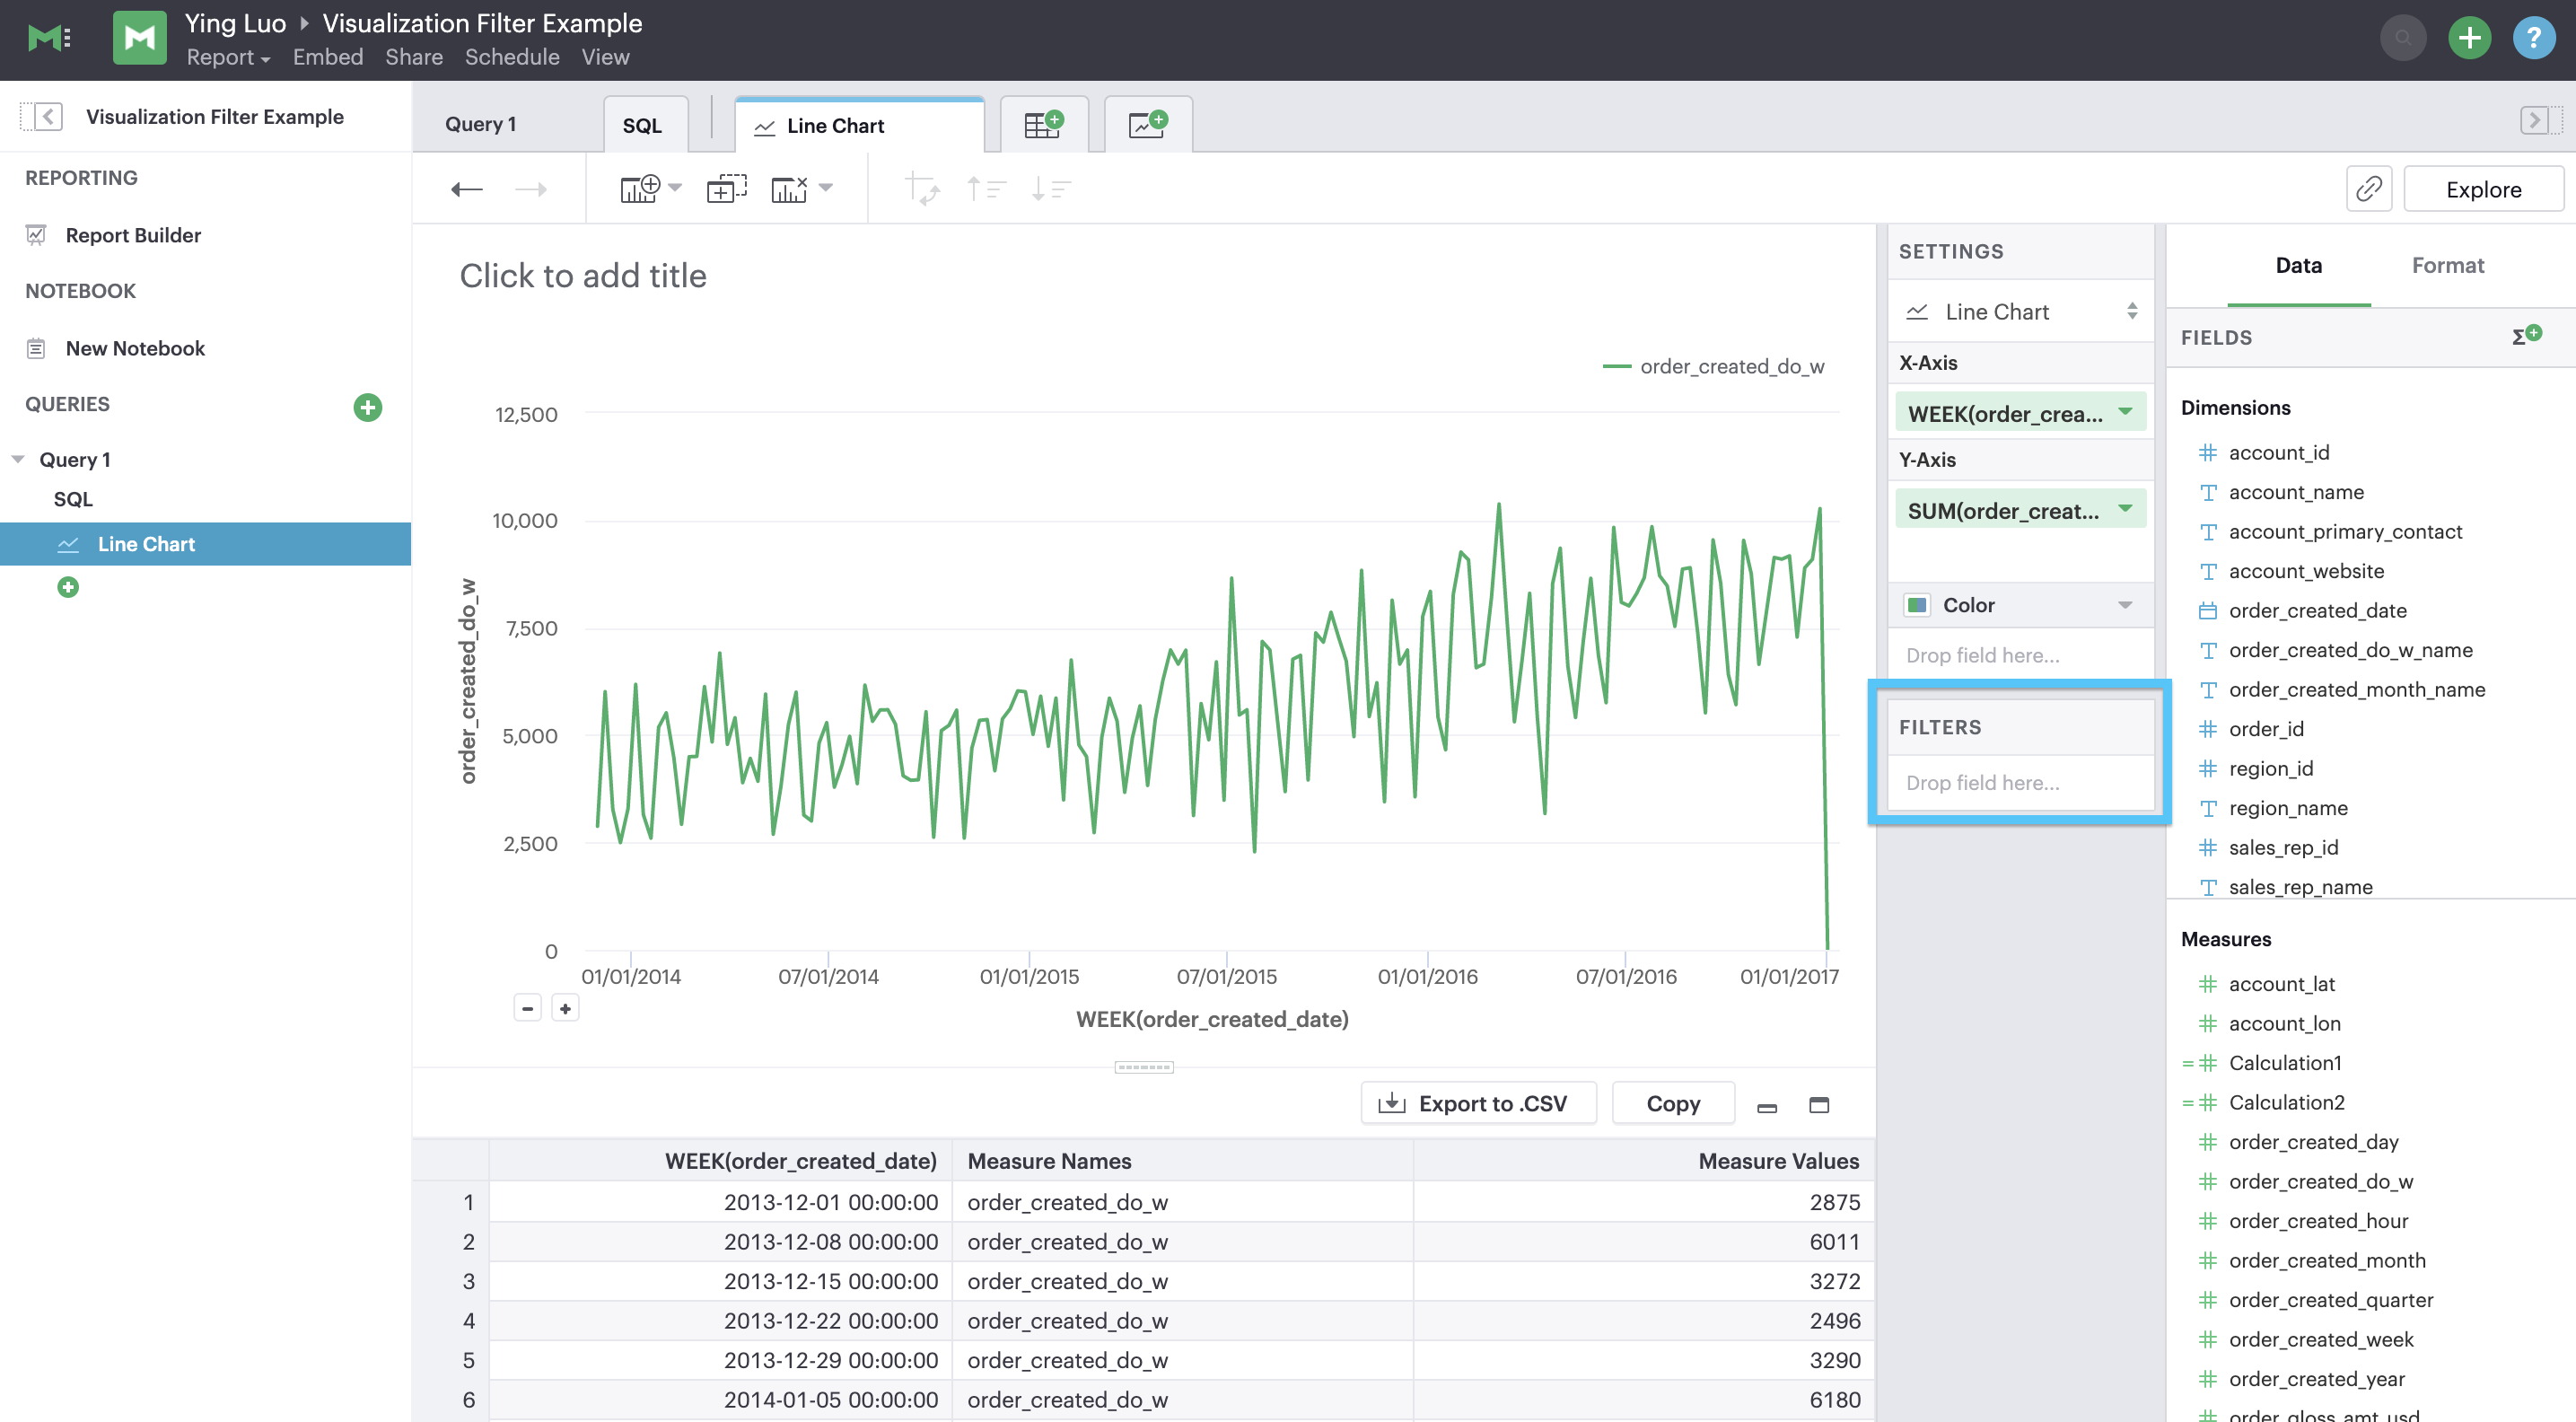
- Drag and drop the field that you want to filter on into the Filters dropzone, highlighted above.
- Depending on the datatype of your field (i.e. if it’s timestamp or numeric), you may now see a modal pop-up appear that asks how you’d like to filter that field.
- Once you’ve configured the values that you want to include or exclude, hit
Applyso that the changes will reflect in your visualization.
Congratulations! You’ve created a visualization filter. There should now be a field pill in the Filters dropzone.
Filter types
There are different filter options depending on the datatype of the field chosen to filter on.
| Field Data Type | List | Range | Top/Bottom N |
|---|---|---|---|
| String | X | N/A | X |
| Datetime | X | X | X |
| Numeric | X | X | X |
| Boolean | X | N/A | N/A |
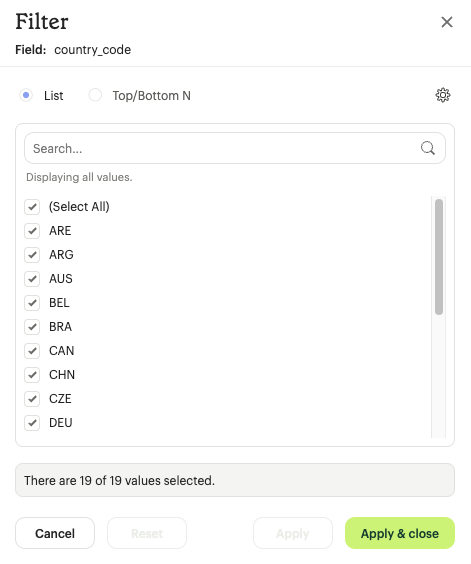
Filter from List
The simplest way to filter is from the list of field values. When working with fields with more distinct values, the type ahead search can help you to find your desired value(s) quickly. If there are rows in your data without a value for this field, that record will be represented in the list as Null.
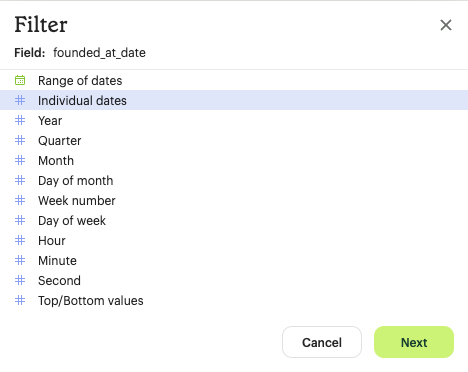
For timestamp fields, you can select either from a list of full datetime values or from a discrete list of date part values (like year or month) extracted from your field values.
Mode has two ways to interpret a filter list of values:
- Include values: You can check values that you want to include in your visualization and uncheck values that you do not want to include. This is the default pattern.
- Exclude values: You can exclude selected values by checking this option in the settings gear icon. When enabled, all checked values are now explicitly excluded from this visualization.
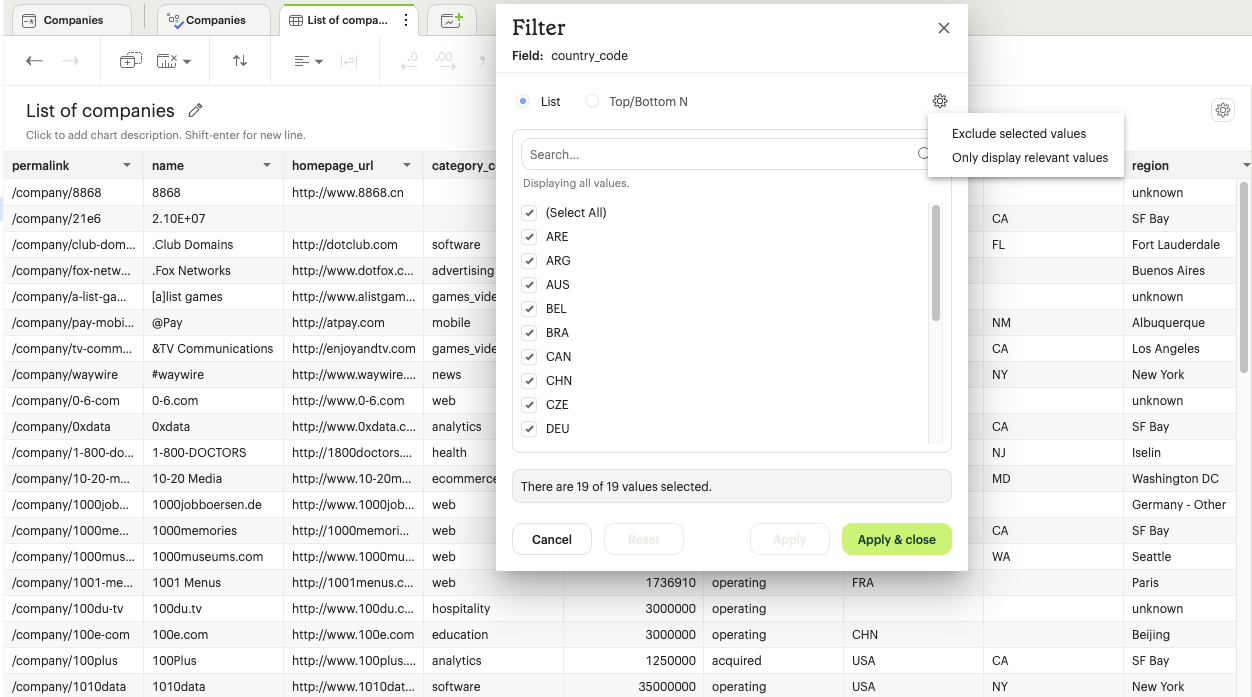
As new values appear in your field in the future, an exclude filter will allow these new values though. Filters that include values limit the visualization’s data to a set of selected values. This means new field values must be added manually to include filter list selection.
Mode recommends setting up filter lists as either exclude or include to keep the list as short as possible for easier maintenance overtime. Long filter lists are also detrimental to chart rendering performance, so exclude filters are an important tool!
The "Display relevant values" functionality in visualization filters enhances the data exploration experience by dynamically displaying only the most pertinent values based on previously applied filters. This option is available for list filters of any data type. This functionality can be enabled by checking the “Display relevant values” option in the settings gear icon. The filter value list will dynamically adjust to display only the most relevant values based on previously applied filters. Irrelevant values will be automatically hidden. This setting can be turned off by unchecking this option in the settings gear icon, which will result in the filter value list reverting to displaying all available values in the underlying dataset.
Range
Numerical range filters
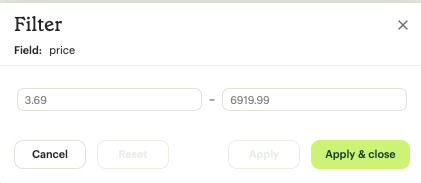
Range filters allow you to limit a numeric field in the visualization by setting optional start and/or end values to create an inclusive range.
By default, Mode’s range filters will show the minimum & maximum values in your data as shadow text. However, range filters do not require both start & end values.
If there is no end value provided, the filter will act as a “at least x value” filter for the start value x. Equivalently, if there is no start value provided, the filter will act as a “at most y value” for the end value y.
Date range filters
There are two types of date range filters:
Fixed range of date filters allows users to define a specific start date and end date. By default, the fixed date range filter will be populated with the minimum & maximum values in the data. For open-ended ranges, "No set start/end date" needs to be chosen from the “from” and “to” dropdown. For example:
- To apply an “after x date” filter, the “no set end date” option needs to be chosen from the “to” dropdown.
- To apply a “before y date” filter, the “no set start date” option needs to be chosen from the “from” dropdown.
Relative range of date filters allows users to specify date values that change relative to the present time Example: yesterday, last week, and last 2 months.
The structure of a relative date range filter consists of {From} {n} {interval} & {To} {n} {interval} options, where {n} represents an integer and {interval} denotes a time increment like days, weeks, months, or years. Example: To get last month’s data , set the "From" to "Start of Previous 1 month" and the "To" to "End of Previous 1 month," where {n} = 1 and {interval} = month.
- Commonly used relative date ranges are available as presets in the Period dropdown menu. Example: today, yesterday, last 7 days, month to date, etc. Other relative date ranges can be configured using the “custom” option.
- The "From" or "To" options can be unbounded or defined by a fixed date. Example: After March 2021 to End of Previous 1 year or up to last week
- When selecting weeks, quarters, or years as the time interval, the start of the interval can be customized to any day or month based on the chosen interval. The default start of the week is Sunday, while the default start of the quarter/year is January. Example: Last 2 weeks, with the week starting on Monday.
- The time intervals chosen for the "From" and "To" options do not have to be the same. Example: Year to date
Top/Bottom N
Mode also supports limiting a visualization to display a set of field values according to some aggregation. For instance, you might want to see the 5 most popular US states according to recent order volume.
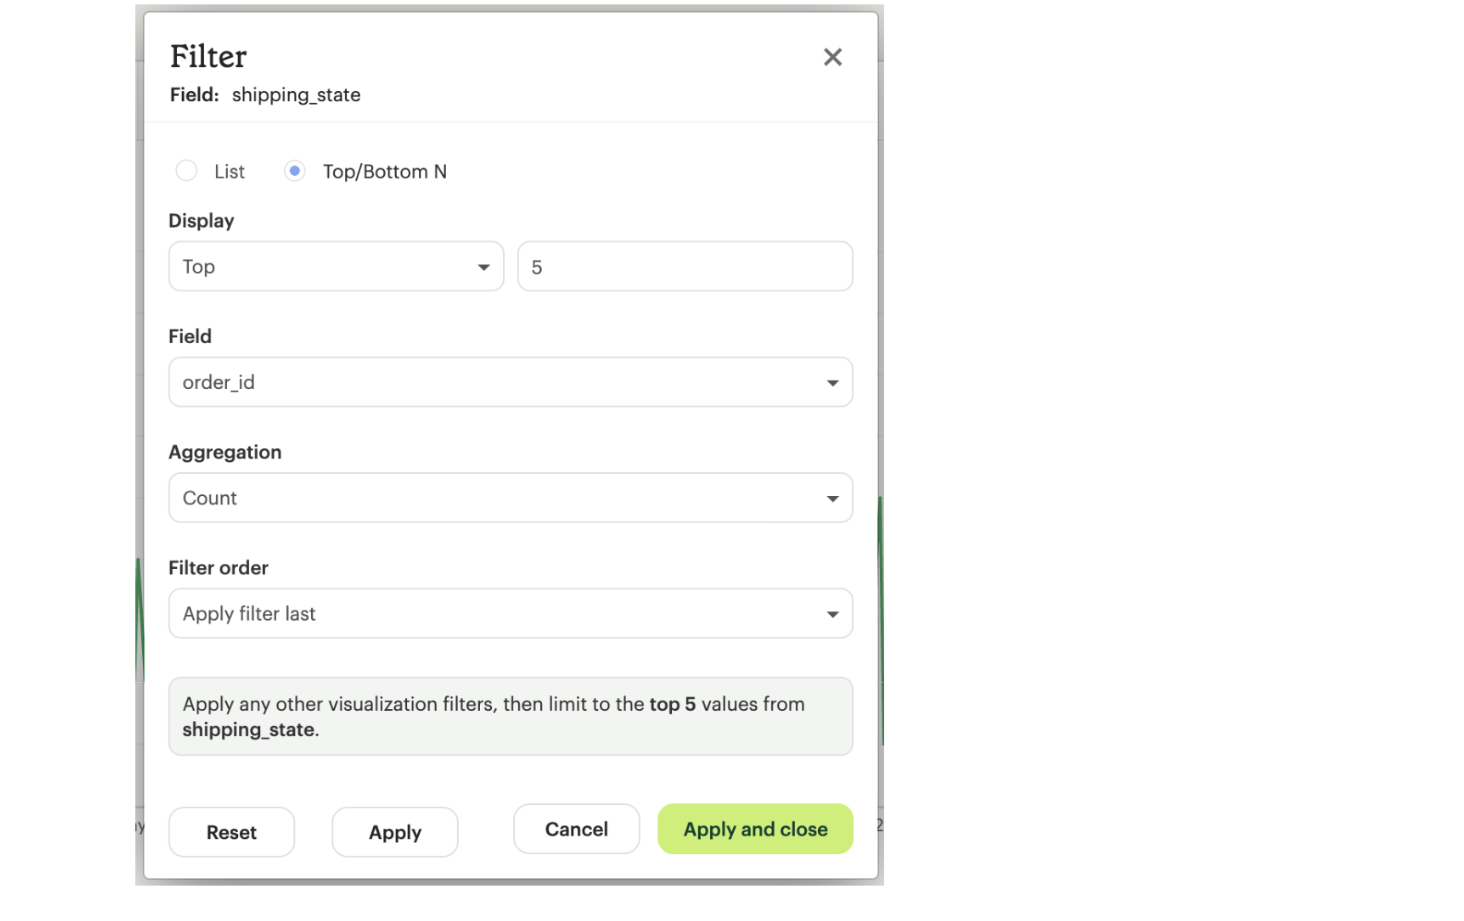
By default, this filter is applied after all other visualization filters. That ensures in the example above that the date recency filter is taken into account. Applying the filter first will ensure the global top/bottom of your data are considered, but after other visualization filters are applied, fewer than N values are often displayed.
FAQs
Q: Can you apply the Report View's Filters to Notebook generated visuals?
Mode's report filters only work with our native charts and tables.
However, you can leverage parameters for this case. When you select a parameter and run the report, the queries return values associated with the selected parameters. As a result, the Notebook and its visualizations will also be adjusted since the Notebook is purely powered by the query results.
Was this article helpful?