
Mode Help
Get started
Quick reference guide
We know, you're itching to get to the analysis. To help you and your team get started with Mode as quickly as possible, we've put together this checklist of first steps.
Create a Workspace
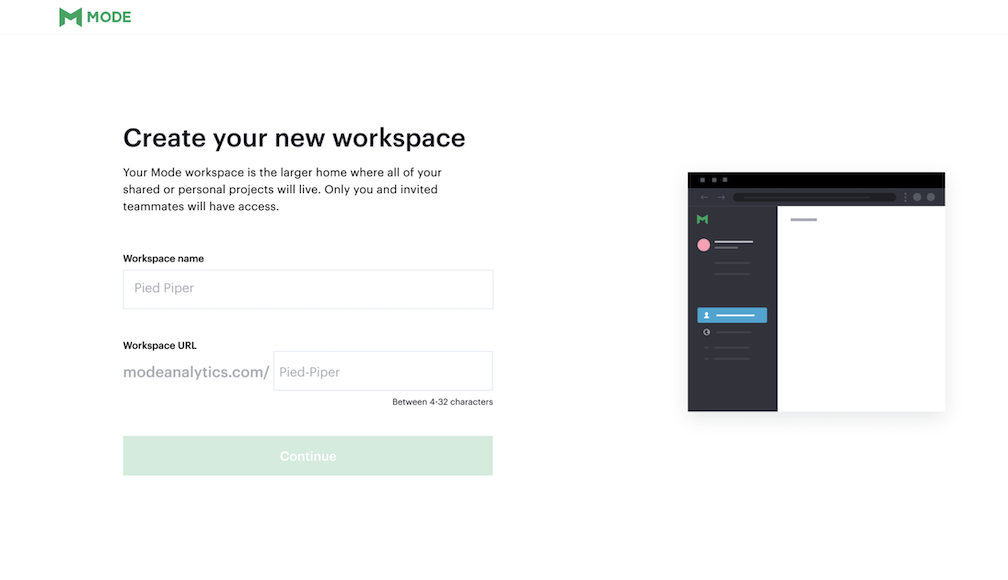
Workspaces are groups of Mode users that can securely share database connections and analysis with each other. You must create a Workspace to connect your own database to Mode.
When you create your user account, Mode will help you create a Workspace. If you skipped this step when you created your account and now want to go back and create a Workspace, start here. Once you have created a Workspace you can send anyone an invitation to join it so you can collaborate with them.
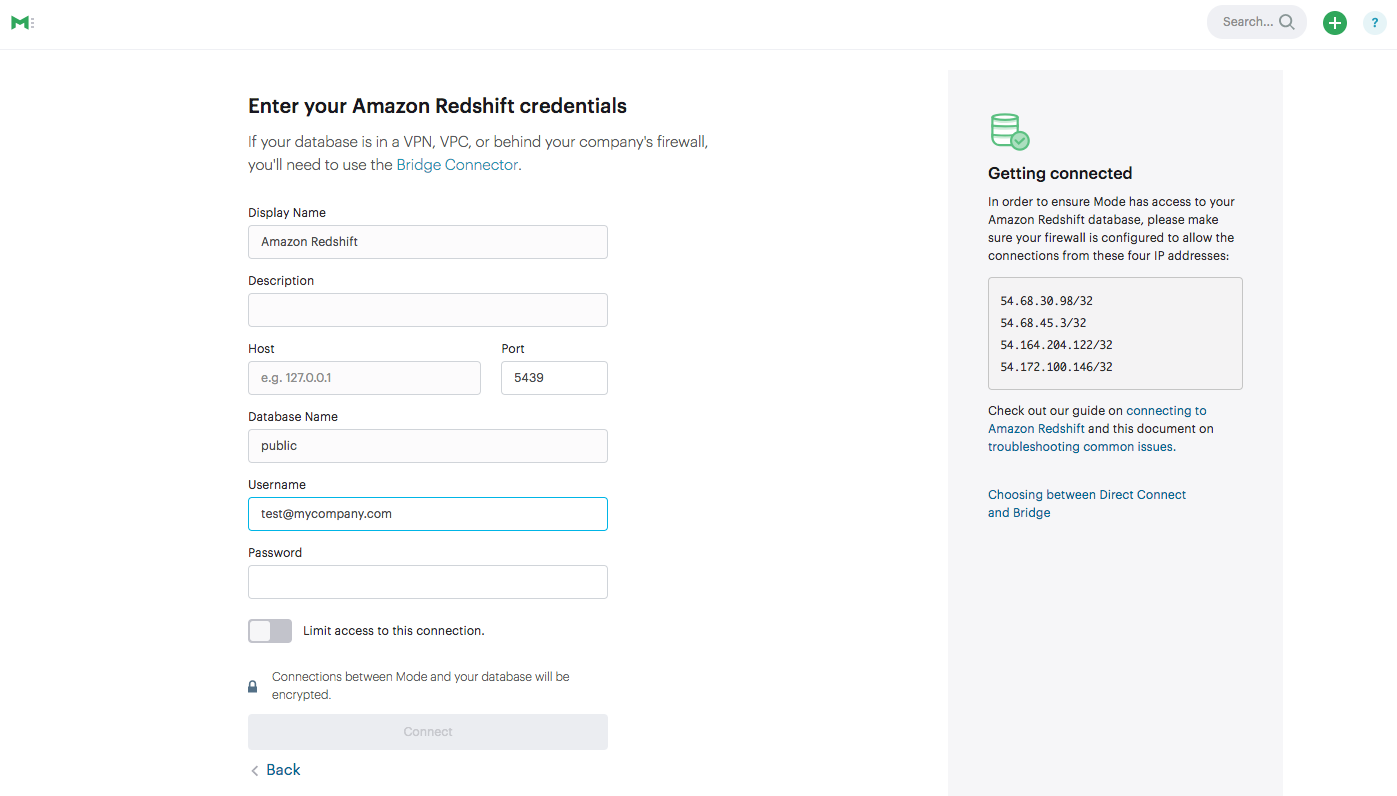
Connect a database
After creating a Workspace, you can connect one or more databases. Mode can connect to most popular SQL databases. Once you connect your data source, everyone in your Workspace can execute queries against it by default.
Invite collaborators
The easiest way to share reports, code and database query access with others is to invite them to your Mode Workspace. To send an invite, start from the Mode home page for your Workspace, click on your name in the upper left corner, and then click Invite to Mode.
Create analysis
The typical workflow for creating analysis in Mode mirrors the typical workflow of an analyst:
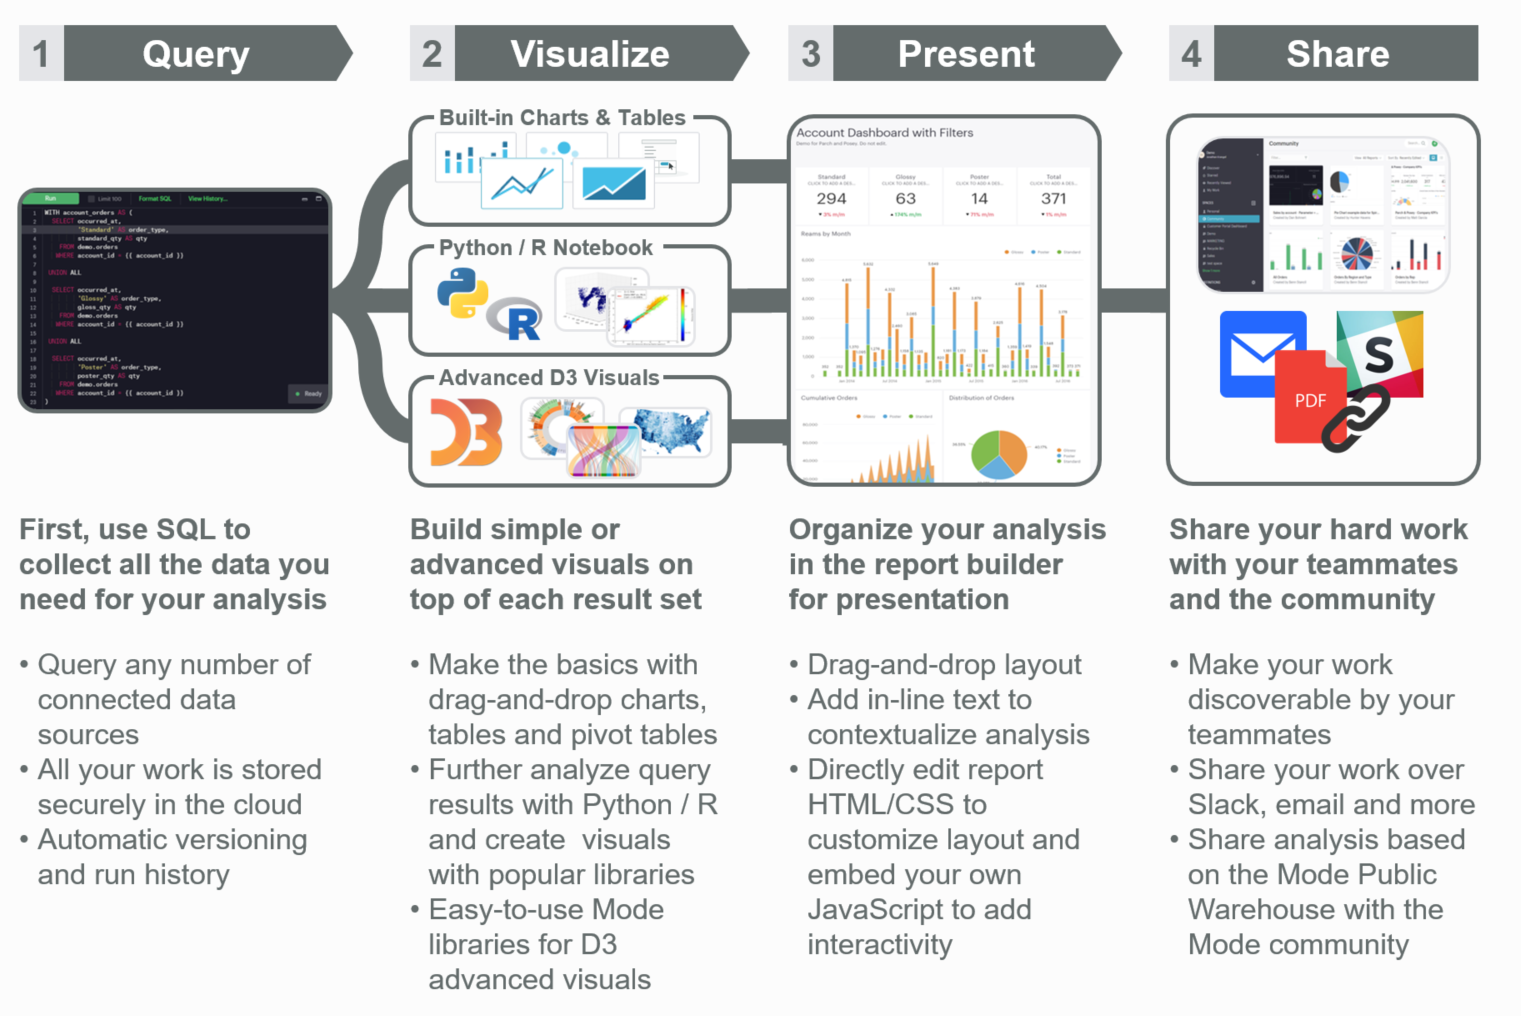
Query data
When creating an analysis, the first step is gathering and structuring all necessary data from one or more databases using SQL. To do this, you'll need to write and execute SQL code against one or more connected databases. In Mode, this is done within a report.
To create a new report, click the new report ![]() button in the upper right hand corner of the Mode home page, which will take you the Query Editor, where you can compose SQL code.
button in the upper right hand corner of the Mode home page, which will take you the Query Editor, where you can compose SQL code.
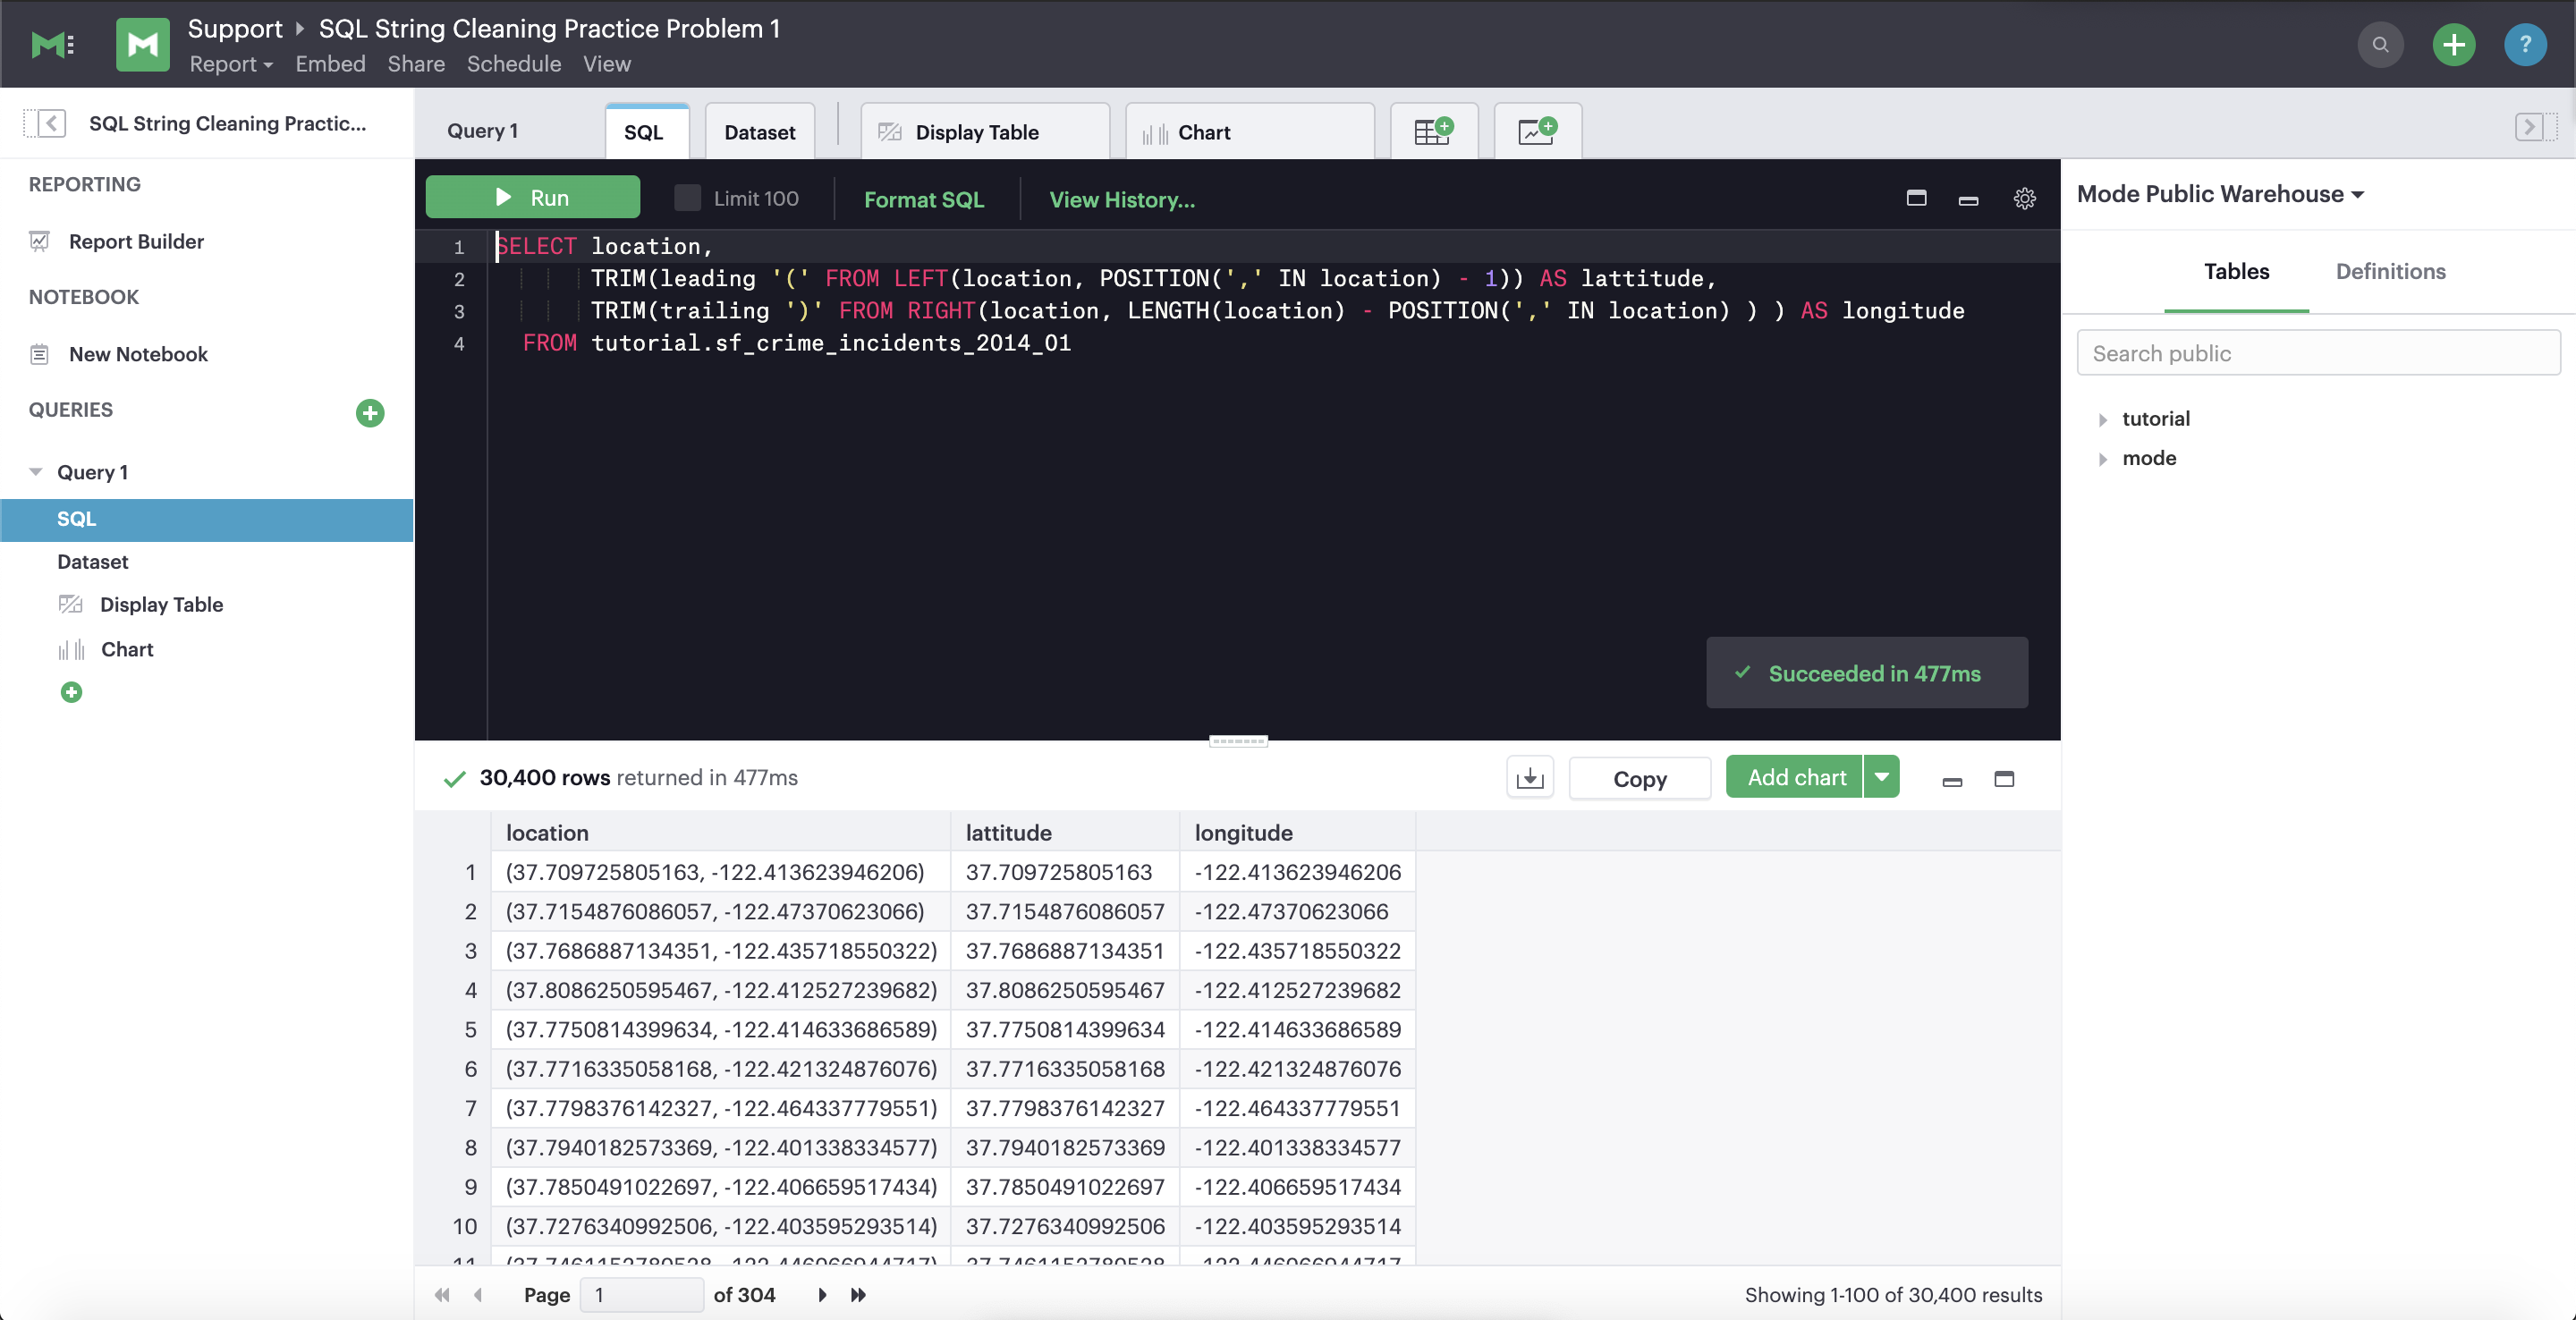
Visualize results
Once you've written a query or two and have some data to play with, click Report Builder in the left panel to begin curating components—data tables, charts, or Notebook output cells—in a shareable report. Design the report layout however you like: pick the charts and tables you want to show, rearrange their order, and specify each element's size.
You can also click </> at the top of the Report Builder to modify the code behind the individual elements in your report or build something completely custom using CSS, HTML, JavaScript, D3, and much more. Check out the Mode gallery to see examples—the world is your oyster!
Share your work
Share your analysis with others. Mode makes it easy to share your work with other members of your Workspace, whether via email, Slack, or sending a URL.
When you share a report, viewers will be able to see the output of your work, including any visualizations, data tables, or code that went into creating it.
Was this article helpful?