Mode Help
Get started
Getting started with Mode
Mode's analyst-first approach uses familiar technologies like SQL, Python, and R in an interactive data science environment that modernizes traditional BI workflows. Whether you're in the final stages of the purchase decision-making process or about to implement Mode, this guide will give you specific, actionable information about how to get your entire organization using Mode's broad suite of capabilities.
IN THIS GUIDE, YOU’LL LEARN HOW TO:
- Start gaining quick and helpful insights into your data within 1 hour
- Connect Mode to your team’s most important SQL databases
- Build reports bringing together your data team and business users for fast, quality decisions
- Customize your analysis for impactful sharing & delightful presentation
- Organize reports for increased of use for all team members
- Scale your analytics to match the growth of your business
- How to get your entire organization using Mode’s broad suite of capabilities.
We’ll also walk through the typical implementation process, which starts with connection your data to Mode and inviting your first set of new users. Once users are provisioned, they’ll have familiar tools to perform analysis and share their insights across your organization with interactive reports and dashboards. Mode’s data analysis tools empower analysts and stakeholders to analyze the data and iterate on that process without requiring any additional code. Finally, the API will allow you to programmatically integrate Mode into all of your team’s processes.
Data access and user roles
Create a Workspace
After creating a Mode account, you'll need to create a Workspace to connect your databases and invite other users. A Workspace is a group of users that share secure database connections and analysis with one another. Once that's set up, database connections can then be configured. Mode connects to most popular SQL databases and does not require any data preparation prior to connection, further streamlining the implementation process.
Connect to a database
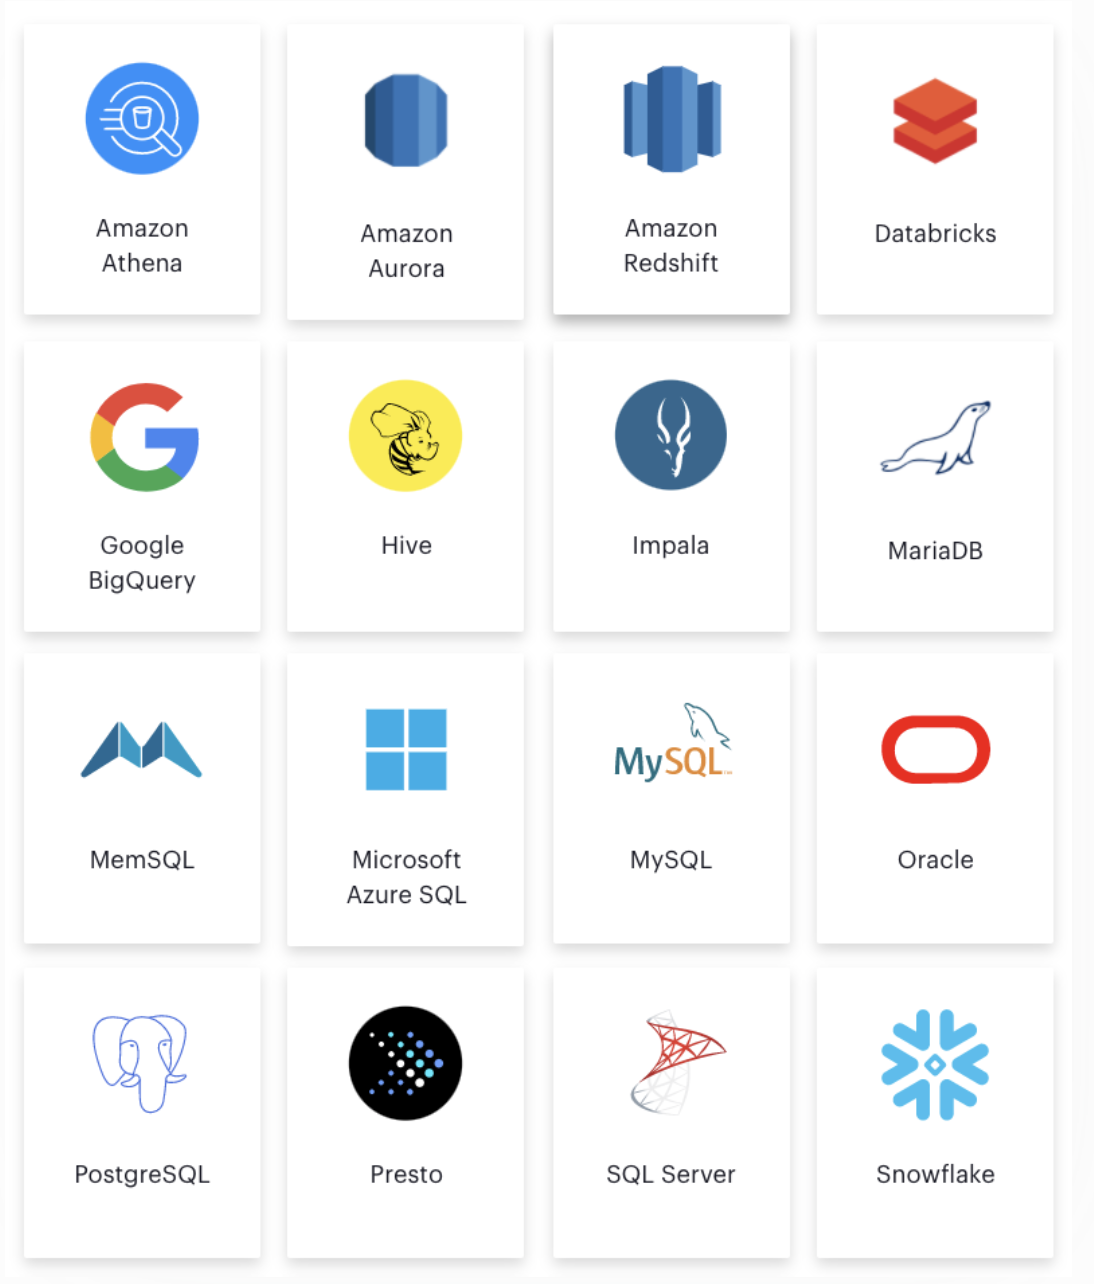
Mode can directly connect to many popular databases, all you have to do is simply enter the appropriate security credentials. A direct connection is easy to set up and does not require IT resources. If a database is behind a firewall or only accessed via VPN or VPCs, Mode supports a bridge connector option that’s easy to install, configure, and maintain. The bridge connector can run directly behind your organization’s VPN or firewall and once it’s installed, can be configured to securely connect to one or more of the databases within your company.

Provision users
After connecting a database, you can invite users and give them access to perform their analysis or administrative tasks.
An Admin user is necessary for managing user and group configurations. They can also establish database connections. We recommend granting several users with Admin privileges.
Once a user has been made an Admin, they can perform actions such as:
- Invite new members
- Grant/remove Admin access for other users
- Restrict report visibility and access
- Create and manage user groups
- Manage sign-in methods including custom SAML identity providers
- Share and embed functions for the Workspace
- Integrate with other applications such as Slack
To get users onboarded quickly, an Admin should manage basic user setup and configure access. There is no need to start by creating complex security policies. With Mode, you can build more security policies in the future if needed. When adding users, there is no requirement to configure a unique user “role.” All users will have the ability to create interactive reports using SQL, Python, or R.
Compare Mode’s user role capabilities to a company that is not using Mode. While a data scientist might have access to a server to write SQL and run Python and R code in a notebook environment, a citizen data analyst would not initially be able to access the same environment and thus, leverage the queries or other code developed by the data scientist. The analyst must wait for the data scientist or database administrator to give them the appropriate data access.
In contrast, with Mode, all users are empowered to share and create by default. This feature is just one example of how Mode enables the citizen data analyst to get data access and gain insight in under an hour.
Create Collections
With Mode’s user and sharing models, all users have access to existing reporting assets through Collections. A user can use their personal Collection to keep track of their work. When they are ready to share the analysis with another team, they can make the results available in an open Collection or share it privately with a specific group of users.
Using shared private Collections, your team can keep reports organized, grouping them by project, department, quarter, or data source.
Data and user checklists
The following are some key user-related items to think about before implementing Mode:
- Which database do you want to connect with Mode first?
- For this database, what connector and credentials are needed?
- Who will be the Admin users?
- Which users will we invite?
Analyzing data
Now that the databases are connected to your Mode Workspace and users are set up, they can begin creating reports.
In Mode, all analysis and dashboards start as reports that you can build using familiar tools—SQL, Python, and R. Mode also includes some improvements to these tools that enhance the overall experience of analyzing data and sharing reports. Onboarding users that are new to SQL or just want to brush up on your SQL or Python skills? Check out our in-depth SQL and Python Tutorials.
Of course, the starting point for the analysis process is the SQL Editor, so let’s start there.
SQL editor
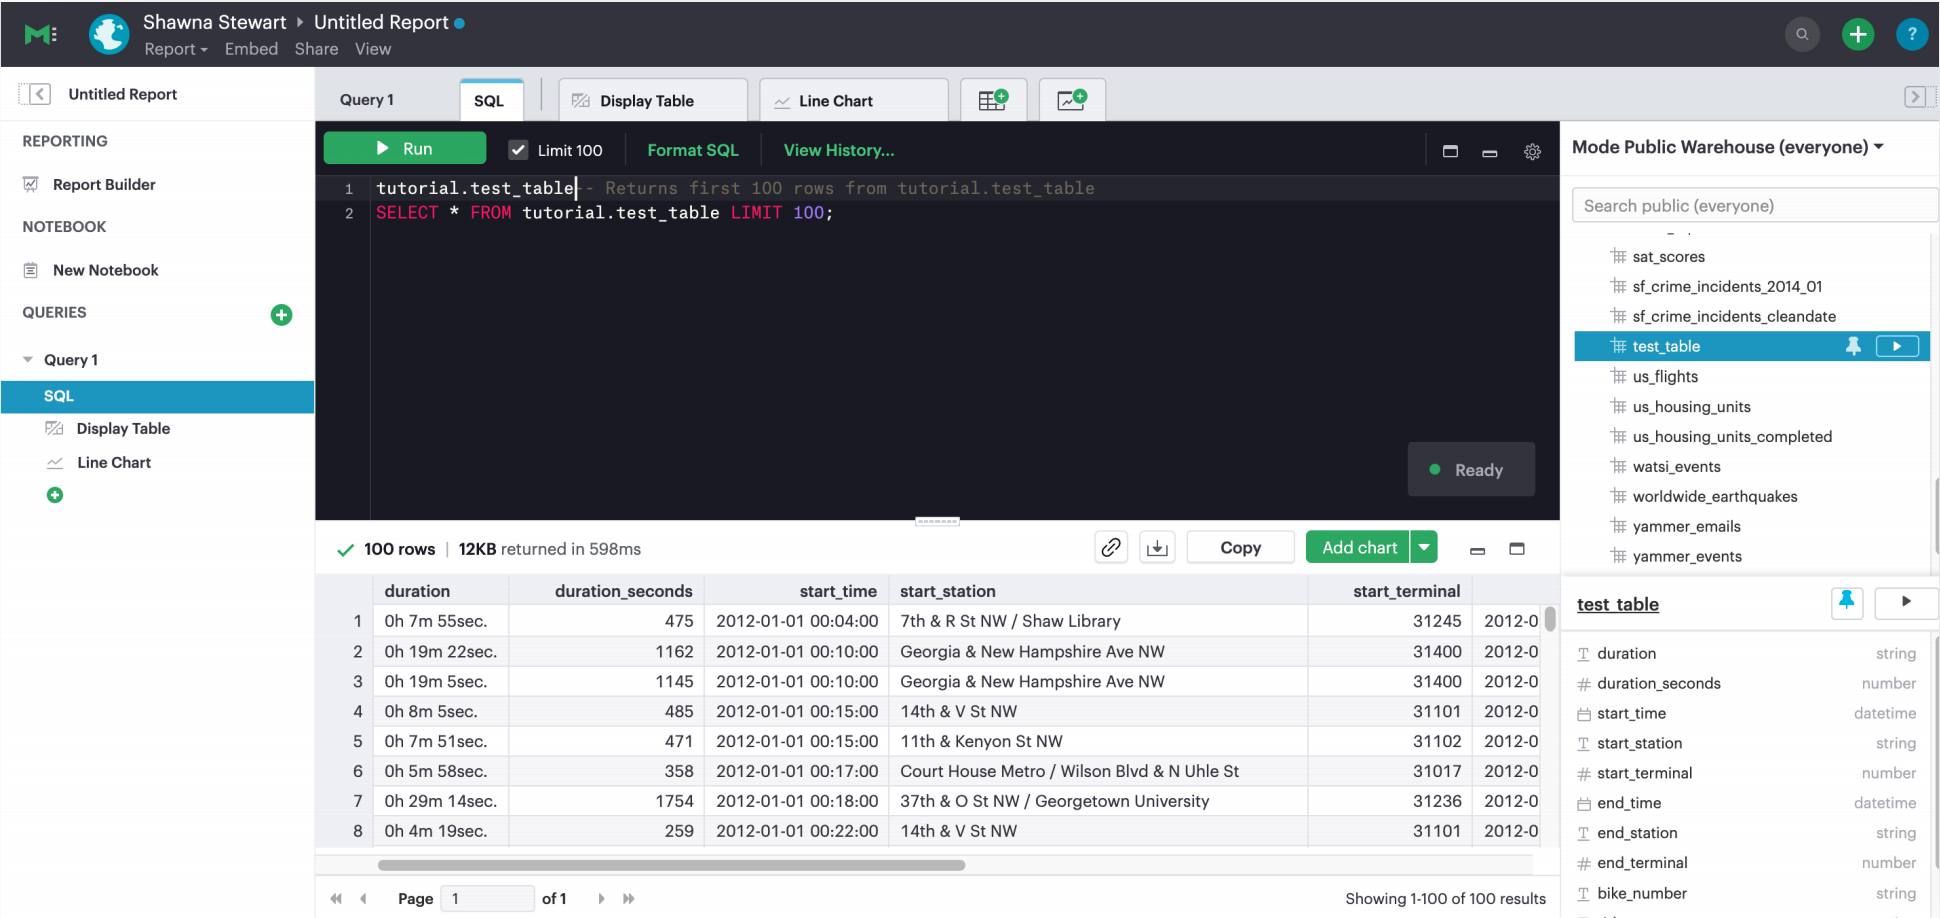
The first step in creating a report is to query data using the query editor. Mode’s SQL Editor provides flexibility without extra complexity. The editor is simple and intuitive while providing advanced capabilities to streamline workflow.

Select the database and explore the schema with the schema browser. The schema browser shows table structures including column names, data types, and samples of actual data in a simple table view. For databases with many tables, you can use the search functionality or pin tables to the top of the browser to more easily focus on the task at hand.
The code editor is where the analyst writes SQL to query the databases. The editor provides developer-friendly features including:
- Code highlighting and formatting
- Keyboard shortcuts
- Context aware auto-complete
- Query history
Time-saving shortcuts for your queries
Definitions
To save time, you can templatize your SQL queries with shared Definitions. These are custom SELECT statements that can be referenced in any SQL query. These definitions allow users to write business logic in one place and share it across multiple reports and users—simplifying complex queries, reducing repetitive tasks, and ensuring consistency.
Liquid template language
Liquid template language is available in all SQL queries and allows additional flexibility on top of existing SQL queries. With the template language, analysts can augment SQL with loops, if/then statements, and variables. These simple template constructs can simplify many tasks that are difficult to do within base SQL.
Parameters
Parameters let report developers make minor changes to their SQL syntax that give end users more flexibility when running their reports. Parameters allow report viewers to alter their reports without writing the underlying SQL code or asking report developers to modify the original query. Since parameters also use a Liquid template language, report developers can quickly use these template helpers.
Helix data engine
Behind the scenes, Mode’s in-memory data engine, Helix, powers the data analysis process. Instead of doing last-mile aggregations and pivots in queries to fit the results in memory, Helix lets analysts do the calculations on the fly using Calculated Fields directly in the report - reducing work and saving time. Because Helix works with large datasets, analysts can get insights on large datasets in less than an hour. There is no configuration or tuning needed for Helix. You will have this feature available upon implementation.
Mode’s SQL Editor is a powerful enabler for all users in your company. It is easy to use because it leverages basic SQL to get started but offers features that can accelerate the work of your entire team.
Visualizations
After an analyst creates a SQL query to retrieve data from the database, they have several options to further analyze and share the resulting dataset through visualizations. The simplest approaches are to display the data in a table, export to CSV, or copy to the clipboard. These static export options are useful for quick analysis. Mode, however, provides a much richer toolset for analyzing and sharing data with others through pivot tables and charting capabilities.
Tables
The simplest visualization is a table view of the data. In the table view, you can identify the dimensions and measures for your reports as well as the end-user filters. You can also control the format of your data so that, for example, the currency, date, percentage columns are readable and understandable.
Chart visualizations
Chart visualization options include bar, line, scatter, area, and pie charts. These chart types let end-users increase or decrease the granularity of the report and are simple to construct using the Mode interface. For example, you can explore a sales report and look at the data on a daily, monthly, or annual basis by adjusting the granularity. If there is an interesting observation, you can drill down into the weekly or daily data to view the underlying data table supporting the report. Users can also use parameters and filters to modify the underlying datasets without actually touching any code. These features allow the end user to explore the data on their own without the traditional back and forth of updating and refining SQL queries. This lets citizen data analysts and business stakeholders explore the data and build insights in under an hour.
Custom visualizations
With Mode, you can create your own custom visualizations as well. One of the primary ways of doing so is by leveraging the R and Python visualization libraries through the notebook environments. We will discuss notebooks in the next section.
Notebooks
So far, we've covered the SQL Editor and visualization tools which are good for day-to-day analysis. Most companies, however, need an environment where users can execute their own Python or R scripts against the data in order to perform further visualizations. Your users can use Mode’s SQL Editor and visualization tools for day-to-day analysis.
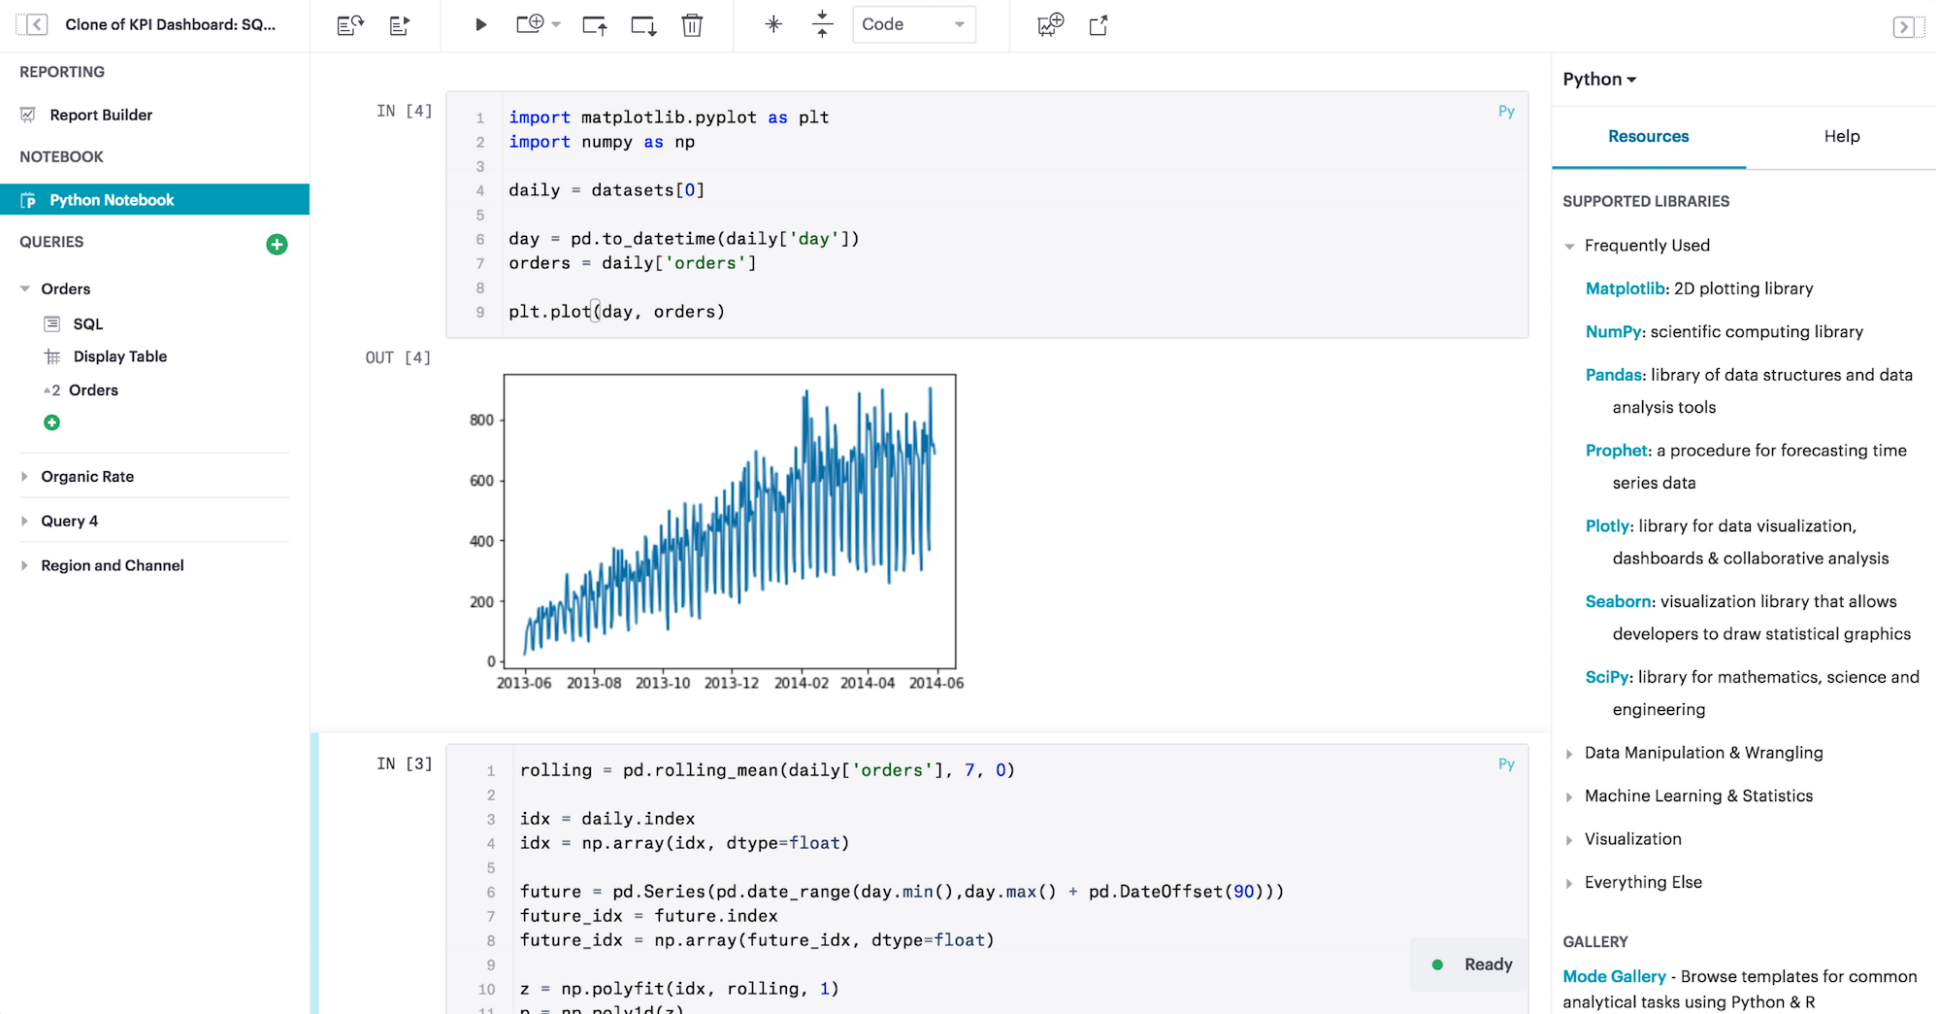
Mode uses industry standard Python and R in a notebook environment to enable rapid code iteration for data manipulation, statistical analysis, and advanced visualization. An analyst can perform analysis in a notebook that might be difficult (or impossible) to do in SQL.
Mode’s Notebook has specific advantages including its ease of setup, centralization of environments, and simplified administration due to the inclusion of a variety of pre-loaded Python and R libraries. Since this environment is very similar to existing notebook environments, the learning curve should be minimal.

After a query has been created using the SQL Editor, a user can add a new notebook to their report and access the results of all queries. Each query’s result is available in the native Pandas DataFrame or R Data Frame.
No additional manipulation is necessary. Because queries across multiple databases are made available in the notebook, it can be used to merge data that can not be easily joined with a standard SQL query. The analyst can then use the full suite of data science tools in Python or R to clean, analyze and visualize the data.
Out of the box, Mode includes many of the most popular libraries for R and Python, but if you need to install additional libraries, you can use pip install for Python or install.packages() with R.
Combined, the SQL Editor, visualization features, and Notebook environments in Mode enable users to create quick, flexible, and shareable analysis. Together, they provide a powerful but easy-to-learn workflow where code-first analysts and code-free end users can work together to turn raw data into real-time decision-making.
Analyzing data checklist
Here are some items to consider for analyzing your data:
- Which data analysis problems do you want to solve first?
- What are the most difficult data analysis challenges you have today?
- Are there visualizations you haven't been able to develop with existing tools?
- Do you have data sets that are currently too large or difficult to manage?
- Are there existing notebook environments that you can consolidate and streamline with Mode?
Building and sharing a report
Now that we have gone through Mode’s core concepts, we can walk through how to turn your analysis into a robust, meaningful report that can be shared across the company.
The first step in this process is to retrieve data using the SQL Editor. In many cases, an analyst or data scientist will then need to further refine or analyze the data using the Python or R notebook environment. Mode supports adding any of the output visualizations from the notebook into the final report as well.
Once the data retrieval is complete, the various visualizations, tables and insights need to be packaged together into an interactive, customized report that answers the business questions. Mode’s Report Builder provides a simple interface for dragging and dropping the components. Each component can be placed and adjusted anywhere in the report view. In addition, there is an option to insert text boxes to clarify the reports or highlight specific observations.
Finally, reports have multiple themes for customizing colors, fonts and styles. A company can also build custom themes for consistency with brand standards or to embed within other applications. The end result is that an analyst has flexibility to present their findings using multiple configurable visual elements.
Reports also support parameters and filters so that report users can adjust their data view without changing code. A parameter is an interactive report field where the report viewer can make selections that dynamically modify the underlying SQL query. When a user changes a parameter, the report needs to be executed to see the new results. On the other hand, a filter modifies the display of built-in charts and visualizations without re-running the query.
Analysts and users can also take existing reports on separate paths of analysis called Explorations where deeper exploratory interactions and modifications do not impact the original report. Explorations are also based on the same datasets as the original report. Changes to the report’s datasets are also reflected in the Explorations datasets. Explorations can be saved and shared with other users.
Mode’s reporting capabilities are robust and support flexible layouts. If users choose, they can use the HTML Editor to modify the underlying HTML and the CSS for report layout. By editing the report HTML, you can create your own visualizations using libraries like D3.js or Mode’s own JavaScript library, alamode.js. As analysts start to create more complex visualizations, they can use Python, R or JavaScript to build sophisticated charts. Mode provides the tools you need to develop simple charts, complex visualizations, and advanced, exploratory analytics.
Now that the report is created, it can be shared in multiple ways.
- Shared via an email to other members of the Workspace. The email can include a preview of the report, HTML table summary, report links, CSV, or PDF output.
- If Mode is connected to the team’s Slack channel, then Mode can publish a report to the desired Slack channel.
- All reports can be shared as a report link, which will show the view from the last time it was run, or a run link, which can be used to show a view of the report at the time it was generated.
In cases where your team wishes to run a report on a scheduled basis, Mode can automate the process of both running & delivering that report on a schedule for you. This ensures that up to date analysis is reliably delivered to the exact users who need it.
These sharing options are useful, but as the company’s adoption of Mode increases, users will want to organize and categorize their reports using Collections. Within a Collection, there are options to control membership as well as duplicate, star or archive specific reports. Easy sharing of reports allows analysts to leverage analysis across the team. In under an hour, an analyst can use an existing report as a basis for developing a new report that highlights business insight.
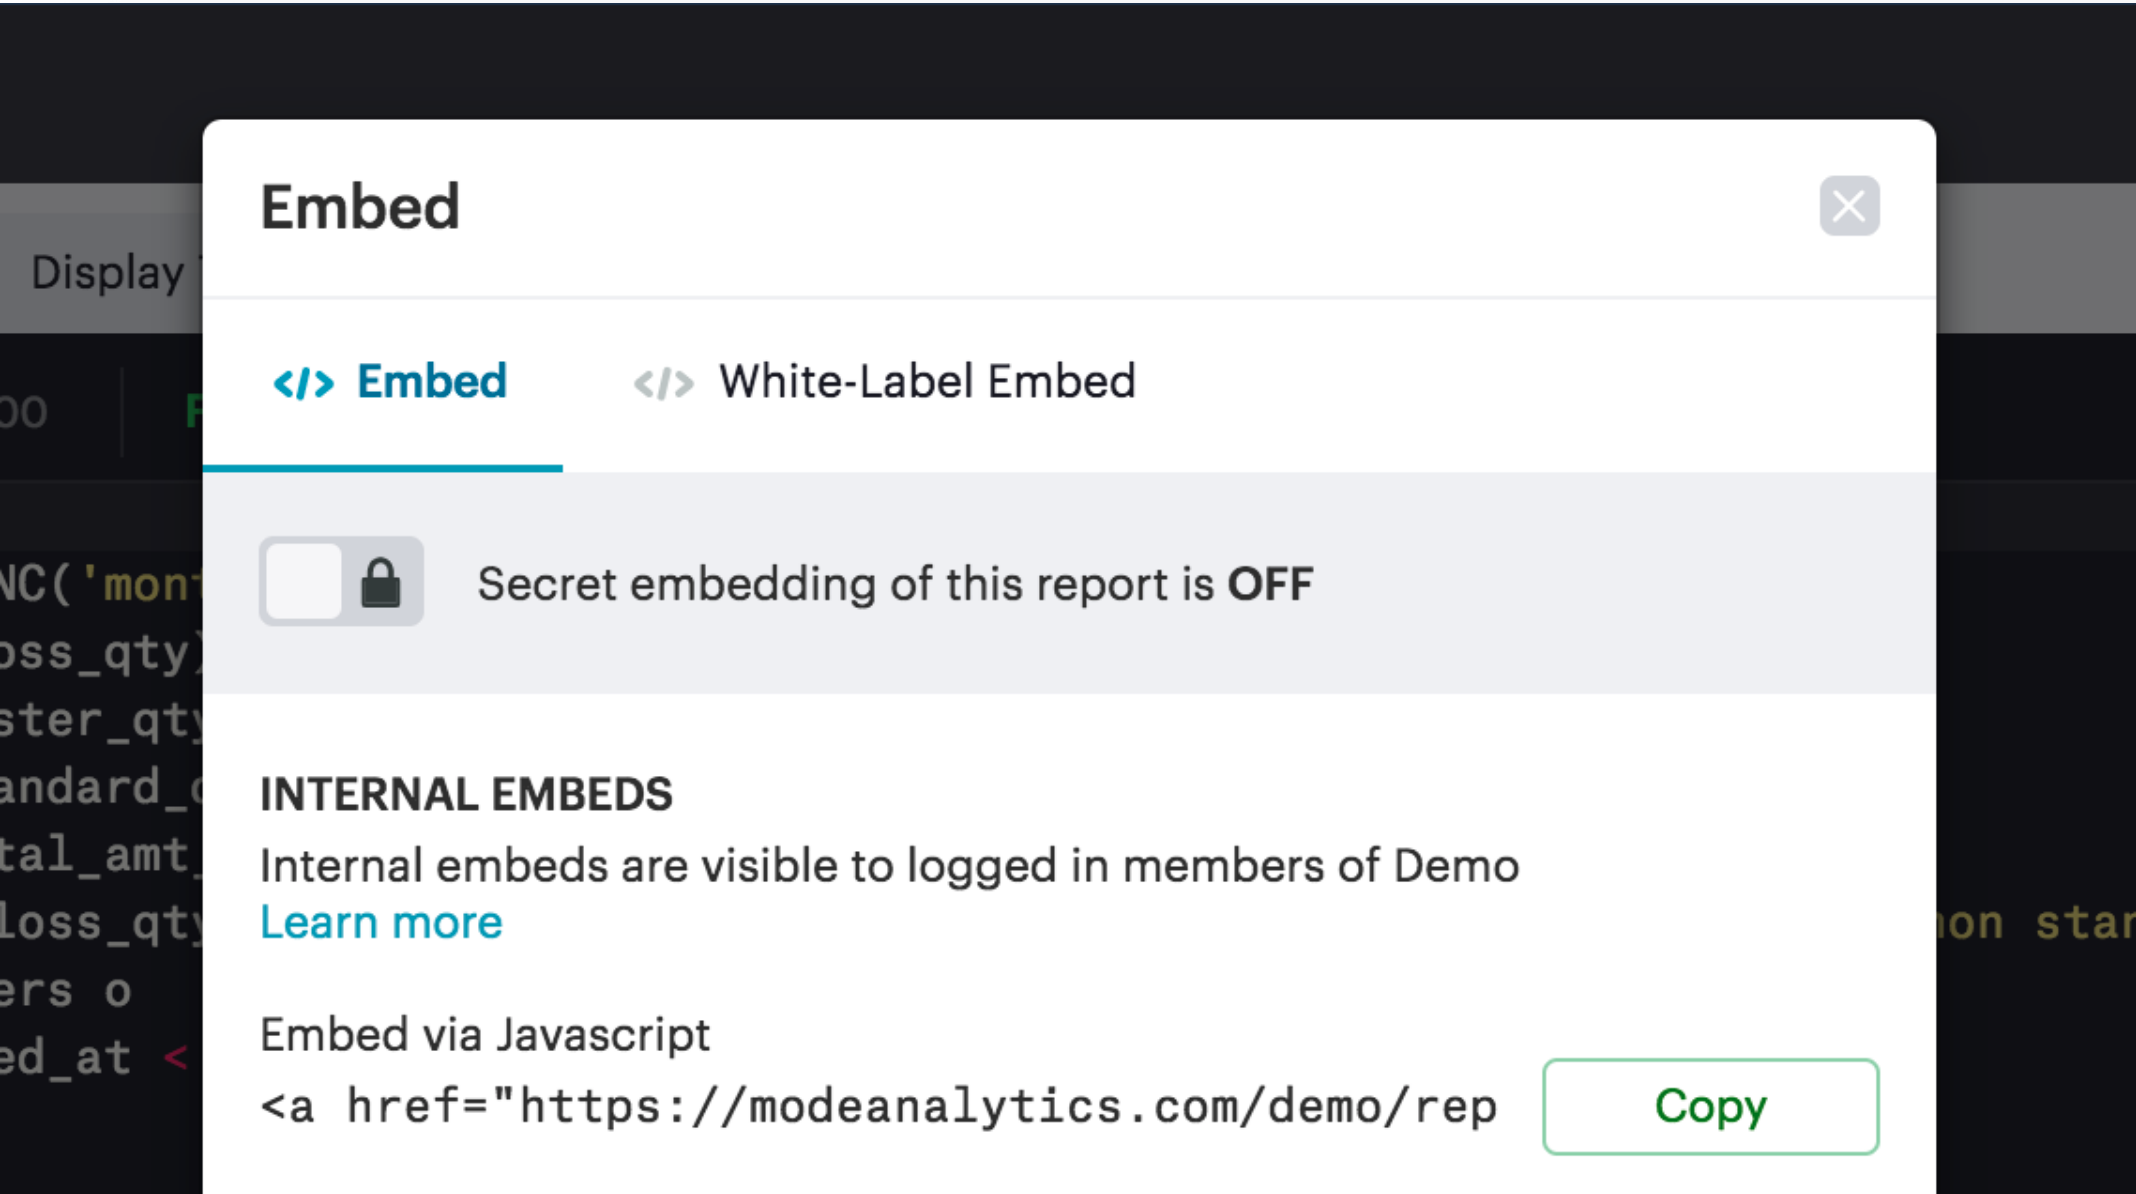
In some cases, reports might be useful for sharing outside of the company. Mode can embed reports in an internal website or on the Internet. Embedded analytics is a way to include Mode reports within existing sites, portals, or applications. A White-Label Embed (WLE) is used to share reports to users not logged into Mode. With a WLE, authentication is handled external to Mode with customized look-and-feel and interactivity. The WLE can also restrict the users ability to see the underlying data - avoiding unintentional leakage of sensitive data.

Building and sharing report checklist
Items to consider when planning your company’s reporting strategy:
- What are the most important reports to develop?
- Who will these reports be shared with?
- Does there need to be a custom theme developed for internal or external sharing?
- Will reports need to be embedded and shared with external partners?
- What is the primary manner reports will be shared?
Advanced topics
Building a data-driven culture means that data is a part of all your company’s processes. Mode provides several options for more deeply integrating data into the company’s workflows. Webhooks are used to notify other applications when events happen within the Mode environment. Webhooks are frequently used for:
- Triggering other applications through tools like Zapier
- Alerting users when Mode report runs are completed
- Enhanced logging of activity within Mode
- Alerting administrators when users join or leave the Workspace
Mode can also sync into a Github repository. The Github integration synchronizes common definitions, reports, or themes to all Mode users in the Workspace.
The activities discussed in previous sections are available to all Mode users and accessed via the Mode UI. In many cases, your company may also wish to access the Mode functionality via an API. A full discussion of the API is outside of the scope of this document, but here are a list of some of the frequently accessed functions:
- User and Collection membership, management and Workspace
- Granting database permissions
- Listing, deleting, archiving or updating reports
- Managing, updating or retrieving information about an SQL query
- Managing, updating or retrieving information about report filters
- Exporting results via JSON, CSV or PDF
- Managing report schedules and subscriptions
Advanced topic checklist
Which of the following functionality will be used:
- Are there any Webhooks to implement?
- Will Mode sync with Github?
- Which API options will the team use first?
- Are there any playbook items that we want to adapt to our needs?
Conclusion
Mode is a modern, powerful and flexible data analytics platform that is easy to set up in a short time frame. It uses familiar SQL, Python, and R languages so analysts can get up and running quickly, often with an hour for time-to-decision. With Mode, analysts can build interactive reports and dashboards that save time, align the company around common metrics, increase collaboration, and accelerate the speed to developing data insights. This guide provides guidelines that can help you implement Mode within your team in a way that you can get up and running quickly but provide a robust platform that will support the company’s growth over time. Use the checklist and ideas presented here to prepare for your implementation.
Was this article helpful?