
Shippo dashboard
We've made it easy to create a dashboard of your Shippo data in Mode, surfacing insights into shipment volumes, costs, and success rates. Follow these steps to generate a report like the one below using your own data.
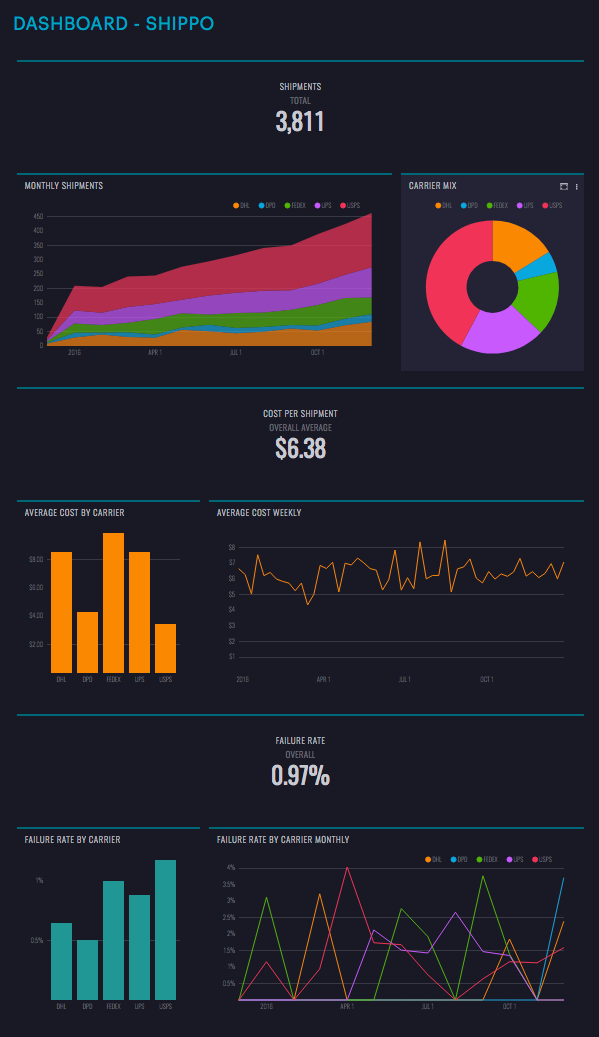 See the Mode report
Create a “Shipments” Definition
Mode Definitions are saved SELECT statements that you can reference in queries throughout the platform. The Shippo Dashboard uses a Definition called @shipments:
    SELECT f.id AS id,
           f.order_id,
           DATE_TRUNC('year',f.created_at) AS year,
           DATE_TRUNC('month',f.created_at) AS month,
           DATE_TRUNC('week',f.created_at) AS week,
           DATE_TRUNC('day',f.created_at) AS day,
           f.tracking_company,
           s.price,
           CASE WHEN f.shipment_status = 'failure' THEN 1 ELSE 0 END AS failure
      FROM demo.orders__fulfillments f
      JOIN demo.shopify_orders_shipping s
        ON f.order_id = s.order_id`
Create a Definition on your data source using the above code. Note that you'll need to update the demo. schema to match how it appears in your data source. This Definition assumes that all orders will have exactly one record in each of the orders__fulfillments and shopify_orders_shipping tables.
Shippo data has a ton of information in quite a few different tables. If you're like many Shippo customers who integrate the service with Shopify, the data may end up in Shopify tables, which you'll also want to sync to your warehouse. This definition provides a simple rollup of high-level information about your company's shipments. If you don't use Shopify, you can instead JOIN to another table that has a record of shipping costs for each order.
Note: The queries in this report are designed to run on most databases, including Redshift and Postgres.
Duplicate the Dashboard
Once you have the Definition set up, duplicate the dashboard by clicking “Duplicate” at the top. Once in the Editor, be sure to switch from the “Mode Public Warehouse” to your connected database. Then click run. When you click into the Report Builder, the dashboard will be ready and waiting, with your shipments data. Be sure to set a schedule so this dashboard refreshes each morning, and choose how you would like to distribute it to the team (via Slack, email, or embed, or present it on a TV).
Optional: Apply Report Theme
You can brand your dashboard using Mode themes. This report uses Mode Subway theme, but feel free to update it to your preferred look. Customers on the Plus Plan can also create custom themes to keep dashboard on brand.
Other things to analyze with Shippo data
This dashboard is just the beginning of different ways you can analyze your Shippo data in Mode. Join the @shipments definition with your customer support data to look for trends in delivery related customer complaints. Join with your orders table to identify products that are prone to failed deliveries. Identify users who have had failed deliveries in the past and win them back with a special offer.