
Segment Cross-Domain Dashboard: Publisher
Mode and Segment have made understanding your audience's cross-domain behavior a problem of the past. For publishers, that means you can track how visitors move across your domains and what content is most popular with those audience segments.
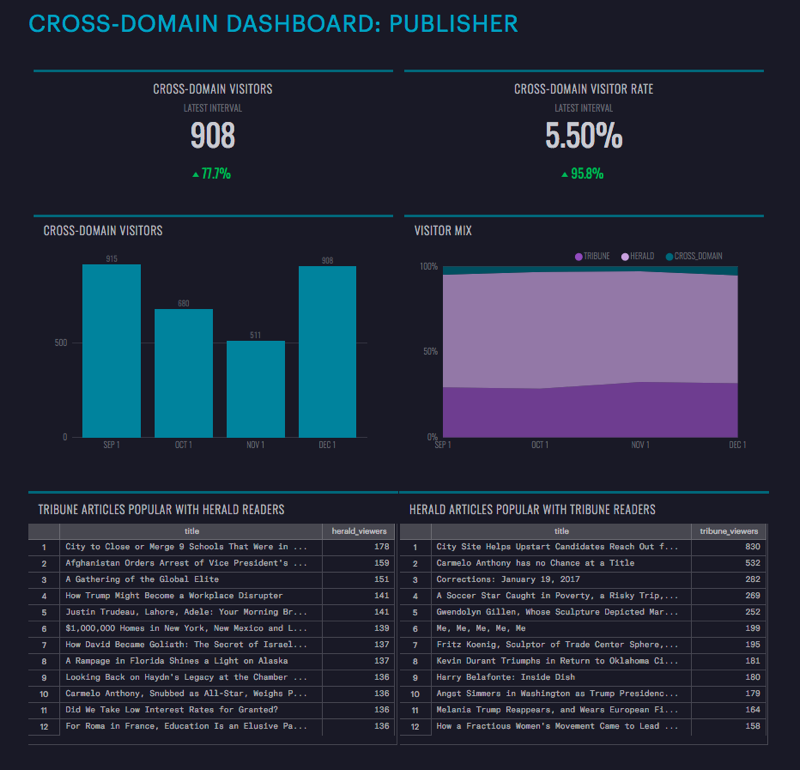 See the dashboard and the queries that power it.
Duplicate the dashboard
If you like what you see, duplicate the dashboard by clicking “Duplicate” at the top. Once in the Editor, be sure to switch from the “Mode Public Warehouse” to your connected database. Then adjust the schemas in the SQL queries to reflect your data sources and click run. Be sure to set a schedule so this dashboard refreshes each morning, and choose how to distribute it to the team (via Slack, email, embed, or presented on a TV).
Optional: Apply a report theme
You can brand your dashboard using Mode themes. This report uses Mode Subway theme, but feel free to update it to your preferred look. Customers on the Plus Plan can also create custom themes to keep the dashboard on brand.
Other ways publishers can analyze cross-domain data
This dashboard is just the beginning of different ways you can analyze cross-domain visits. You could dig in more deeply to user attributes to find out how audiences differ by publication or use UTM parameters to analyze the efficacy of cross-promotional social or email campaigns.