
Segment Cross-Domain Dashboard: E-Commerce
Mode and Segment have made understanding your customers' cross-domain behavior a problem of the past. For e-commerce retailers, that means you can track how visitors move across your domains to find out which products have the most pull for these audience segments.
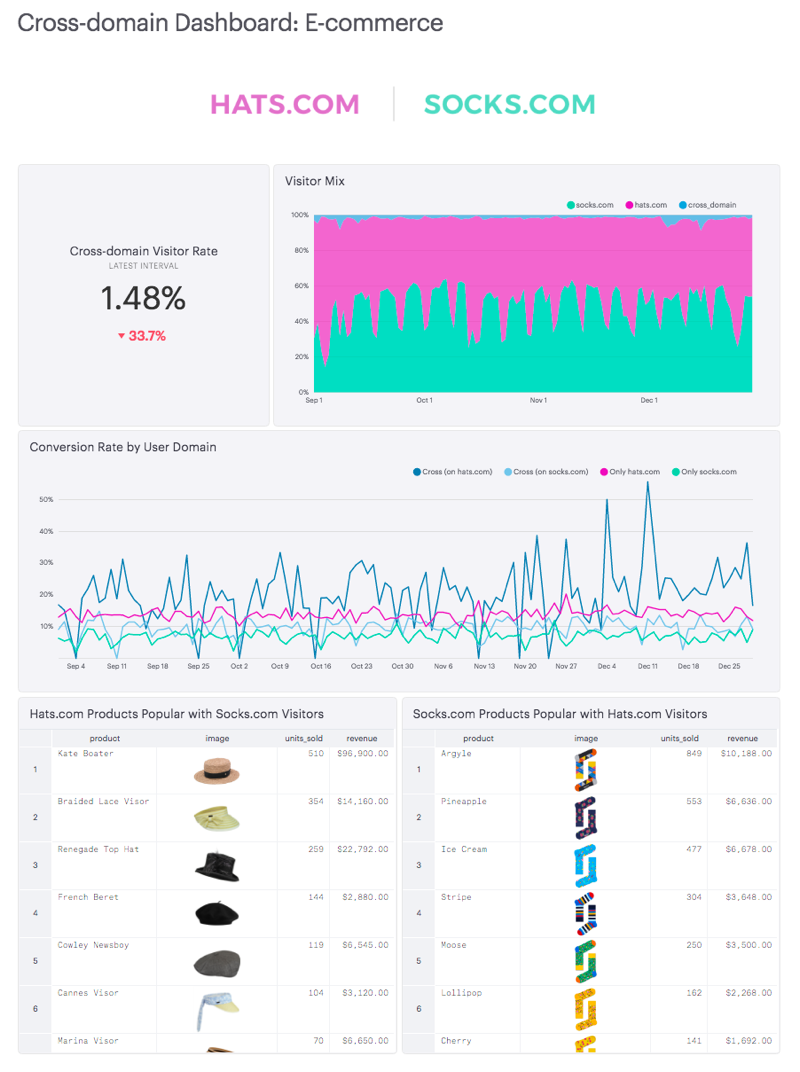 See the dashboard and the queries that power it.
Create Definitions
Mode Definitions are saved SELECT statements that you can reference in queries throughout the platform. The E-Commerce Cross-domain Dashboard uses three Definitions: @user_domain, @hats_order_products, and @socks_order_products.
@user_domain
    SELECT context_traits_cross_domain_id,
           CASE WHEN domain_count = 2 THEN 'Cross-domain'
                WHEN domain = 'hats' THEN 'Only hats.com'
                ELSE 'Only socks.com' END AS domain
      FROM (
    SELECT context_traits_cross_domain_id,
           STRING_AGG(domain,',') AS domain,
           COUNT(domain) AS domain_count
      FROM (
    SELECT DISTINCT context_traits_cross_domain_id,
           'hats' AS domain
      FROM demo.hats_pages hp

     UNION ALL

    SELECT DISTINCT context_traits_cross_domain_id,
           'socks' AS domain
      FROM demo.socks_pages sp
            ) all_visitors
     GROUP BY 1
            ) visitor_domain
@hats_order_products
    SELECT order_id,
           user_cross_domain_id,
           SPLIT_PART(product_name::varchar,'"',2) AS name,
           SPLIT_PART(image::varchar,'"',2) AS image,
           price::numeric AS price,
           quantity::numeric AS quantity,
           price::numeric * quantity::numeric AS product_revenue
      FROM (
    SELECT order_id,
           user_cross_domain_id,
           products -> 'name' AS product_name,
           products -> 'image' AS image,
           products ->> 'price' AS price,
           products ->> 'quantity' AS quantity
      FROM (
    SELECT id AS order_id,
           context_traits_cross_domain_id AS user_cross_domain_id,
           json_array_elements(products::json) AS products
      FROM demo.hats_orders
           ) orders
           ) order_products
     ORDER BY 1`
@socks_order_products
    SELECT order_id,
           user_cross_domain_id,
           SPLIT_PART(product_name::varchar,'"',2) AS name,
           SPLIT_PART(image::varchar,'"',2) AS image,
           price::numeric AS price,
           quantity::numeric AS quantity,
           price::numeric * quantity::numeric AS product_revenue
      FROM (
    SELECT order_id,
           user_cross_domain_id,
           products -> 'name' AS product_name,
           products -> 'image' AS image,
           products ->> 'price' AS price,
           products ->> 'quantity' AS quantity
      FROM (
    SELECT id AS order_id,
           context_traits_cross_domain_id AS user_cross_domain_id,
           json_array_elements(products::json) AS products
      FROM demo.socks_orders
           ) orders
           ) order_products
     ORDER BY 1`
Create Definitions on your data source using the above code. Note that you’ll need to update the demo. schema to match how it appears in your data source.
Duplicate the dashboard
Once you have the Definition set up, duplicate the dashboard by clicking “Duplicate” at the top. Once in the Editor, be sure to switch from the “Mode Public Warehouse” to your connected database. Then click run. When you click into the Report Builder, update the Definition names in each query and the dashboard will populate with your cross-domain data. Be sure to set a schedule so this dashboard refreshes each morning and choose how you would like to distribute it to the team (via Slack, email, embed, or presented on a TV).
Optional: Apply a report theme
You can brand your dashboard using Mode themes. This report uses Mode Grey theme, but feel free to update it to your preferred look. Customers on the Plus Plan can also create custom themes to keep the dashboard on brand.
Other ways e-commerce retailers can analyze cross-domain data
This dashboard is just the beginning of the analysis you can do on cross-domain visits. You could dig in more deeply to user attributes to find out how audiences differ by brand or create a unified understanding of lifetime value by looking at customers' purchases across all of your properties.