KPI Reporting & Metrics Tracking: Everything You Need to Know
Justin Reynolds, Data specialist
November 4, 2022
NaN minute read

Companies need to track key performance indicators, or KPIs, to understand how they’re performing against goals for growth, revenue, retention, and important metrics. But many aren’t equipped to ingest, transform, and visualize the large quantities of data from multiple sources that’s required to accurately track common KPIs today.
Data-driven companies use interactive KPI dashboards and flexible KPI reporting to engrain analytics into every process and make the best decisions. Learn how to make your own powerful KPI reports, empower business users with the analytics they need, and adopt modern BI solutions that make your life easier. x
What is KPI reporting?
KPI reporting is the process of collecting, aggregating, and visualizing data that helps leaders measure their performance against the metrics they care about the most. Business units use KPI reports and dashboards to track acquisition, retention, and other indicators of the company’s health.
KPI reports aren’t just dashboards and vanity metrics. They’re dynamic, explorable interfaces for understanding what actions to take next, typically grouped by type of metric. Analysts build them with powerful data solutions, then can deliver them to business users in intuitive, no-code environments to further drill down and visualize the data in different days.
What is a KPI dashboard?
KPI dashboards typically group KPI data by strategic goal or business function. They bring together analytics on different performance indicators to give stakeholders an overview of the organization’s health.
The most accurate and comprehensive KPI dashboards are built by data teams that use powerful BI tools that are also designed for the average business user to use without experience as a data analyst.
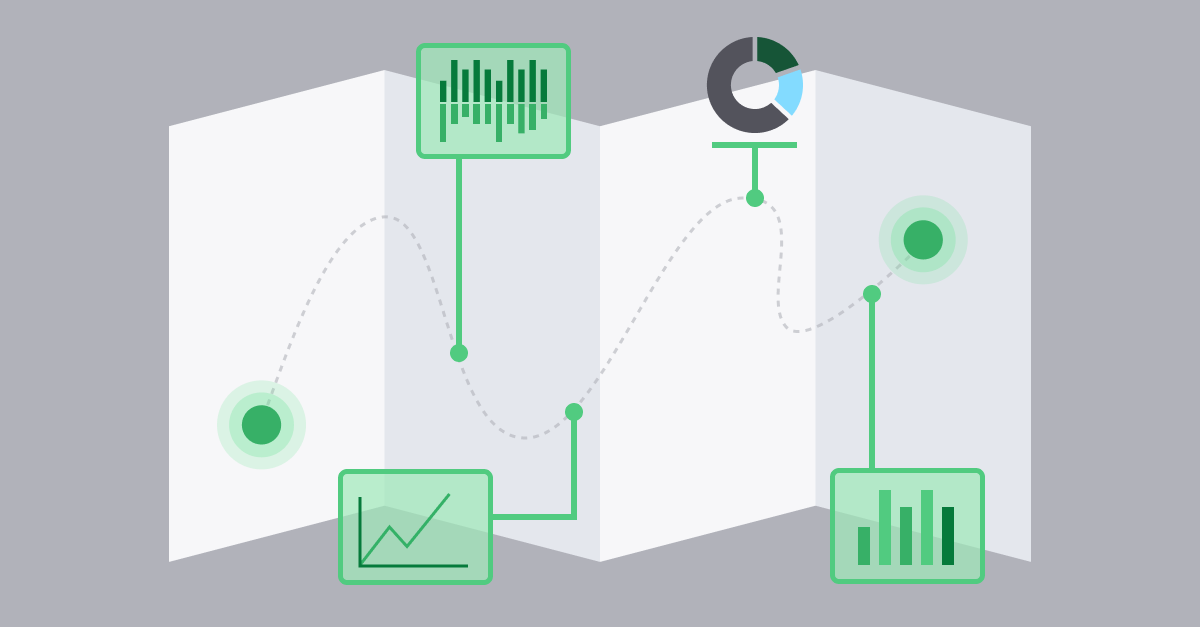
Data is piped from sources like the company’s website, apps, accounting system, and marketing tools then loaded into a data warehouse using an ETL tool like FiveTran or Stitch. Users can then visualize and explore it using reports and dashboards on a modern BI platform like Mode.

The 2023 Playbook for Early-Stage Data Leaders
Create a data program that scales.
Company KPI dashboards: “North Star” metrics matter for alignment
Company-wide KPIs set the bar for all of the more granular goals that drive them. To build North Star company KPI dashboards, data teams must be able to centralize data from dozens or even hundreds of sources, normalize and transform it, and use it to create easily understood self-serve data that tells everyone how well the company is performing.
Company KPI dashboards provide enough information to drive overall strategic decisions without overwhelming users with too much detail. For example, a few metrics we include at Mode are spot ARR, annual customers, new customer growth, and monthly user activation rate—our team members can drill down to understand more about each dashboard item, but to make informed decisions for their department they’d need their own KPI dashboard.
North Star company KPI dashboards help inspire everyone to work toward shared goals. North Star company metrics can be:
Referenced in all-hands
Used to set OKRs each quarter
Displayed in common areas to foster a data-driven culture
Shared in weekly scheduled emails or Slack channels
However, they aren’t meant to be the only source of performance data—each team should have its own customized, interactive dashboards and KPI reporting that democratizes data for every stakeholder, analyst or not.
KPI reporting examples
Some examples of KPI dashboards at data-driven companies include “North Star” dashboards that paint a broad picture of company performance, department-specific dashboards that help sales, marketing, customer success, and other teams reach goals that align with overall organizational success, and initiative-focused dashboards that offer a look at performance in relation to a specific area of interest, like building a partner network. Technical teams often build KPI dashboards to track availability, downtime, and other systems performance metrics (especially valuable if the company has an SLA). These KPI dashboards can also incorporate software development metrics, offering deeper insights into aspects like code quality, deployment frequency, and incident resolution times, all of which are critical for maintaining system reliability and supporting overall business health.
Let’s take a look at some examples of KPI reporting that can be done in Mode.
Executive KPI report
This company-wide KPI dashboard contains what are sometimes referred to as “North Star” metrics. It should provide enough information to drive overall strategic decisions without overwhelming users with too much detail. For example, at Mode we include spot ARR, annual customers, new customer growth, and monthly user activation rate. This lets execs see company health at a glance and dig deeper as needed.
Finance KPI report
Financial KPI reporting would feature the metrics that the CFO’s team needs to make smart calls on. It should help them see the budget, manage runway, plan for fundraising, and balance growth with risk. They’re also a staple in board meetings and investor calls to show progress toward the next milestone. Using financial reporting software can make this process more efficient by automating reports and improving data accuracy.
Growth KPI report
There are plenty of growth KPIs to choose from, so focus on the ones most relevant to your business model. SaaS companies should focus on tracking SaaS metrics like recurring revenue, acquisition, and retention while other industries may focus on customer counts and transactional data.
Metrics Definition Template
A template for data teams and stakeholders to define metrics together.
How to start creating KPI reports
To develop KPI reporting that you can adjust with clean, data-driven workflows, you need a modern BI platform, or reporting software, that can process and visualize massive quantities of data in near real-time. But before you can do that, you need to get all your data in one place.
1. Get data teams and business teams on the same page
Both data teams and business teams should develop KPI reporting together. Data teams can develop the data foundation and help set guidance with metrics definitions and analysis, while stakeholders incorporate their domain expertise.
Before developing an improved KPI reporting workflow, it’s important to speak with each team lead to understand their use case, technical ability, and dependencies. Take Conde Nast, for example, a Mode customer that wanted to transform their data culture globally. The BI team used Mode to build an internal data platform, called the Mode Portal, to provide a single, organized, and searchable place for the product analytics and marketing teams do analysis and share their results.
2. Choose an ETL tool
Data is piped from sources like the company’s website, apps, accounting system, and marketing tools then loaded into a data warehouse using an ETL tool like FiveTran or Stitch. Users can then visualize and explore it using reports and dashboards on a modern BI platform like Mode.
ETL tools pipe your data from all of its various data sources to a single warehouse. They first extract data, then transform (enriching and normalizing it based on the best practices and the data team’s guardrails) and load it into the warehouse of your choosing. Read the 2022 ETL Buyer’s Guide to choose the best ETL tool for your company.
3. Build out your most important dashboards and reports
Once your data is clean and accessible in a single warehouse, the data team can get to work on the most pressing requests. Typically this means dashboards for each department.
Users of these dashboards should be able to click into a particular metric and see underlying report data, easily share findings and visualizations, and quickly export what they need for their own reports and presentations to leadership.
4. Decide what self-service data products to build
Modern, dynamic KPI tracking goes further than allowing teams to see the reporting that was initially built for them. Data teams can build powerful self-serve products (like the Conde Nast portal we mentioned) that let non-analysts access flexible, customizable reports, and even build their own without SQL knowledge. This takes some time and care upfront from the data team, but pays dividends once stakeholders can find what they need on their own using their new data products.
Flexible KPI reporting in Mode
As you grow, the metrics you care about will change. That’s why it’s so important to build KPI reporting on a platform that doesn’t lock you into any one method or set of data sources.
Mode lets you connect all your current data sources, easily add new integrations, and see context for how underlying data changes throughout the evolution of your analytics setup. Once your data is piped into a data warehouse, you can explore your connected database with SQL queries, use advanced logic with Liquid, and create visualizations for KPI dashboards and reporting.
Since Mode is powered by a high-performance data engine, you don’t have worry about slow load times bogging down self-serve KPI reporting. Mode automatically optimizes the speed at which non-analysts can explore the tools you provide them and make decisions based on the performance indicators that matter the most to each team.
With Mode, analysts can feel free to build what they think they need, and then refine it as they learn. Customize visualizations using HTML, CSS, and Javascript, or use Python and R to explore the data before presenting KPI metrics in interactive, real-time dashboards and tools.
Safely sharing KPI dashboards internally
To share KPI dashboards safely, you'll want to make sure that they have the necessary permissions. After all, not everybody in the organization should be accessing all of the data available.
In Mode's paid plans, Admins can add permissions for users in an organization to view different Collections (a Collection usually houses an entire department's analytics). You can also use Groups to give access to larger numbers of folks who need access to the same data and dole out Editor and Viewer permissions. Connection permissions in Mode also helps guardrail a user's ability to query and view data in Mode. Visit our help site to see our Permissions Best Practices.
Socializing KPI dashboards: know your audience
Building KPI dashboards should be part of a larger initiative to instill a data-driven culture into every team in your org. There’s a reason to include stakeholders early on beyond just getting the reporting right, and that’s because you need buy-in and adoption once KPI reporting is ready to use.
To keep people excited and feeling empowered over their newfound access to data, arrange training sessions and communicate with each team as you roll KPI reporting out. Socialize them at all-hands meetings, get department heads to lead the conversation themselves, show examples of how reporting can reduce manual work and speed up initiatives—anything to drive a sense of ownership outside the data team.
You can also keep your own KPI dashboard that tracks adoption of the reporting products you’ve rolled created. If you see a downturn in usage, preempt attrition by asking your internal users what’s holding them back.
What’s next? Future usage and implementation
Once you have a well-oiled performance tracking process in place, you should check in on a regular basis to understand what new products might be helpful for your stakeholders and their business objectives.
When data is managed in Mode, it doesn’t take long to build and fine-tune new data products. You can monitor the way employees use your dashboards, add new self-serve capabilities, and sunset features that aren’t useful. Keep increasing your data team’s bandwidth the way Stitch did by using Mode to automated reporting, collaboration, and governance. You can even take the same data used in KPI reporting and extend its value by embedding analytics into your own products or sharing it in a partner portal.
KPI metrics tracking is a crucial part of modern business intelligence that, if done right, gets you faster insights and lessens the burden on your data team immensely. To experience how Mode streamlines KPI reporting and makes life easier, start your free trial today.
Get our weekly data newsletter
Work-related distractions for data enthusiasts.


