Types of Product Usage Segmentation

Ethan Alter, Product Marketing Manager
May 18, 2021
NaN minute read
How, and why, do users engage with your product? What types of users engage with your product? Do these different “types” have different needs or expectations?
Users will teach us more about our own product than any amount of self-study possibly could. Only users, through their interactions with the product, can bring it to life.
Product usage segmentation is about prizing these interactions and using data to get as close to them as is possible, so that we might learn about our product, its users, and the bi-directional relationship between the two. The more granular the product analytics a team can gather, the better equipped they’ll be to make decisions about their product roadmap.
This article will explore “the what, the why, and the how” of employing product usage segmentation to understand your users and make data-informed product decisions.
What is product usage data?
To understand product usage segmentation, it’s best to first understand product usage.
Product usage describes the ways in which users interact with your product. Whenever you use a product or device that is (or can be) connected to the internet, it is very likely that you are creating product usage data that will be analyzed by the makers of said product.
For example, every time you open a food delivery app, the app is likely logging information not only about what you ordered, but also about what options you considered, how long it took you to decide, and how quickly your food arrived.
Product usage describes the attributes of the interaction and can span many different types of data and user actions. Here are some examples of the types of data that may be generated by product usage, along with related questions that product teams might ask.
Types of product usage data:
Frequency of use - how often do users log in or open the app?
Length of use - once logged in, how long is a typical session?
Actions taken - what do users do once they’ve opened the product?
Tasks completed / goals achieved- did the user accomplish the task or goal that caused them to open the product in the first place? How do we know?
Retention - after a user takes some action in the product, do they return to take that same action again after some period of time?
Location- where are users located?
Device information - through which devices (mobile, tablet, desktop) or browsers (Firefox, Safari, Chrome) do users access the product?
Feedback - did the user submit a bug report or file a support ticket during their session?
A critical point here, to which we’ll return later in the “How To” section of this post, is that not all usage is created equal. Engagement with the product is the type of user behavior we’re designing for.
Therefore, before plunging headlong into analysis, defining what engagement means for your product and which objects or features of your product relate to engagement, will be crucial to effective product usage segmentation. If you’re not sure where to start, your company’s mission can be a good jumping-off point.
Download
Get the full Guide to improving retention
In this guide, we’ll show you how to uncover insights about your users that drive better engagement and growth.
Product usage data at Mode
At Mode, our mission is to unlock and accelerate better decision-making with a modern BI platform. We believe that insights from data can dramatically improve decision quality, so one of the product usage metrics we track is “data assets created.”
A data asset is anything that communicates insights and moves our users forward on the path from data to decision, such as a chart, report, or Exploration. We think of data assets creation as a critical indicator of engagement.

The visualization above, created using the Mode platform, allows us to understand the patterns of data asset creation for any given customer; it lets us understand how they’re spending their time in Mode. (Yes, this is a data asset about data assets. Meta!)
Visualizations such as this area chart can evoke several questions that invite further analysis:
What accounts for the apparent cyclicality in overall usage?
How do recent product improvements map to these patterns?
How does this usage picture relate to customers with similar use cases?
To answer questions like these, we’d probably jump back into Mode to pull in data from other tables and, you guessed it, create some additional visualizations!
Particularly as your user base grows, segmentation can be instrumental in uncovering actionable insights about users. Let’s now take a closer look at product usage segmentation.
What is product usage segmentation?
Product usage segmentation is the method of categorizing your users based on their patterns of interaction with your product.
If product usage describes the patterns of user interaction with your product, product usage segmentation is the method of bucketing and describing your users based on those patterns.
Your users will have a variety of expectations and goals for their interaction with your product, and product usage segmentation is a powerful tool for understanding diverse user needs. The categories (segments) that emerge from this exercise, can reveal the previously unseen diversity in your user population.
How to do product usage segmentation
Identify the features to pass to your algorithm to create user segments
We return now to a point referenced briefly above: you should understand what type of engagement matters. What type of engagement drives business outcomes? Which objects / features / artifacts in your product are related to the user actions that signal this type of engagement?
Find (and run) a clustering algorithm to classify users into groups based on the features that you’ve identified.
There are a number of algorithms that will take a number of observations as input and return cluster categorizations as an output.
Here, we’ll highlight one of the most popular, a method called k-means clustering.
I’ve created a very simple example report of how this could look in Mode.
K-means clustering is a popular unsupervised learning method for generating unlabeled clusters. This method takes n observations and assigns them to k different clusters.
One of the arguments that you’ll have to pass to a k-means clustering algorithm is
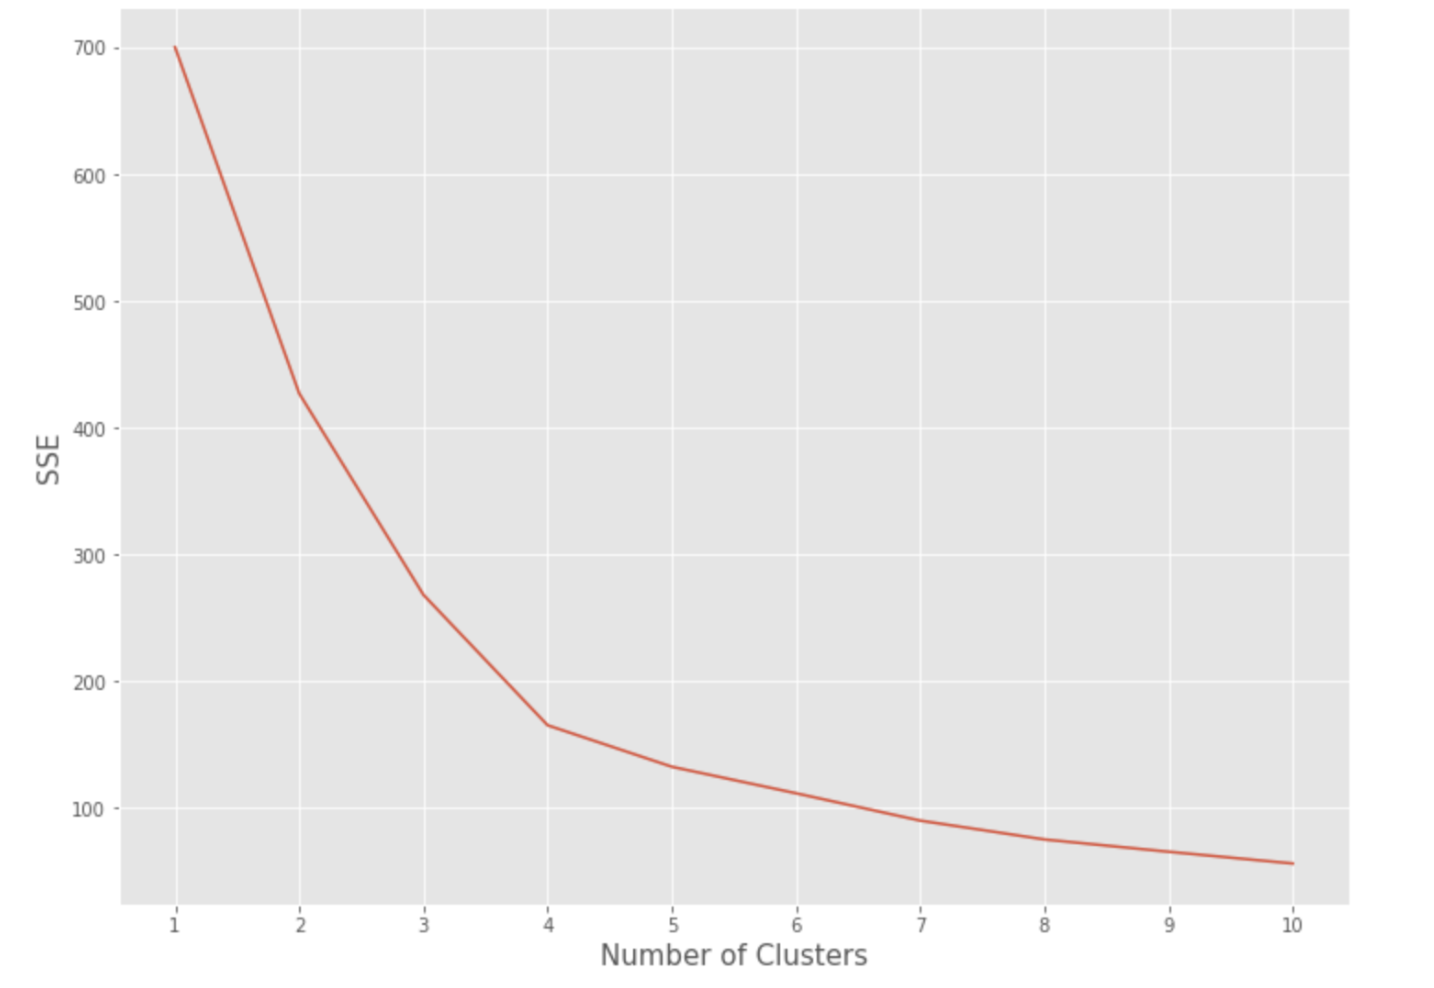
k, the number of clusters. How do you know which k to choose? One oft-used approach is to run the k-means algorithm several times with different values for k in order to generate a scree plot that plots within-cluster sum of squares on the y-axis against the number of clusters (given by k) on the x-axis. The resulting visualization will usually have an “elbow” that signals the point of decreasing marginal gains in cluster specificity. Here’s how my plot looked in my example.
3. Name your segments and start socializing them.
The algorithms won’t name your segments for you. Choose names that are memorable and likely to “catch on” among product and go-to-market teams. Rhyming, alliteration, and co-opted cliches are your friends.
4. Make your analysis accessible by surfacing it in an interactive dashboard.
At Mode, we know that analysis is only as valuable as the improvements in the decisions that the analysis informs. Extend your hard-won insights through your organization to teams that interact with users. Make use of filters and parameters to let stakeholders view details for the subsets of users they’re interested in.
What are the benefits of product usage segmentation?
The gold standard benefit for product usage segmentation is a clearer answer to the question “What should we build next?” If your segmentation impacts and informs your product roadmap, well done. In addition to roadmap considerations are several other organizational capabilities that product usage segmentation may unlock:
1. Data-empowered go-to-market teams
Give your customer success and sales teams the data-driven understanding they need to meet and exceed your customers’ expectations. When customer-facing teams can make sense of how a particular user set is engaging (or not) with your product, this data can give them the opportunity to deliver richer, more contextual customer experiences. Side effects may include greater retention, better feedback, and in some cases, delight.
2. More relevant messaging
Target messaging from product and go-to-market teams to specific user segments to hit product OKRs. Need to increase feature adoption? The users you need to convince probably care about different things than the power users of your legacy features. Building a bridge from casual viewer to power user is only possible if you know how these groups of users map to specific parts of your product. As with the customer success angle, the more personalization, the better.
3. Cross-functional alignment through a common vocabulary
Less intuitive but hugely powerful: develop a common vocabulary for talking about your users across the organization. There’s an opportunity to build depth and degree into your usage framework and, as a consequence, deepen the way your team thinks about users. Over time, the language you attach to product-derived segments will move your organization toward a more nuanced view of the people you’re building for.
What makes product usage segmentation difficult?
In a word, ambiguity. There’s a lot of deep thinking that will (or at least should) happen before any algorithm or classification method gets a whiff of your usage data.
If your product and data engineering teams like each other, and as a result, you’re already measuring all the right interaction details in such a way that they’re eventually interpretable by motivated human beings, congratulations. Big first step.
Now comes the interpretation, fun and frustrating, iterative and hopefully illuminating.
If the goal is generating user segments, there are many, many factors along which you can create those segments:
age of user,
time spent using the product in the past month,
days since account was created, number of records created,
user location, etc.
Sure, you could choose one criterion and roll with it, but the “right” answer probably lies in some combination of the hundreds of factors that you measure about user behavior. And the “right” answer today isn’t necessarily the right one tomorrow, much less next quarter.
Yet another difficulty: building product fast will mess up your carefully crafted schema! As product features are built out, associated metrics and schema are likely to change frequently, and pre-baked analysis will be just as frequently out of date.
For data and product teams, a tight partnership and an ongoing mutual commitment to learning from users can help ensure the right kinds of product usage are being measured (and managed).
Conclusion
Product usage segmentation is a powerful method for developing rich, actionable insights from your product usage data. Done correctly, it can unlock personalized experiences, increase user retention, and inform your product roadmap. It’s a tool that merits a place in any product manager’s toolkit.
Product teams at Figma, Lyft, and Domain use Mode to make decisions at the speed of product. Schedule a demo here to learn what Mode’s collaborative analytics platform can do for your team.

Watch a product tour of Mode
Curious about how Mode works? Sit back and watch the video—no reps ;)
Get our weekly data newsletter
Work-related distractions for data enthusiasts.


