Mode updates
4 Design Tips for TV-Ready Dashboards
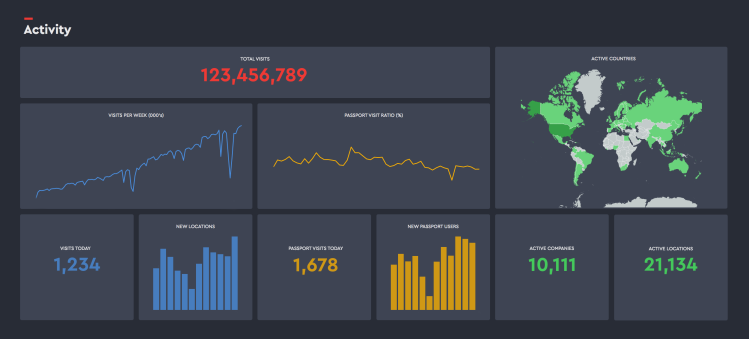
Designing dashboards for display around the office introduces unique challenges for effectively communicating insights.
The dashboards need to engage viewers without relying on interactive elements. On top of that, it's even more important that dashboards displayed publicly be on brand and blend into the office environment.
Editor’s picks in Mode updates
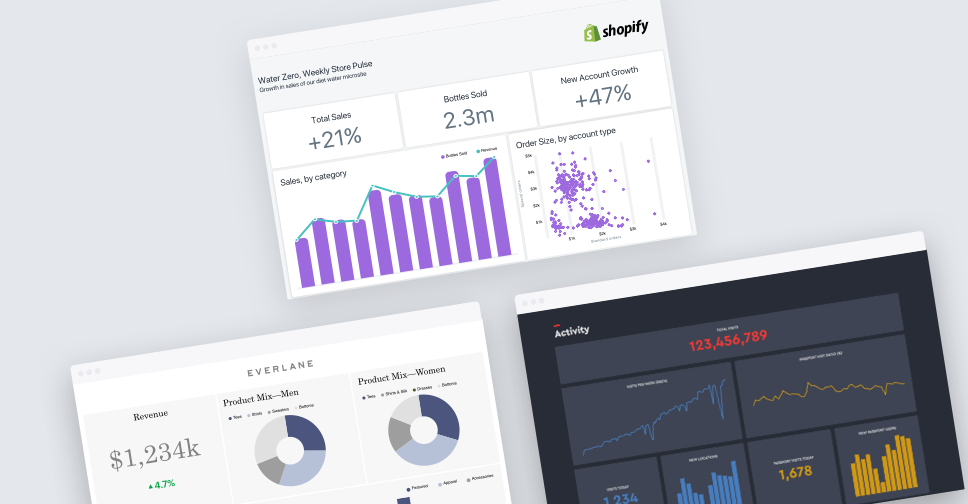
Keep Your Dashboards On Brand With Custom CSS
March 7, 2017• 4 minute read
Analysts know that having the right numbers is only half the battle. In order for your work to make an impact, it has to be presented in a way that's approachable for your audience. Formatting popular reports to meet brand guidelines is a great way to ensure your work looks official and commands attention.
In addition to providing endless possibilities for building custom visualizations using SQL query results (a handful of which we've collected in Mode's community gallery, the Mode HTML Editor also enables you to customize the look and feel of our stock report elements to ensure consistency with your brand guidelines.

Joel Carron
Data Scientist at Mode

This Just in from Stitch: Introducing Singer, Open Source ETL
March 1, 2017• 2 minute read
Our partner Stitch is introducing Singer: an open source project for simple, composable ETL. Singer enables any data source to be analyzed in Mode - regardless of whether or not you're a Stitch customer.

Emily Ritter
VP of Marketing


