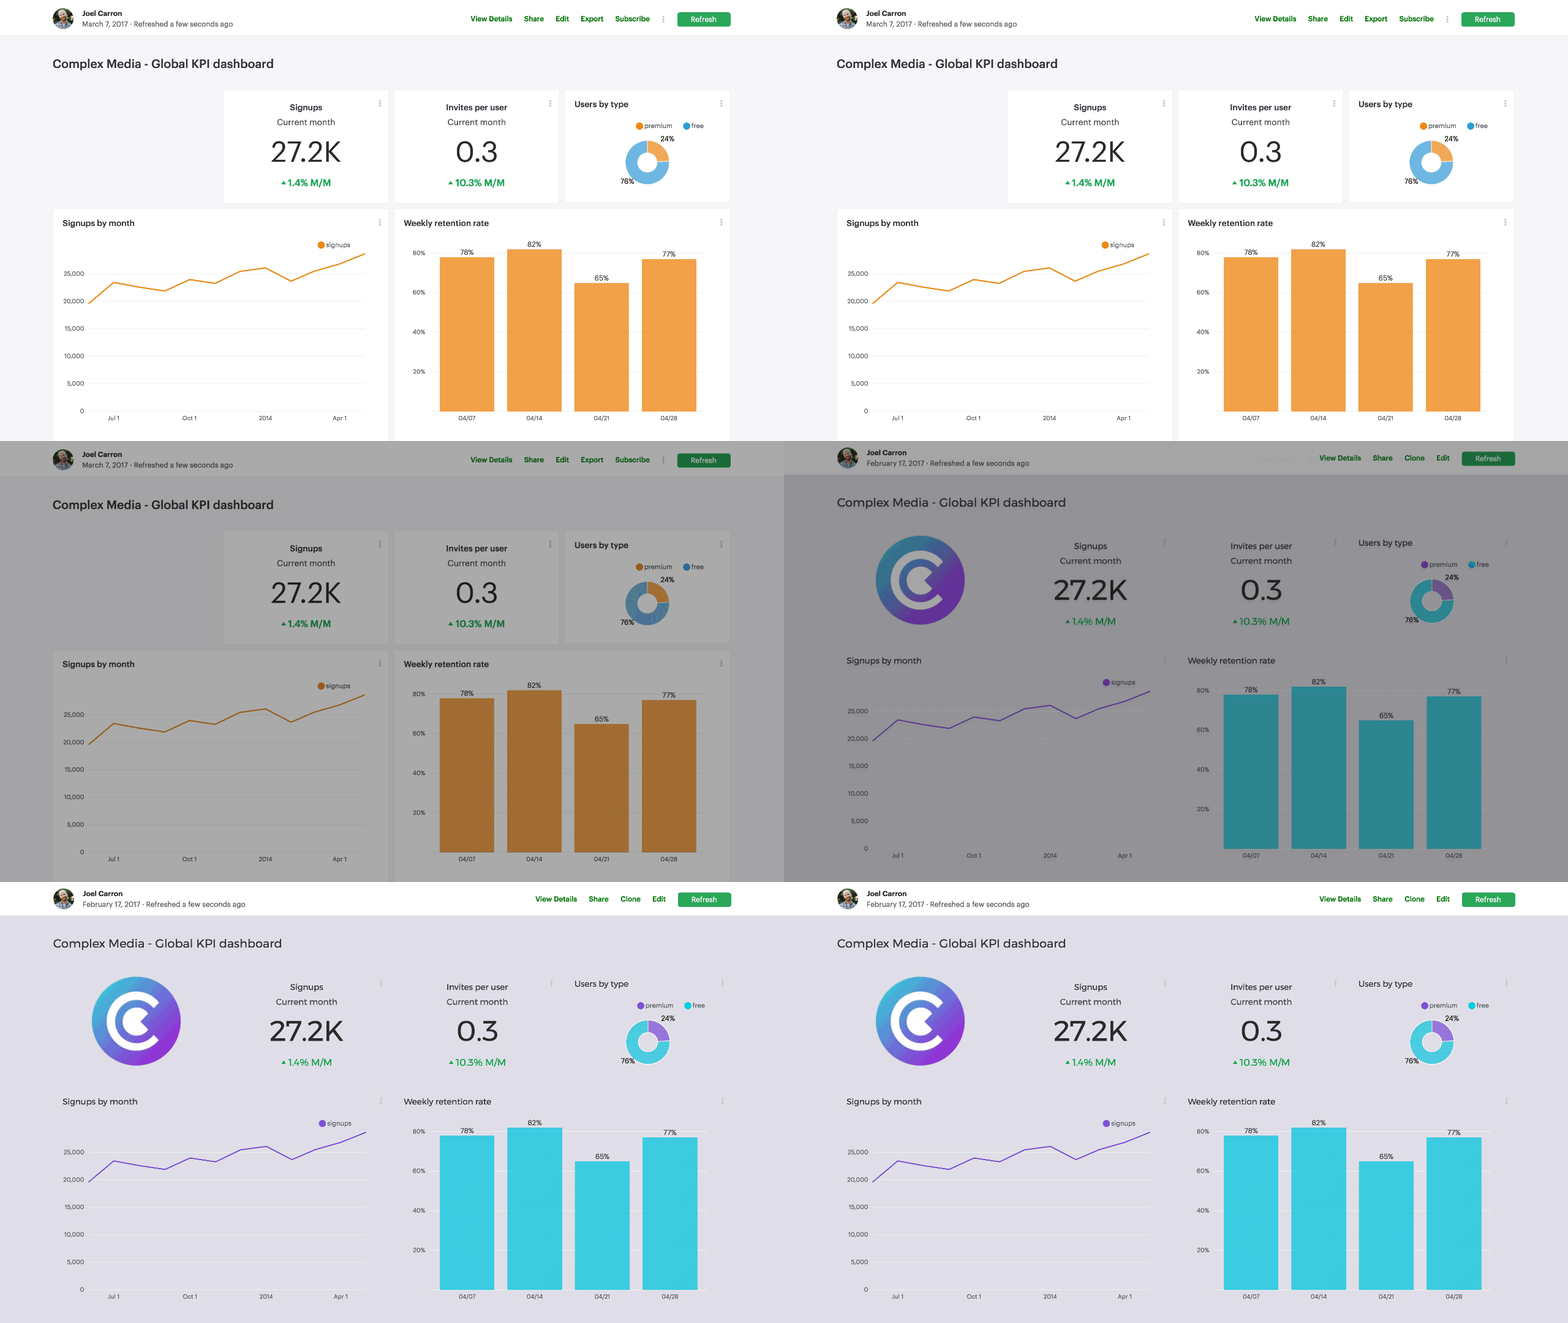
Analysts know that having the right numbers is only half the battle. In order for your work to make an impact, it has to be presented in a way that's approachable for your audience. Formatting popular reports to meet brand guidelines is a great way to ensure your work looks official and commands attention.
In addition to providing endless possibilities for building custom visualizations using SQL query results (a handful of which we've collected in Mode's community gallery, the Mode HTML Editor also enables you to customize the look and feel of our stock report elements to ensure consistency with your brand guidelines.
If you're not already familiar with our HTML Editor, check out the video below for a quick overview:
With a few small tweaks to fonts and colors, and by embedding your logo, you can transform a Mode report into a fully branded resource to share across your entire organization.
Customizing fonts
There are two steps to customizing the font family of your Mode report. First, you'll need to link to the stylesheet containing your desired font family. While you can link to a stylesheet hosted by any accessible domain (including your own), you'll find many font families are available publicly via Google, where you can automatically generate a style tag like the one below:
<link href="https://fonts.googleapis.com/css?family=Montserrat" rel="stylesheet">
Then you can reference the font family and set it as the default for your text using a CSS block:
<style type="text/css">
  html, body {
	  font-family: 'Montserrat', sans-serif !important;
  }
</style>
Setting background colors
With CSS, you can set background colors for your report and report elements.
The table below indicates which element of the report each CSS class controls:
| Class | Report Element |
|---|---|
body |
Report background |
.chart |
Chart background |
.mode-embed .mode-object |
Chart title background |
<style>

body {
	background: #d6dbe0 !important;
}

.chart {
	background-color: #d6dbe0;
	border: none;
}

.mode-embed .mode-object {
	border: none;
	background: #d6dbe0;
}

</style>
Pro tip: Upload your CSS as a stylesheet and reference it with a single style tag
You can make it easy to reference custom colors and styles across reports by compiling your CSS to a single block and uploading it to a repo like Github.
  html,
  body {
	  font-family: 'Montserrat', sans-serif !important;
	  background: #d6dbe0 !important;
  }

  .chart {
	  background-color: #d6dbe0;
	  border: none;
  }

  .mode-embed .mode-object {
	  border: none;
	  background: #d6dbe0;
  }
Then you can apply all the custom goodness to your report with a single style tag:
<link rel="stylesheet" href="[stylesheet_url]">
Customizing chart series colors
To customize chart series (including color and opacity) check out this guide from Mode's community gallery.
First add the stylesheet link and script tag below to the top of the HTML:
<link rel="stylesheet" href="https://mode.github.io/alamode/alamode.min.css">
<script src="https://mode.github.io/alamode/alamode.min.js"></script>
Next, add the customizable snippet at the bottom of the HTML. You’ll find the ID for each chart in the pre-populated HTML code in a line that looks like this: <mode-chart id="chart_a35da37ee90c" dataset="dataset" options="chart_options"></mode-chart>.
<script>
  alamode.customChartColors({
	  charts: ["chart_a35da37ee90c"],
	  colors: {0: "#895FD8",1: "#1ACCE0"}})

	  alamode.customChartColors({
		  charts: ["chart_c7e360617d80"],
		  colors: {0: "#895FD8"}})

		  alamode.customChartColors({
			  charts: ["chart_688a6aef5b60"],
			  colors: {0: "#1ACCE0"}})

			  alamode.customChartColors({
				  charts: ["chart_92acf812eb5c"],
				  colors: {0: "#``1ACCE0"}})
</script>
Embedding a brand logo
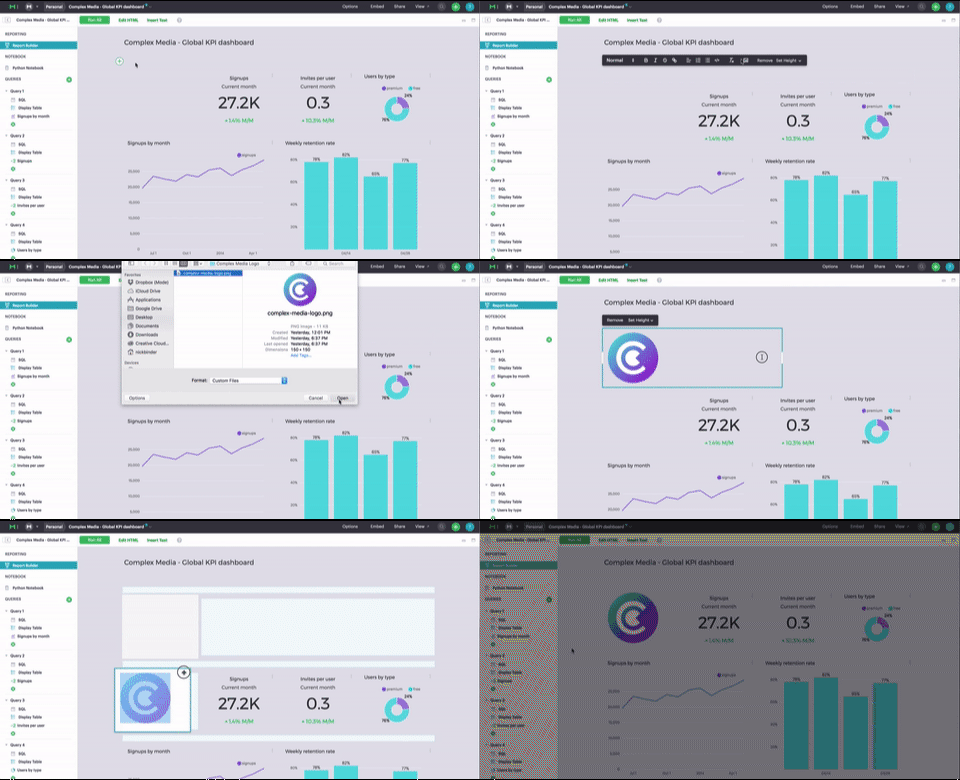
The text elements feature makes it easy to embed a brand logo in your report. Follow these simple steps:
- In the Report Builder, click on the Insert Text button at the top of the screen
- Click on the image icon
- Select the file containing your brand logo and upload it. If you don't have a logo yet, consider using a logo maker to design one quickly and easily

This is just the beginning of what's possible with the HTML Editor. In addition to the options mentioned here, you can customize axes, element sizes, and build completely custom visualizations. For some inspiration, check out Mode's community gallery.


