
Mode Help
The Mode Playbook
Report overviewWhich group of user events correlates with higher retention rates?
Reading this reportInterpreting these resultsUsing this with your dataStep-by-step instructionsDatabase notes
Which group of user events correlates with higher retention rates?
This article helps you get started with the Metrics that Matter - Part II report from the User Retention Playbook.
We recommend opening the report in another window or tab so you can consult the methodology and set-up steps as you explore the report. If you'd like a bit more of an overview of how Mode Playbook reports work generally, please read this article.
Report overview
The Metrics that Matter - Part I report in this playbook helps find individual features that might matter for retention. But it's also possible that there are mixes of actions---two site visits plus a purchase, or three new followers and one new followee---that correlate retention even more. This report lets you explore those feature combinations, and how they relate to retention.
Reading this report
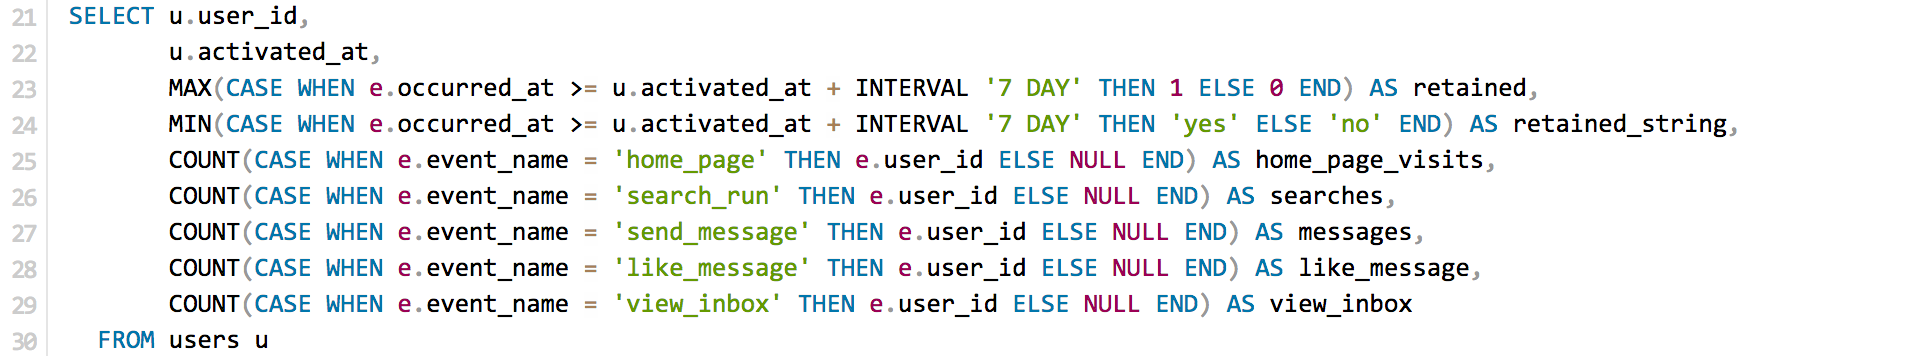
This report compares the number of times users' take actions in their first week to the likelihood that they return in their second week (7 to 14 days after they first sign up). For those interested in different length windows (maybe you want actions taken in their first three days, and care about 28-35 day retention), both of these windows are adjustable---the first 7-day window is defined on lines 23 and 24; the second is defined by line 34.
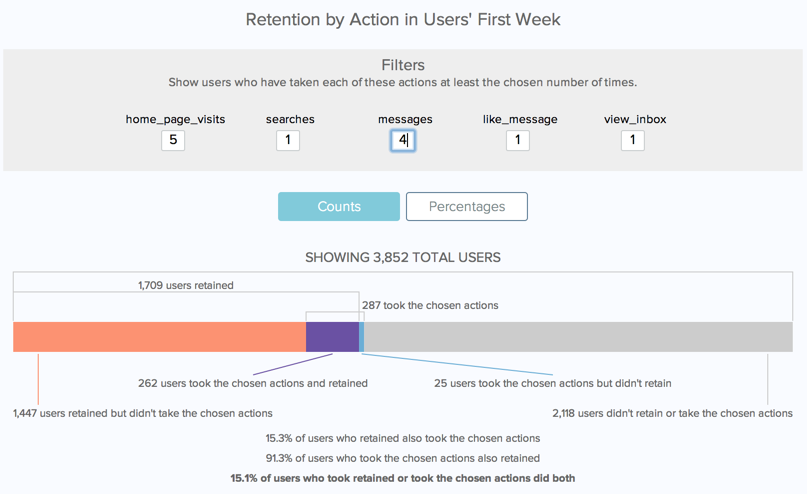
The actions you want to select are defined in the grey filter box. Enter a number for each action, and the report will update to show the overlap between retention and users who took each of those actions at least the chosen number of times. For example, suppose you have three actions---viewed_homepage, made_purchase, and invite_friend. If you select 2 for viewed_homepage, 1 for made_purchase, and 0 for invite_friend, the users defined as taking the chosen actions would only be those who viewed the homepage at least twice and made at least 1 purchase.
The graphic shows the overlap between these users taking the chosen actions and the users who retain. The bars, which are labeled in the graphic, mean the following:
- Red-orange: Users who retained, but didn't do the chosen actions.
- Purple: Users who took the actions and retained.
- Blue: Users who took the actions but didn't retain.
- Grey: Users who didn't retain or take the actions.
Three lines of text are below the bars. The first line shows the percentage of users who retained who also took the action. Suppose that you're looking at one action: make_purchase. Suppose further that out of 100 new users, 50 users retained, 30 purchased something in their first week, and 20 users did both. This line would then show the number of users who retained and purchased something (20) divided by the number who retained (50)---which would read 40%.
The second line shows the percentage of users who took the action who also retains.Taking the example from above, this line would then show the number of users who purchased something and retained (20) divided by the number of users who purchased something (30)---which would read 66.7%.
The final line shows the amount of overlap between retention and this action. Mathematically, this is calculated as the number of users who retained and took the action divided by the number who did either (graphically, it can be thought of as the size of the purple bar divided by the size of the purple, blue, and red-orange bars put together). The higher this number, the more strongly this feature correlates with retention.
Interpreting these results
This report allows you to uncover a few things. First, by entering different combinations of numbers, you can find which combinations of actions actions are most common among new users, and which are rare.
Second, you can find which combinations most strongly correlate with retention. Because stronger correlations mean that users who take that action are likely to retain and that users who retain are likely to take that action, this metric weeds out infrequent actions that are only taken by power users.
Using this with your data
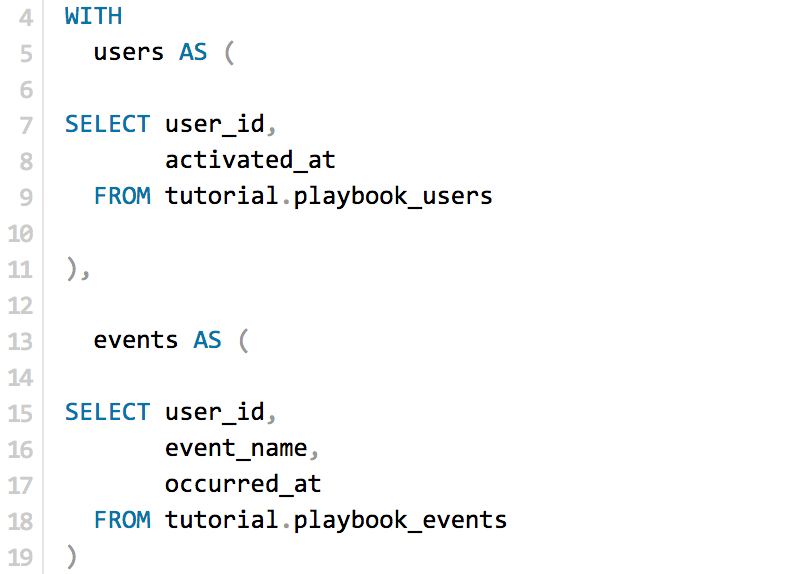
This query the standard events and users tables. The event table should include both the events that you want to measure retention against, and the events that you want to use to define someone who retained. These retention events are typically logins, purchases, or page views.
The names of these events also have to be defined in the query, in the final SELECT statement. For each event you define in the event table that you want to consider, you should add a line to this SELECT statement like the following:
COUNT(CASE WHEN e.event_name = [your event] THEN e.user_id ELSE NULL END) AS [your_event]
Step-by-step instructions
-
From the Report, click the
 button to the right of Export and then click Duplicate.
 -
In the box that pops up, select the Workspace you want to duplicate the report to.
-
Modify the common table expression (more info) in lines 4-19 to reference your database tables and relevant columns.
-
Modify lines 25-29 to reference the column names you added in Step 3. Follow the format described above. Add additional events as needed.
-
Click Run.
-
Click Report and then Publish to change the report name and description.
-
Share with your colleagues.
Database notes
One part of this query can be database-specific. For details on how to adapt these to your database, see our Database Notes.
- Adding or subtracting a fixed time period to a date. This function is used on line 23, 24, and 34.