
Mode Help
The Mode Playbook
When do customers churn?
This article helps you get started with the When Do Users Slip Away? report in the Customer Behavior Playbook.
We recommend opening the report in another window or tab so you can consult the methodology and set-up steps as you explore the report. If you'd like a bit more of an overview of how Mode Playbook reports work generally, please read this article.
Report overview
When thinking about when to reach out to users who might be slipping away, it's important to know when they're actually about to churn. If a customer who's made four purchases on your site hasn't made one in 25 days, are they lost? Or will they likely show up again? This report helps answer that question by finding how many customers---after not having taken an action for a certain amount of time---take that chosen action again.
Reading this report
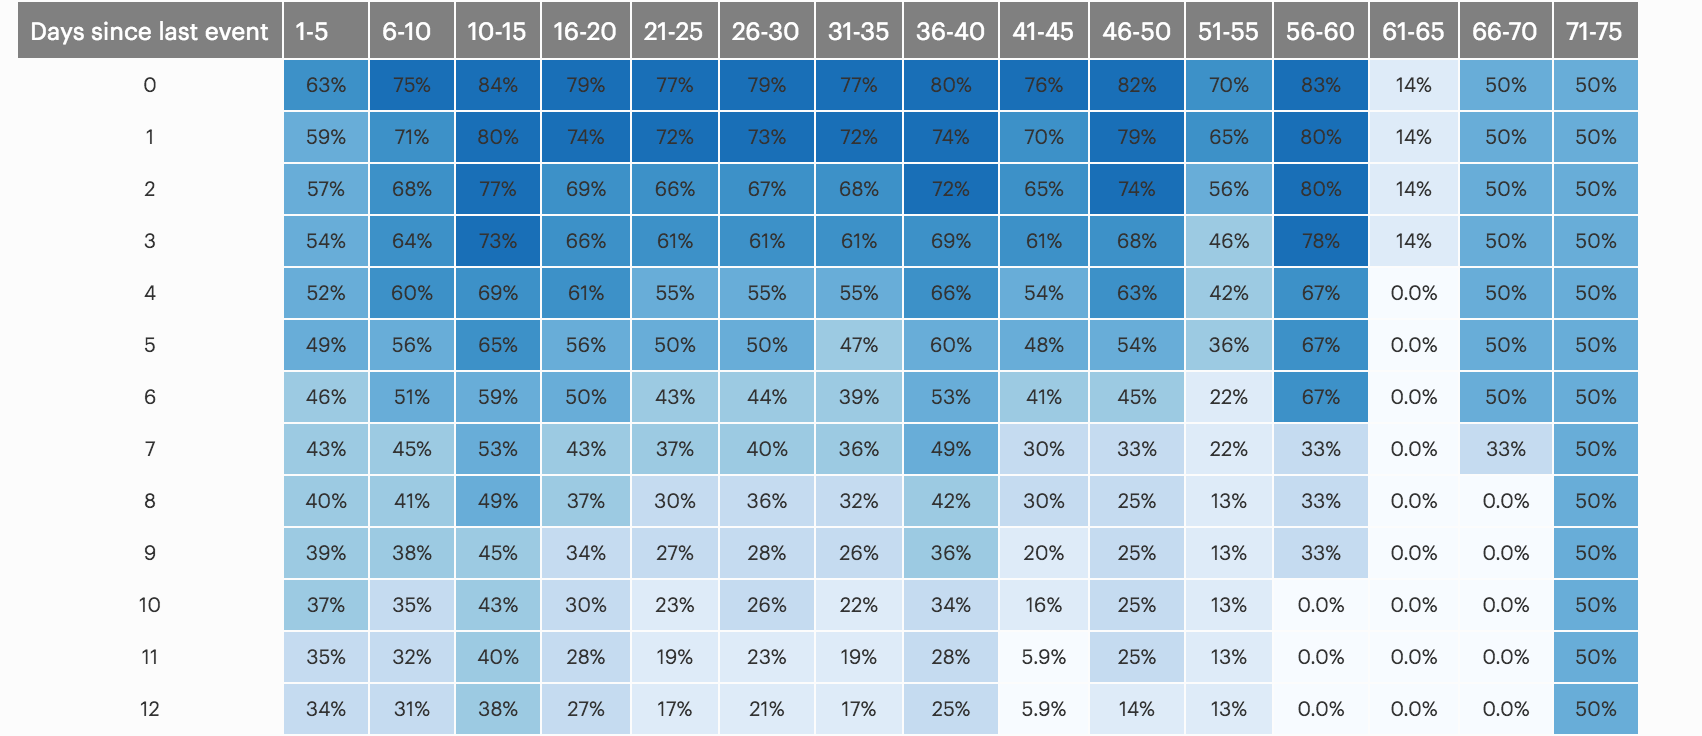
The report shows the percentage of users who take a chosen action after having not taken that action for a given number of days. It also breaks customers apart by the number of times they've taken that action previously. For instance, the time it takes a customer who's only made one purchase to slip away is likely different than the time it takes a customer who's made 50 purchases. The action in the example is sending messages, but it could be purchases, logins, site visits, or any other action that customers or users might regularly take.
Each cell represents the percent of users who have already taken an action the number of times at top of the column, and haven't take the action in the number of days on left. For example, in the image above, the third column and third row has a value of 71%. This cell implies that, of customers who have taken the action between 6 to 10 times but haven't taken that action in 1 day, 71% of customers take the action at least one more time. For some cells---especially those on the bottom right of the table---only a few users may have reached that state (e.g., it's unlikely that many customers have made 66-70 purchases and not made one in 80 days). To see how many users have ever been in that state---in other words, the denominator of the cell percentages---change the report parameter to "number of users"; and update the results.
One other detail is worth mentioning: This table excludes any days that are less than 30 days old. Because it's impossible to know when a customer has truly left---someone could be gone for years and then reappear---this report determines that a customer has left after they took the final chosen action. However, for customers who took their final action in the last 30 days, they may not have returned simply because they haven't had time to do so. Depending on your product, the appropriate length of this window could be different---it can be adjusted on line 88 of the query.
Interpreting these results
The table can be read from top to bottom and from left to right. As you move down the table, you can how customers' chances of returning changes as the time since their last purchase increases. For example, in the example report, users who have sent 1-5 total messages send another message 54% of the time if their last message was 3 days ago. If the gap increases to 4 days, only 52% of users send another message, and if the gap increases to 50 days, only 8.8% of users send another message.
Reading from left to right, you can see how these percentages are affected by users' previous behavior. Customers who have taken the action a lot in their lifetimes---say, users who have sent a lot of messages, made a lot of purchases, or logged in regularly---may slip away at different rates than new users who are just trying out your product.
These results can help determine when you should reach out to users and bring them back your product. Sending an email to a customer who's likely to return anyway might irritate that customer, while waiting too long to reach out could allow more of your customers to slip away. This report can help inform when to take these interventions for which users.
When interpreting the results, it's important to be mindful of the denominators of each cell. For some cells---especially those on the bottom right of the table---only a few users may have reached that state. To see how many users have ever been in that state, change the report parameter to "number of users"; and update the results.
Using this with your data
This report requires the standard events table.
Step-by-step instructions
-
From the report, click the
 button to the right of Export and then click Duplicate.
 -
In the box that pops up, select the Workspace you want to duplicate the report to.
-
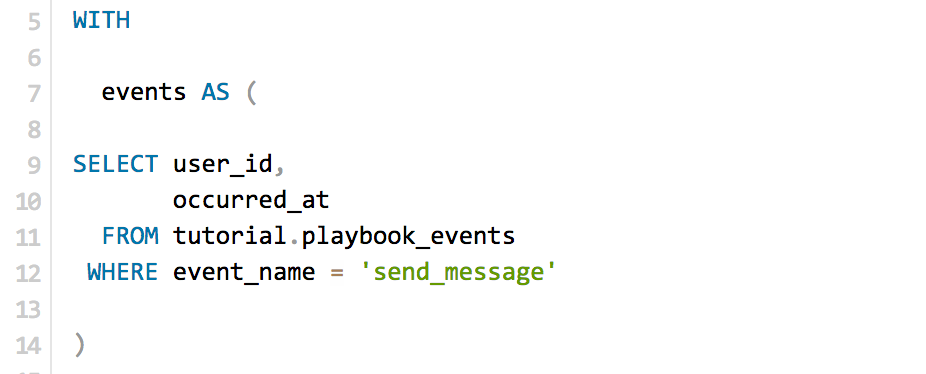
Modify the common table expression in lines 5-14 to reference your database tables and relevant columns. Note: If you're analyzing Segment SQL database, please read this article.
-
Click Run.
-
Click Report and then Publish to change the report name and description.
-
Share with your colleagues.
Database notes
Three parts of this query can be database-specific. For details on how to adapt these to your database, see our database notes.
- Current timestamp function. This function is used on lines 82 and 87.
- Generate a incremental series. This is used on line 78. To use this in Redshift, replace line 38 with the following:
FROM (SELECT ROW_NUMBER() OVER (ORDER BY occurred_at) - 1 AS counter FROM (SELECT * FROM events LIMIT 101)) c - Window functions. The
COUNT() OVER ()function is used on line 83, theROW_NUMBERfunction is used on line 84, and theLEAD()function is used on line 86. - Difference between two dates. This function is used on line 82, 86, and 87.