
Mode Help
The Mode Playbook
Report overviewHow do users flow through my product or website?
Reading these reportsInterpreting this reportUsing this with your dataStep-by-step instructionsDatabase notes
How do users flow through my product or website?
This article helps you get started with the How Users Move Through Your Product report in the Customer Behavior Playbook.
We recommend opening the report in another window or tab so you can consult the methodology and set-up steps as you explore the report. If you'd like a bit more of an overview of how Mode Playbook reports work generally, please read this article.
Report overview
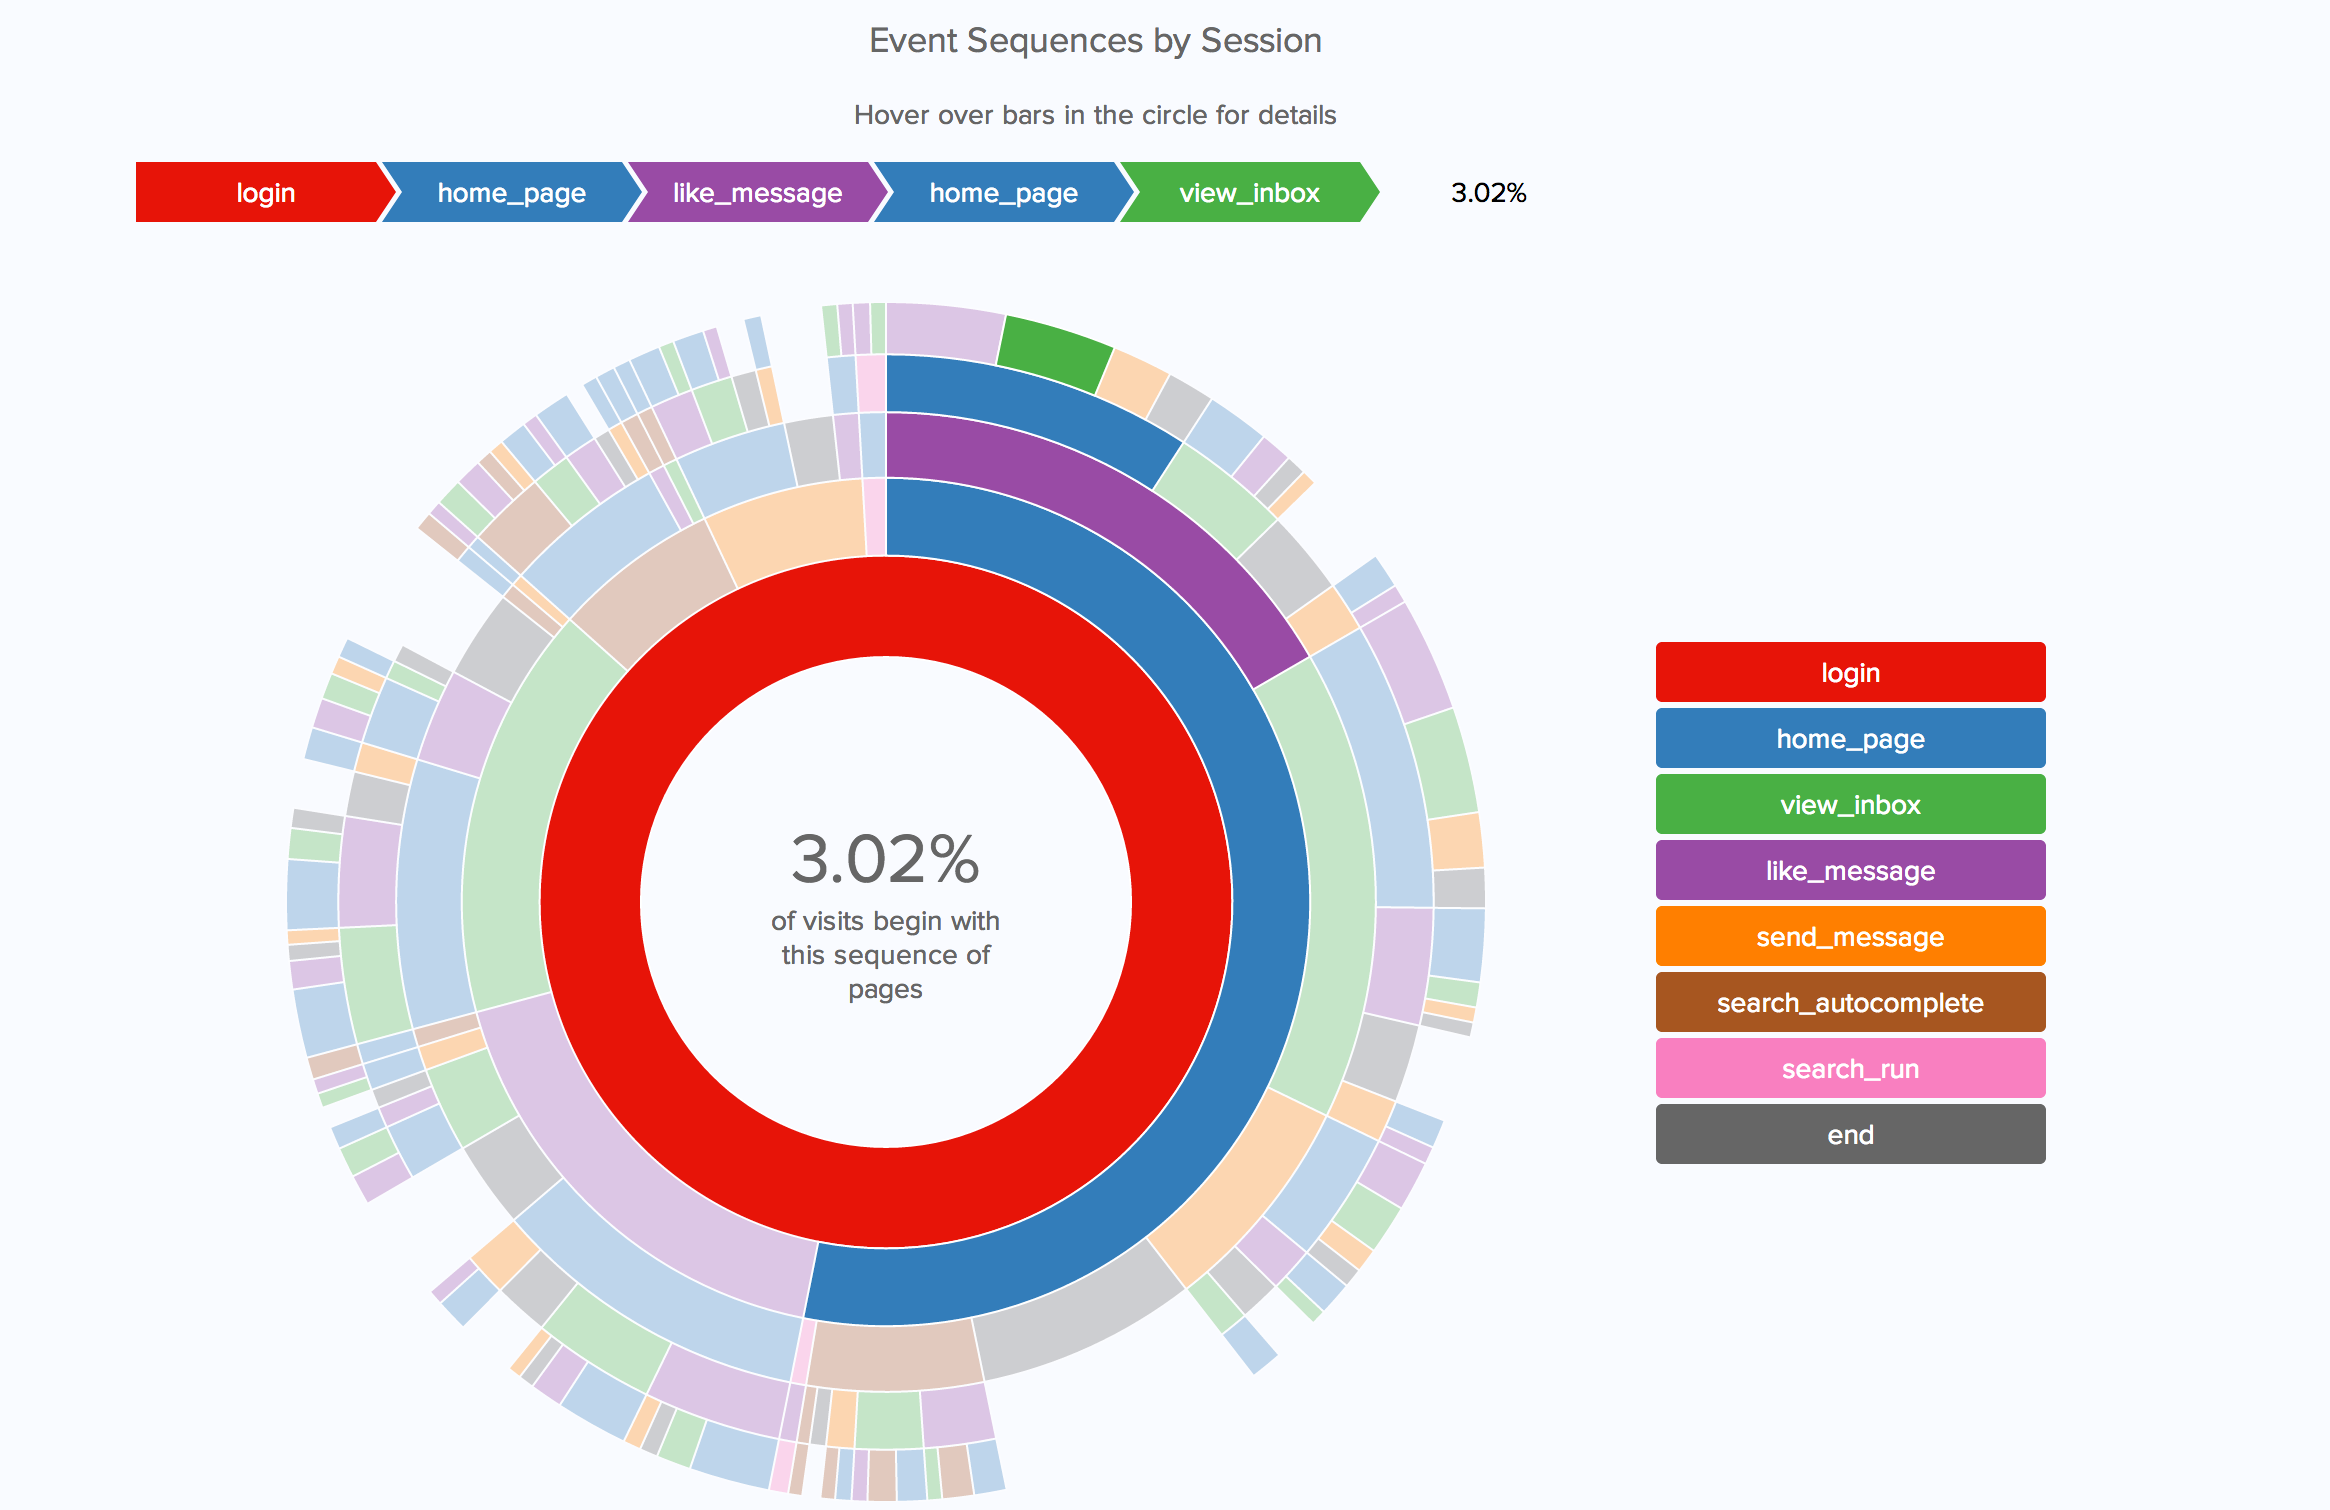
This report is a type of user flow diagram that describes how customers move through your website or app. It shows which actions they take first, second, and third in unique sessions, and helps identify the most common flows through your product. It also shows when users abandon their sessions. Understanding these flows can help explain what customers what to do when they first arrive, when they leave, and when they struggle to get from one place to another.
Reading these reports
The report shows a colored wheel, often known as a sunburst chart. (Credit to Kenny Rodden for the chart code.)The inner-most circle represents a users' first actions in a session. The second circle represents their second actions; the third circle represents their third; and so on. The size of each section represents the percentage of users who followed exactly that path of actions to start their session. Hover over a section of the circle highlights that particular progression, and shows the percentage of users who followed it.
If a user's session ends, that event in marked in dark grey. Note that the white spaces in the outer circles correspond with these grey bars, as there can be no next event after a session has ended.
Sessions are defined as a break in actions of at least 30 minutes. If you'd like to change this interval, it's defined on line 43 of the query.
Interpreting this report
Though interpreting the report is fairly straightforward, a couple details are worth bearing in mind.
First, sessions are defined as gaps in action of at least 30 minutes. This interval may not make sense for some products. Netflix, for instance, likely has very long gaps between user actions, as some users may watch a two-hour movie without ever taking any actions. Other apps that are checked regularly, such as Facebook Messenger, may have much shorter gaps between sessions.
Second, it's important to remember that what users do is not necessarily a reflection of what they want to do. If most people go from a home page to a featured articles page, they may be doing that because that's where they want to go---or they may be doing it because the featured articles link is huge, and distracts from any other actions. In this regard, user behavior is often a combination of what they want to do and what they're directed to do.
Using this with your data
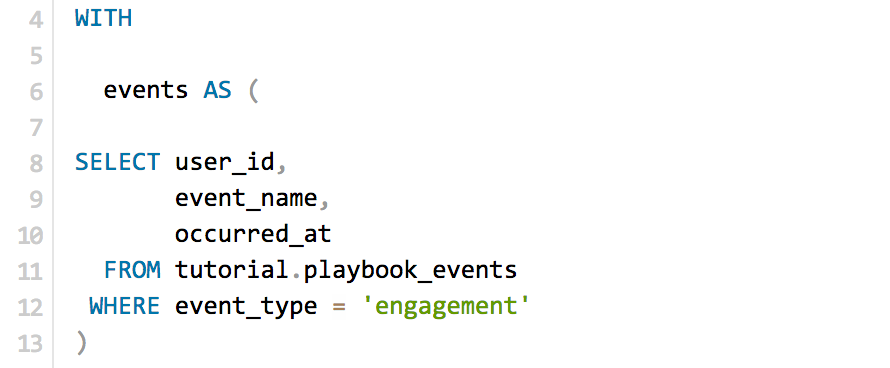
This report requires the standard events table. This table should include all the events that you to include in your sequence chart. While you can exclude some events, leaving events out could interfere with how sessions are defined. Sessions are identified by gaps between chosen events, rather than by gaps in all events. Leaving out events could create larger gaps than actually exist, and insert artificial session breaks in cases when users are actually just moving around parts of the product that were excluded from the event table.
Additionally, identifying sessions can be computationally expensive. For this reason, it's recommended that you run this query on relatively narrow time windows (given how quickly products can change, this is also recommended from an analytical perspective as well).
Step-by-step instructions
-
From the report, click the
 button to the right of Export and then click Duplicate.
 -
In the box that pops up, select the Workspace you want to duplicate the report to.
-
Modify the common table expression in lines 4-13 to reference your database table and relevant columns. Note: If you're analyzing Segment SQL database, please read this article.
-
Click Run.
-
Click Report and then Publish to change the report name and description.
-
Share with your colleagues.
Database notes
Two parts of this query can be database-specific. For details on how to adapt these to your database, see our database notes.
- Window functions. The
ROW_NUMBER()function is used on lines 34 and 39, theLEAD()function is used on line 38, and theLAG()function is used on line 44. - Difference between two dates in minutes. This function is used on line 43-45.