
Mode Help
The Mode Playbook
Getting StartedWhich customer engagement campaigns were effective?
IntroductionReading this reportInterpreting these resultsUsing this with your dataStep-by-step instructionsDatabase notes
Which customer engagement campaigns were effective?
Getting Started
This article helps you get started with the How Effective are Interventions? report in the Customer Behavior Playbook.
We recommend opening the report in another window or tab so you can consult the methodology and set-up steps as you explore the report. If you'd like a bit more of an overview of how Mode Playbook reports work generally, please read this article.
Introduction
The way customers interact with products changes over time. Often, those changes occur gradually, but sometimes, behavior dramatically changes around a single event. Re-engagement emails, promotional discounts, or the discovery of a particular feature could make customers much more engaged with your product. Conversely, a bad experience, an accidental email, or a delayed order could push customers away.
This report helps identify how these acute actions affect the way users interact with your product. The report shows average user engagement levels before and after an event occurred. Engagement---like the intervention event---could be defined in numerous ways. It could represent the percent of users logging in, the average amount spent per day, or the number of page visits.
Reading this report
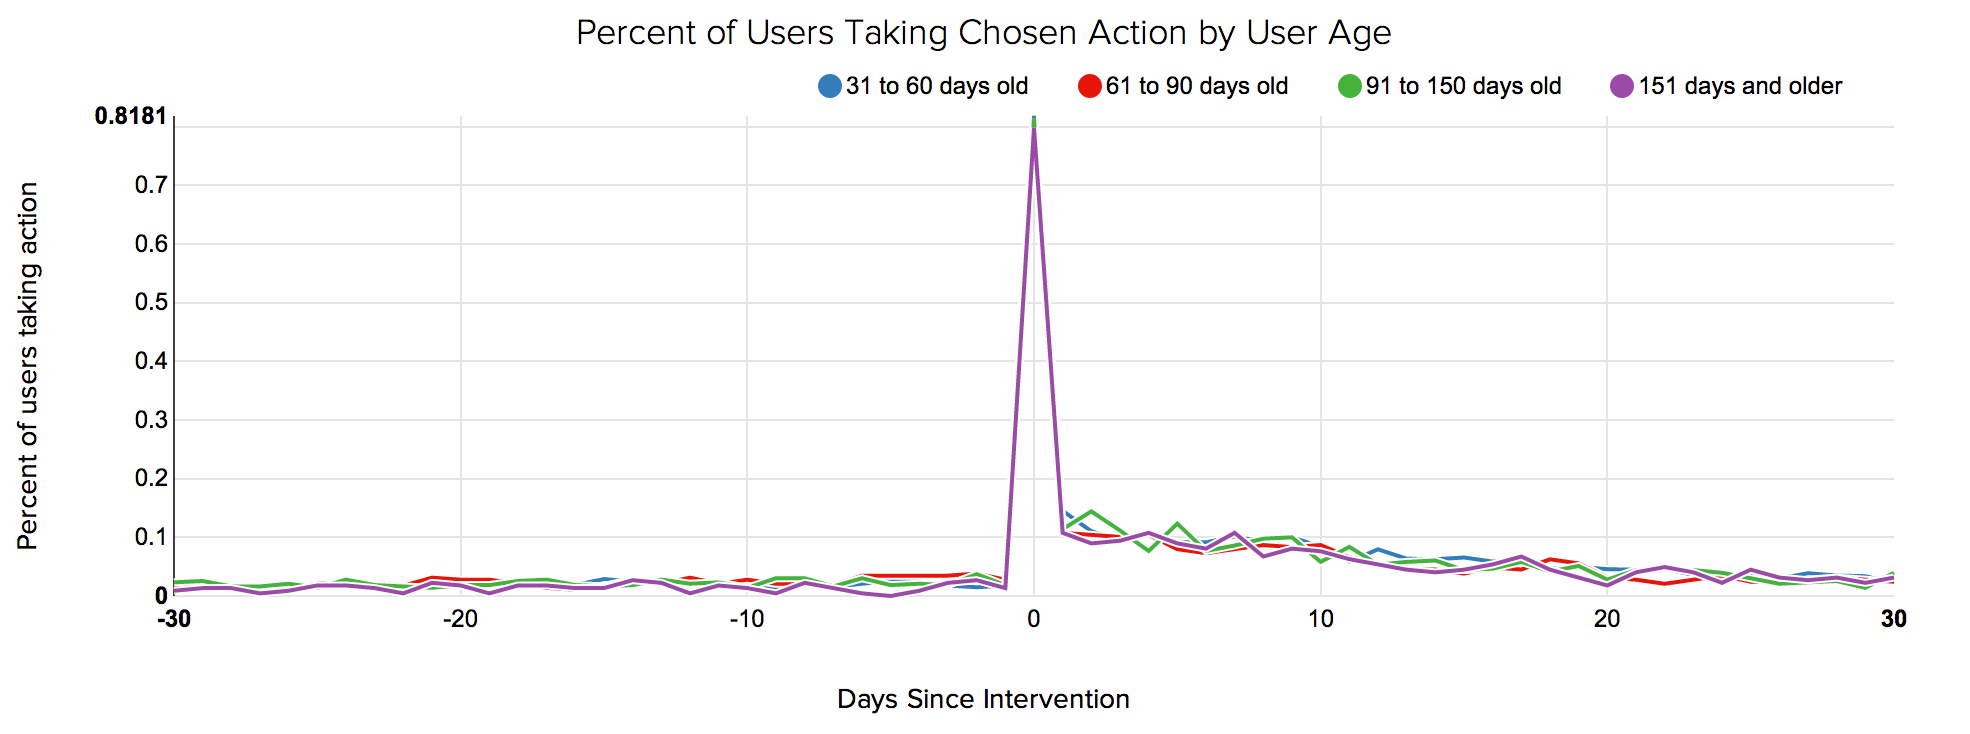
The report presents a simple line graph with several series. The graph shows average engagement levels in the thirty days before and after the intervention event. In this example report, engagement levels are defined as the percent of users who took an action on each day. The graph also shows four lines---each one represents a different age cohort. Ages are defined by how old the user was on the day the intervening action took place (0 on the x-axis).
The graph above defines engagement levels via login events. The intervention event is a re-engagement email. For example, the "61 to 90 days old"; line has a value of 0.0174 where the x-axis equals -30. This means that only 1.74% of customers who were between 61 and 90 days old the day they received a re-engagement email logged in 30 days prior to receiving the email. The same line has a value of 0.1076 where the x-axis equals 1. This means that 10.76% of customers who were between 61 and 90 days old the day they received a re-engagement email (the same cohort as before), logged in 1 day after getting the email.
These age cohorts are defined in the final SELECT statement. These age windows can be adjusted to fit what's appropriate for your product.
Importantly, the report only includes cases when the intervention event occurred at least 30 days after the user first signed up. It also only considers intervention events that occurred at least 30 days ago. These checks ensure that the different points on each line don't represent different numbers of users. (For example, if intervention events that were only 10 days old were included, some customers that were included where the x-axis equals 5 wouldn't be included where the x-axis equals 15).
Interpreting these results
The results can show how engagement levels change after an intervention, and if those changes persist over time. Critically, the results in this report don't represent a true test of how effective the intervention is---an increase or decrease in engagement could be caused by something else.
This is particularly true in two cases. First, if the intervention event is triggered by some other user action, the change in engagement after the intervention event may reflect the change in user behavior that caused the intervention event to be triggered. For instance, suppose an e-commerce site offers a $10 gift card to customers after they spend $100 dollars. If people spend more money after they receive the gift card, it may because the gift card changed their behavior---but it's more likely that customers got the gift card because they began spending more money on the site.
Second, interpreting changes before and after an intervention event can be tricky if that event occurs at the same time for all users. For example, if Uber offers a one-time promotion to deliver kittens, every Uber customer receives that promotion at the same time. Behavior changes after the promotion could because of the kittens, or could be because of changes to the Uber app, to prices, or to the market after the promotion. In other words, if the intervention occurs at the same time for everyone, it's very difficult to determine if changes are caused by the intervention or by other factors that also affect all your customers at the same time.
Using this with your data
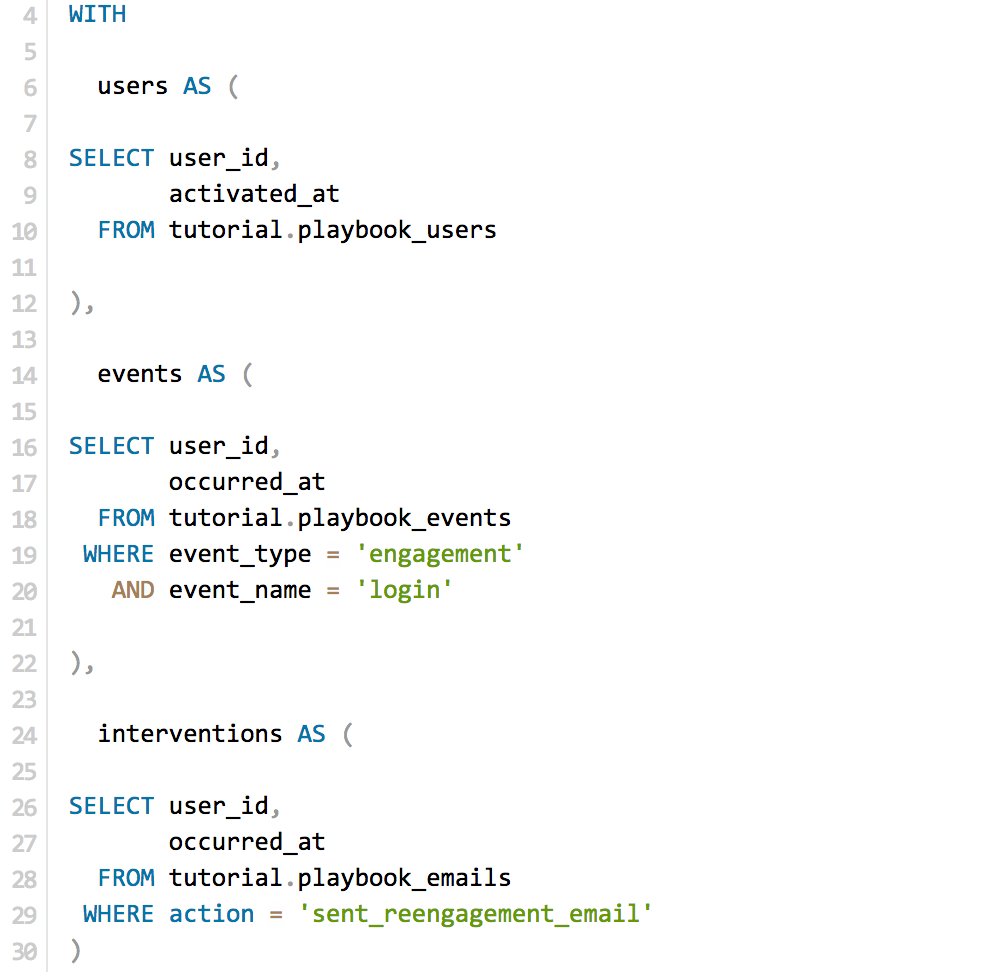
This query requires three tables. It requires the standard events and users tables, as well as table of intervention events. This third table, which could be list of emails, promotions accepted, or unfulfilled deliveries, can often be subsets of an events table.
Step-by-step instructions
- From the report, click the
 button to the right of Export and then click Duplicate.
 - In the box that pops up, select the Workspace you want to duplicate the report to.
- Modify the common table expression) in lines 4-30 to reference your database tables and relevant columns. Note: If you're analyzing Segment SQL database, please read this article.
- Click Run.
- Click Report and then Publish to change the report name and description.
- Share with your colleagues.
Database notes
Three parts of this query can be database-specific. For details on how to adapt these to your database, see our Database Notes.
- The
NOW()function, used on line 58, generates the a timestamp for the current date and time. - Generate a incremental series. This is used on line 52. To use this in Redshift, replace line 38 with the following:
JOIN (SELECT ROW_NUMBER() OVER (ORDER BY occurred_at) - 31 AS counter FROM (SELECT * FROM events LIMIT 61)) c - Difference between two dates. This function is used on line 43, 57, and 58.