
Mode Help
The Mode Playbook
Report overviewHow do I customize user cohorts to explore user retention?
Reading this reportInterpreting these resultsUsing this with your dataStep-by-step instructionsDatabase notes
How do I customize user cohorts to explore user retention?
This article helps you get started with the Retention Cohorts report from the User Retention Playbook.
We recommend opening the report in another window or tab so you can consult the methodology and set-up steps as you explore the report. If you'd like a bit more of an overview of how the Mode Playbook reports work generally, please read this article.
Report overview
While the first report in this Playbook shows how retention rates evolve over time, this report shows an example of how retention could be affected by other factors. This report looks into how well users retain depending on the day of the week that they first signed up, which could be particularly important for enterprise or education products.
Moreover, this report offers a generic example of how to analyze retention by cohort. Other cohorts, such as signup source, user device, or user location, could also provide insight into what affects user retention.
Reading this report
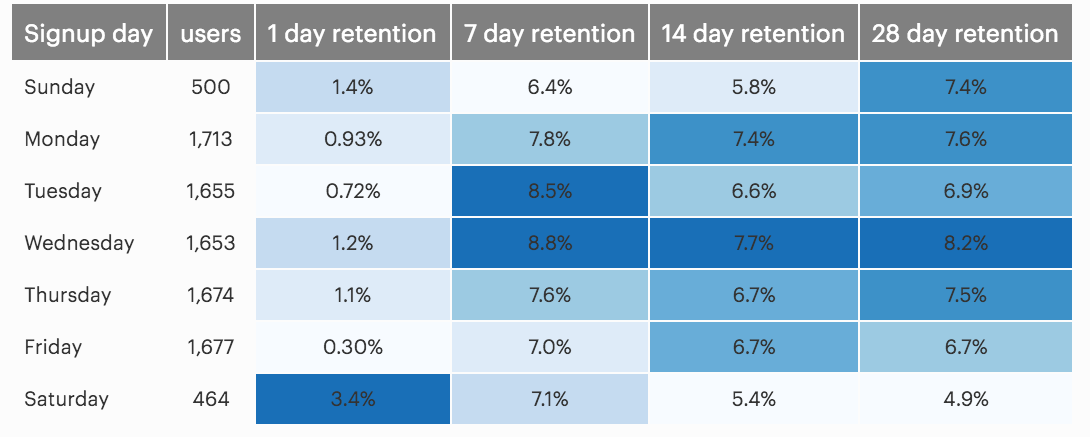
The left column of the table shows the days of the week. The second column shows the number of users who signed up on that day. The third column shows the percent of these users who retained for 1 day---they returned 24 to 48 hours after first signing up. Column four shows 7-day retention (returned 7 to 14 days after signing up); column five shows 14-day retention (returned 14 to 21 days after signing up); the final column shows 28-day retention (returned 28 to 35 days after signing up).
Interpreting these results
Reading these results is fairly straightforward: higher retention rates are generally better. However, always take note of the of each sample---often the sources with the highest and lowest retention rates will be those with only a few signups.
Also, it's important to remember that for Friday and Saturday, 1-day retention metrics may not be valuable. This is particularly true for enterprise products, which are likely to see large drops in usage outside of business hours.
Using this with your data
This query uses the standard events and users tables. The event table should include the events that you want to use to define someone who retained. These retention events are typically logins, purchases, or page views. This type of report can be expanded to a variety of cohorts, including signup source, user device, and user location.
Step-by-step instructions
-
From the Report, click the more
 button to the right of Export and then click Duplicate.
 -
In the box that pops up, select the Workspace you want to duplicate the report to.
-
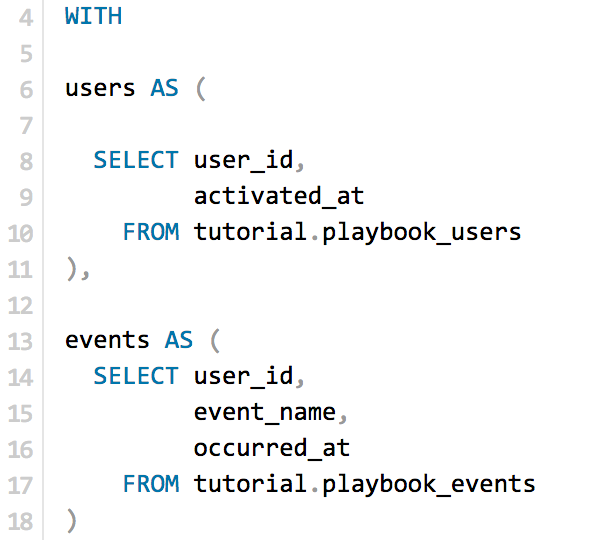
Modify the common table expression (more info) in lines 4-18 to reference your database tables and relevant columns. Note: if you're analyzing Segment SQL database, please read this article.
-
Click Run.
-
Click Report and then Publish to change the report name and description.
-
Share with your colleagues.
Database notes
Two part of this query can be database-specific. For details on how to adapt these to your database, see our Database Notes.
- Adding or subtracting a fixed time period to a date. These functions are used on lines 29 through 36, 41, 43, 45, 47, and 53.
- Day of week calculations. A function calculating the day of the week is used on line 39. Note that for MySQL, the day of week numbers on lines 20 through 26 will all need to be increased by 1.