


We move fast at Mode. This means we often find ourselves talking a lot about what’s next, but not always about the existing features and workflows that make analysts’ experience in Mode so powerful.
We know data teams are moving faster than usual to produce answers, so we’ve taken a moment to put together a list of handy shortcuts for Mode power users.
These were compiled “for” and “by” Mode power users, and we’ve found that some of these actions drive just as much efficiency and delight as some of our bigger releases. To ensure you won’t already know all of the tips on this list, we’ve sprinkled in one or two exciting, new updates.
Here’s our list of shortcuts for Mode power users.
Analyzing data
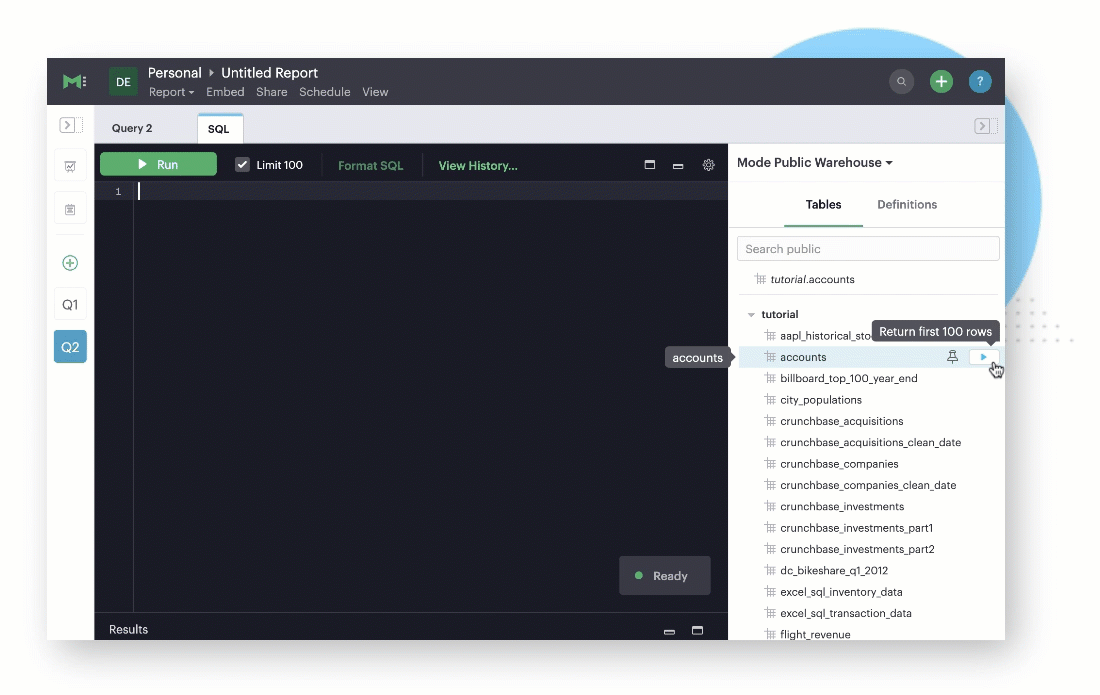
Click to preview
Sometimes, you just want to take a quick peek inside a table to see what columns it contains or how the data has changed. To do just that, click on the Play button beside any table in your schema browser and Mode will return the first 100 rows by injecting a simple query at the top of the editor. I’ve also found this to be particularly handy for more novice SQL writers who are just getting started, as a miniature play button can feel much less intimidating than a blank code editor staring back at you.
Note: The Play button is not available for certain database types, including those that charge on a per-query basis.
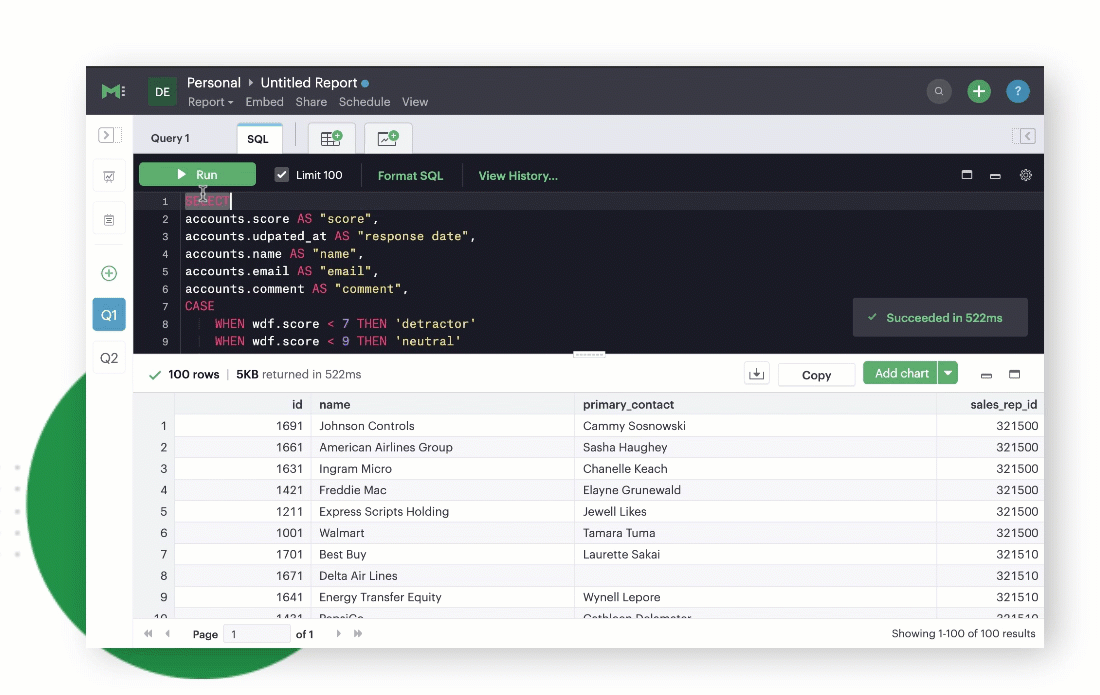
Highlight to run
Iterating really quickly? Want to test out some scratch work? Run a specific portion of your SQL code at any time by highlighting a portion of your code and clicking on the Run Selected button.
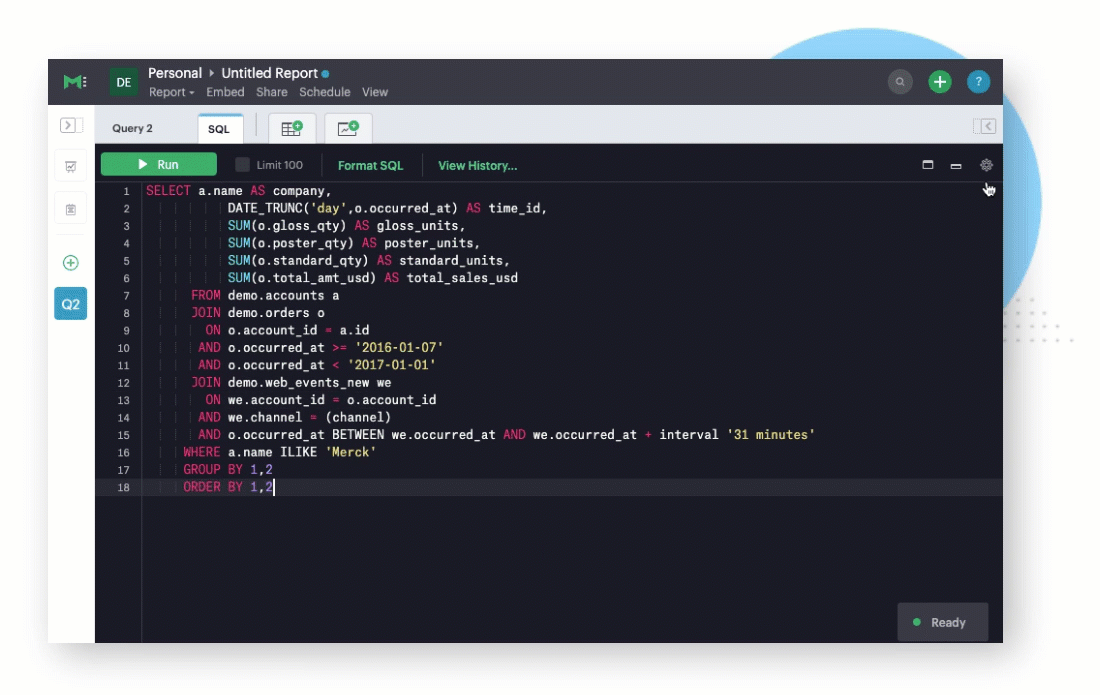
Return to a previous query using query history
It’s inevitable that we’ll need to return to a previous version of our SQL or run up against syntax errors from time to time. Luckily, every query in Mode contains a version history that includes:
- the raw code for each iteration (as written)
- the rendered code (the SQL sent to the database after processing any additional Liquid code)
- the data that was returned
Select a historical query run and click Open to replace the code currently in the query editor with the code from a previous run.
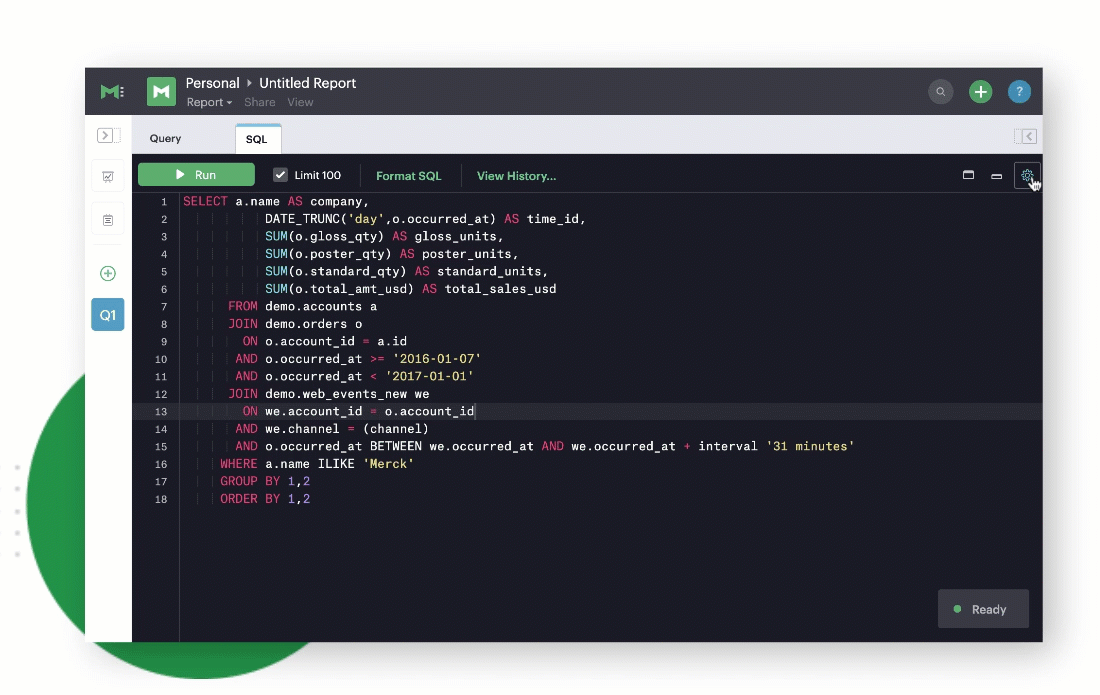
Customize your autocomplete settings - NEW

Turns out not everyone enjoys having their SQL keywords autocompleted in uppercase. We hear you LOUD and clear, no pun intended, and figured it was best to let y’all decide. In addition to customizing autocomplete keyword formatting, we’ve added a number of other preferences to tailor your SQL interface and autocomplete editor to your liking. Adjust them from the gear menu here.
Turn off the Limit 100 default for new queries - NEW
Imagine you’ve just spent a fair amount of time crafting a brand new query. You hit the Run button excitedly only to immediately recall that a Limit 100 was applied unnecessarily. Cancel. Rinse. Repeat. If you’d prefer to specify the limit in your SQL or leave one off entirely like Bradley Cooper in the science fiction thriller Limitless, you can ensure that the Limit is always unchecked by default from here.
Visualizing data
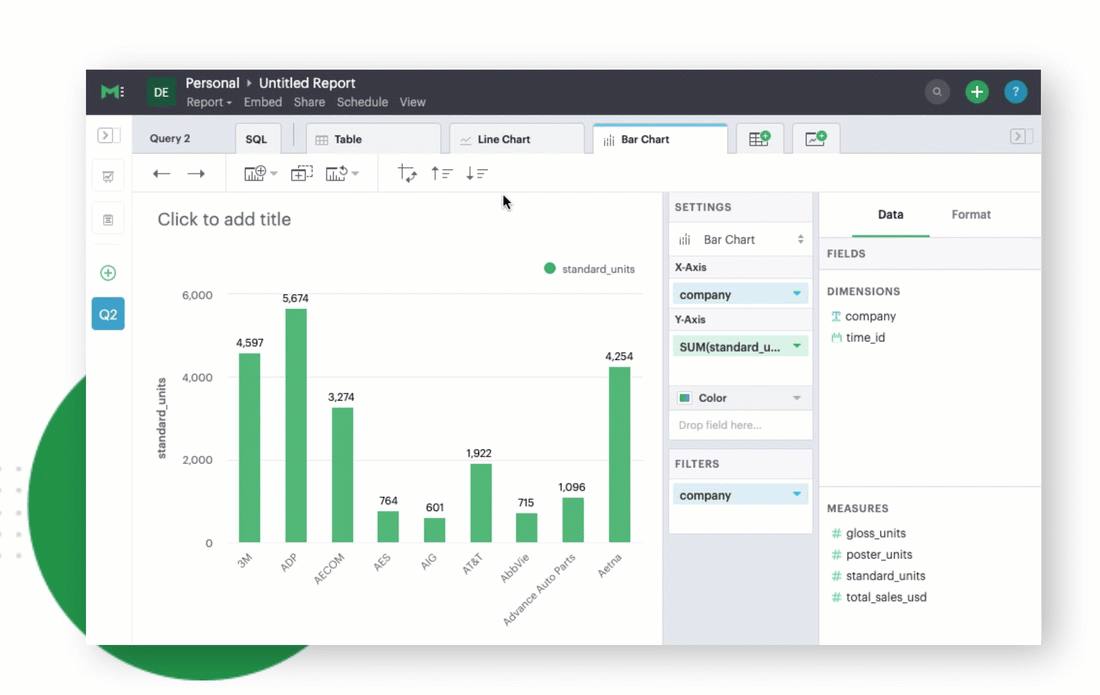
Apply quick sorts on charts
Hopefully, this one speaks for itself. These toolbar buttons help you sort...quickly! Sort your discrete, categorical data by a measure in either ascending or descending order (ex. sales rep by total sales) by clicking on the actions here.
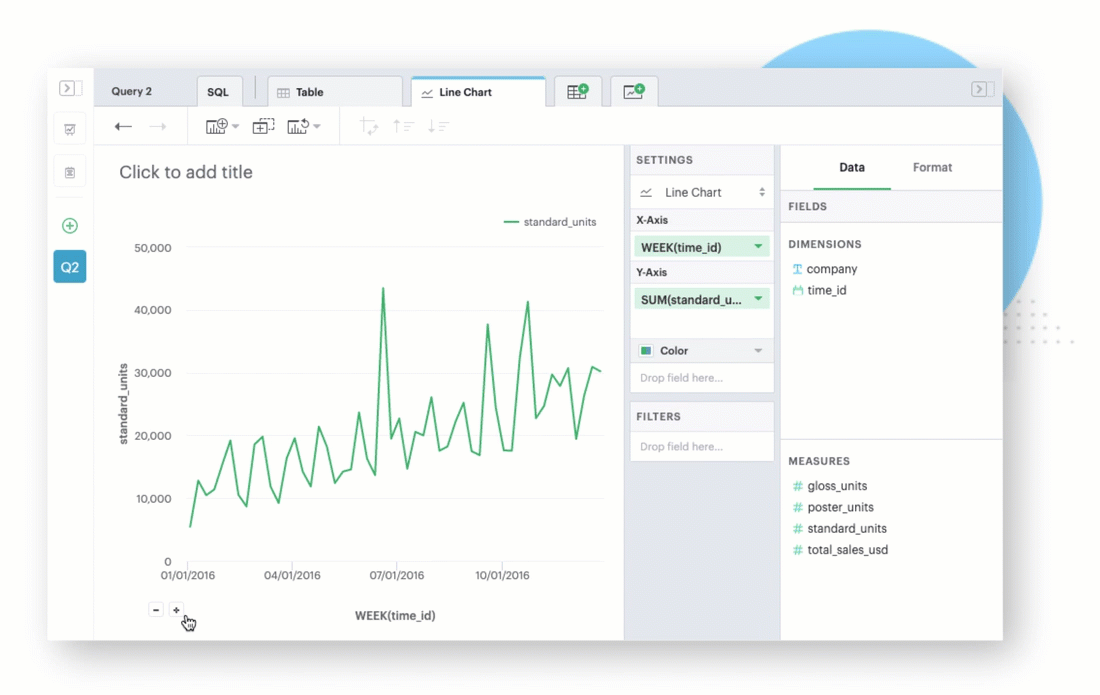
Toggle between data granularities
By default, date fields are broken up into different levels of granularity. When hovering over a chart in a report or building one in the editor, use the buttons located in the bottom left corner to quickly cycle through different date specificities.
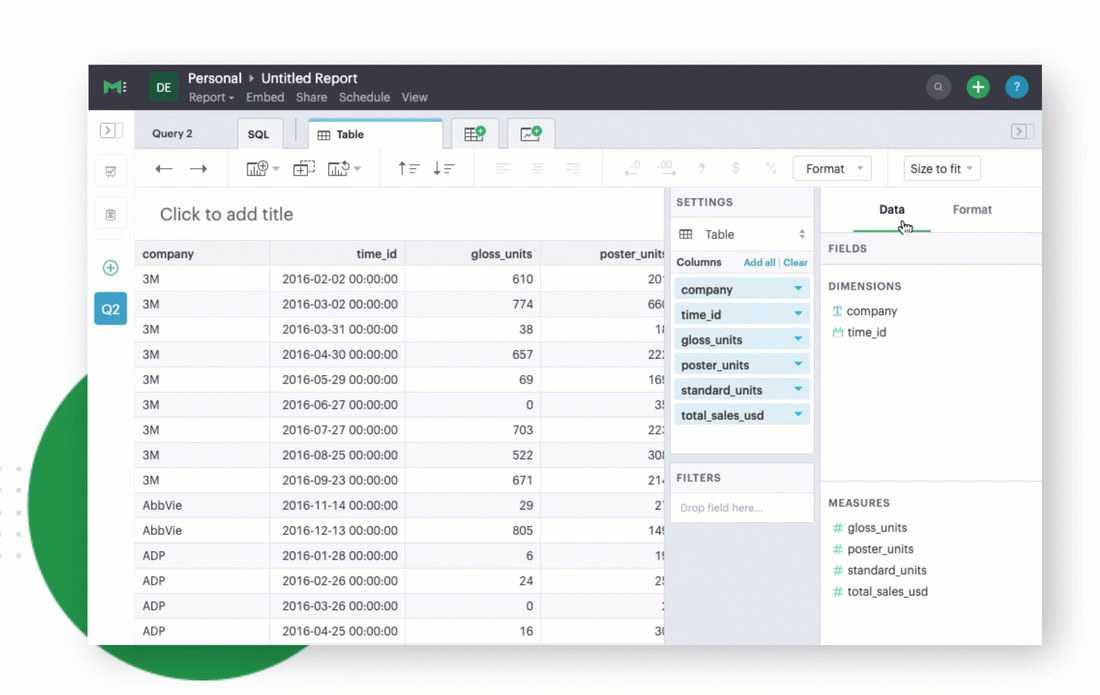
Customize your table formatting
If there’s one design principle our President Benn Stancil loves more than any other, it’s density. When we introduced our new table chart type, we made sure to include preferences to allow users to easily toggle between different data densities, hide and show dividers and row numbers, and customize the color of zebra striping. Access all of these preferences by creating a table chart and navigating to the format tab.
Preparing your reports
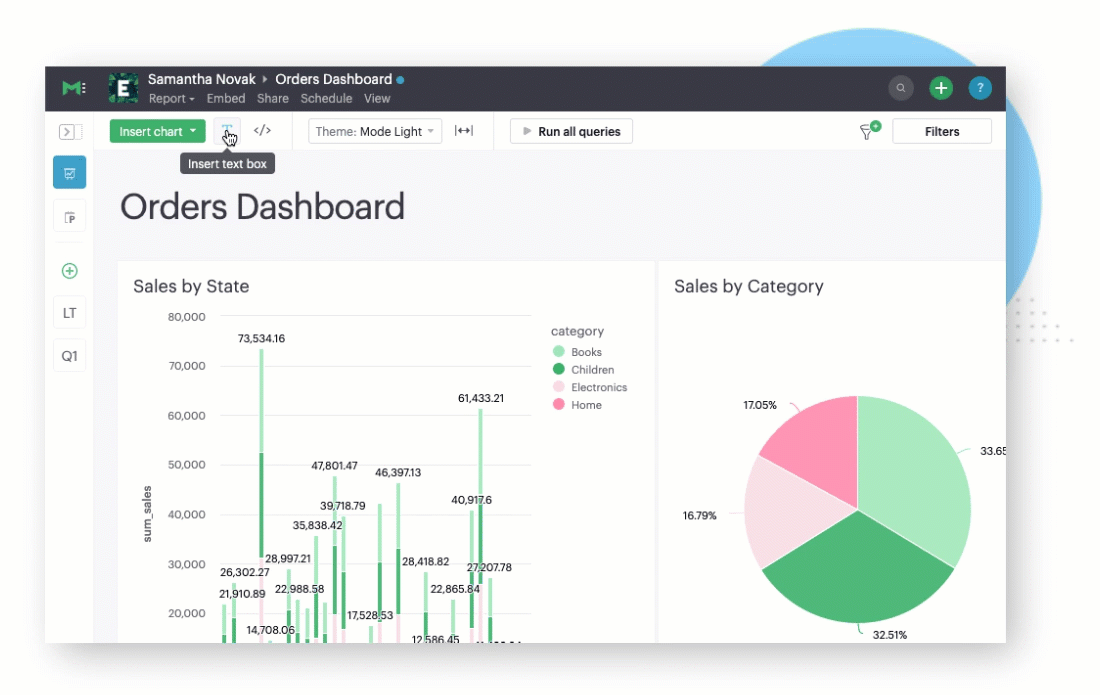
Add images to a report
As a product designer, I feel compelled to say that a “picture is worth 1,000 words,” but that would be very cheesy. All jokes aside, adding images to reports can come in handy for a host of reasons. Want to make things feel more polished? Upload a hero image. Want your dashboard to be more on-brand? Add your company logo. Want to attach a GIF of an adorable puppy to place alongside your chart? We won’t judge.
Easily upload an image to your report by creating a text box in the Report Builder and clicking on the image icon in the text box toolbar.
Choose a different out-of-the-box theme
I have taken great comfort in the ability to quickly change my Zoom virtual backgrounds over the last few weeks. Similarly, when editing a report you can select one of Mode’s out-of-the-box themes to change the backgrounds, chart containers, fonts, and more. Switch themes by clicking the Theme dropdown and selecting an available theme or creating one of your own! We recently gave the entire Report Builder a facelift to help make these preferences even more discoverable, so feel free to change things up whenever the mood strikes.
Disable report runs
I’m not saying that sometimes I get so excited for fresh data that I hit the Run button seconds after the last run returned, but I’m not not saying it. You can prevent manual running on a report by navigating to the Report dropdown, clicking the settings option, and toggling on “Disable runs from report view.”
Tip: you can still run the data using a schedule or from within the editor. More on that in a minute.

Set up a report to run on a schedule
Schedules are useful for delivering reports and dashboards to specific stakeholders, but they are also great for setting up a regular run cadence. When creating a schedule, simply choose the “Don’t notify me, just run the report” option from the delivery field and the report will refresh automatically at the specified time.
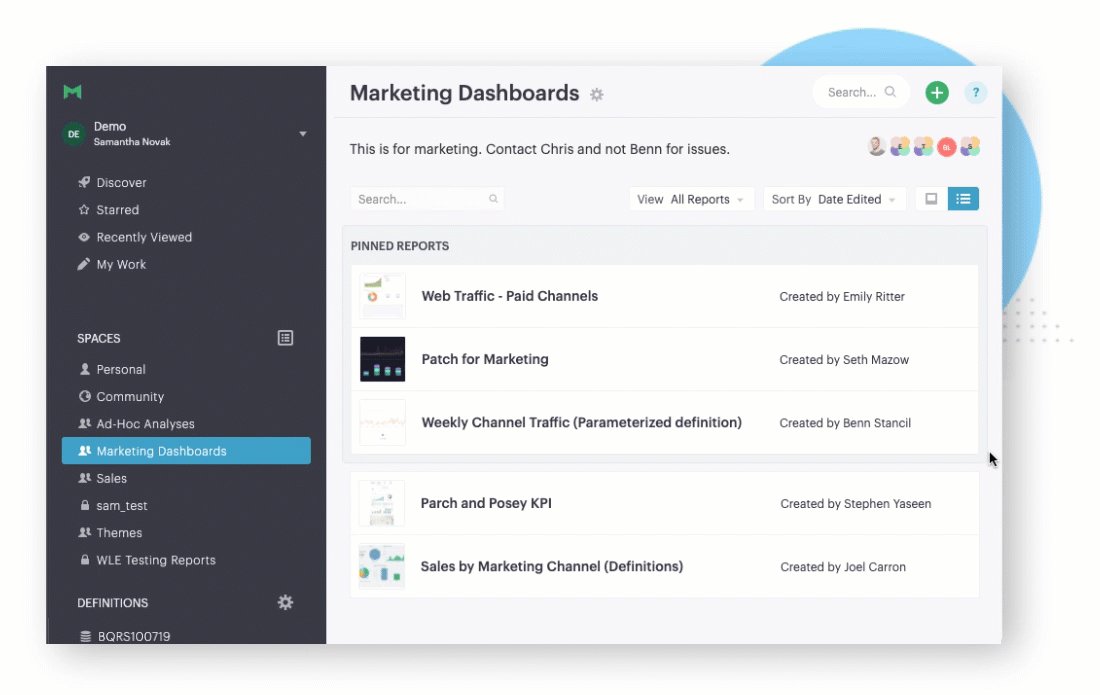
Create report shortcuts in spaces
This last trick is a particular time-saver. Have a report that’s relevant to multiple departments in your organization? Easily reference analysis across multiple Spaces by clicking on the overflow menu for any report and creating a shortcut.
We hope you enjoyed this list of shortcuts. If you're interested in learning how to use Mode to make product decisions, check out our resources page.

