Mode’s dbt Semantic Layer Integration Ensures Trusted, Explorable Metrics, Every Time

Neha Hystad, Senior Product Manager
October 18, 2022
NaN minute read

Now live: Mode's Integration with dbt's Semantic Layer
Today, Mode’s integration with dbt’s just-released Semantic Layer is live! Data teams can codify key business metrics in dbt and be sure that the metrics business teams are accessing in Mode are always right, providing increased data confidence across the organization.
The Semantic Layer is dbt’s latest product that enables data teams to centrally define key business metrics in the transformation layer and access these consistent metrics in downstream data tools, like Mode.
Our brand-new integration extends these metrics into the BI layer of the modern data stack, making trusted, governed metrics automatically available to the rest of the business.
Mode and dbt: inspire confident data exploration
In modern BI, every team is a part of the data conversation, from data engineering and data analysts to every line-of-business team. The challenge is ensuring that everyone has the right tool for their jobs and that those tools connect in ways that provide a shared understanding of the data. Mode’s integration with the dbt Semantic Layer provides a solution.
Mode’s integration with dbt Semantic Layer delivers governed metrics to everyone
Everyone gets to work where they want to work
Data teams get to create metrics in dbt, using all of the elements of dbt they know and love, and business teams get to work in their BI tool. Everyone is working from the same assumptions to drive consistency.
Automatically configured and maintained BI
Once the data team defines metrics and includes them in a dbt run, Mode automatically surfaces those metrics, making them available for business teams and anyone else working in Mode to explore and build a wide range of visualizations, using the filters, dimensions, and time grains configured in dbt.
Ad hoc deep dives for analysts
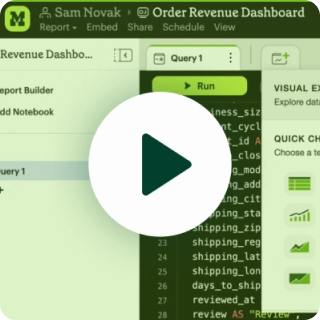
If something unexpected emerges while exploring a metric in Mode—a metric is down or; a cohort is suddenly performing exceptionally well—you can instantly inspect the code behind the metric. Since Mode’s new connection to the dbt Semantic Layer allows you to use Jinja directly in the query editor, you can quickly dive deeper into the problem using ‘dbt-SQL’ syntax.
The home for trusted business metrics
By building on top of the dbt Semantic Layer in Mode, metrics will always be consistent, –both across reports in Mode, and with other tools in your stack powered by the dbt Semantic Layer. —Mode’s integration protects against common pitfalls like summing distinct values, or averaging daily averages to get a monthly average. No matter who’s looking at a metric or how they want to view it, they can trust that it was computed correctly and consistently every time.
How it works: the right answer, every time
When thinking through data teams’ needs, we knew that trust in the data was critical to making the integration truly valuable. For Mode, that meant making sure that once the metrics were defined in dbt, business teams couldn’t accidentally redefine, reaggregate or miscalculate them when analyzing in the BI layer. At the same time, we wanted everyone to have the ability to visually explore the metrics to get the answers they needed.
Mode has its own computational engine called Helix, so in order to ensure dbt was the source-of-truth and all data computation went through dbt’s Proxy Server (part of the Semantic Layer), we needed to figure out how to prevent users from making common analytical errors when exploring the data in Mode. At the same time, we wanted to enable you to use our visualization system, which can create a wide variety of popular and complex chart types when leveraging Helix.
Our approach is two-fold. For changes that require getting new data or re-aggregating the data, Mode sends the query all the way back to dbt, relying only on the configurations built there.
However, for changes that do not require new data, such as changing a chart from a bar to a line or sorting the data, we use do rely on Helix, our data engine. This provides access to Mode’s powerful visualization system, and– especially important as company-wide usage of the Semantic Layer grows–prevents unnecessary hits to the data warehouse.
This approach sets up guardrails that enable business teams to answer their own questions and data teams to have confidence that the metric is reported correctly, every time. Metric definitions can be leveraged in the SQL Editor, too. If a metric exploration uncovers something unexpected, and analysts are called on to collaborate on ad hoc analysis, they can immediately access the SQL query generated by the dbt Semantic Layer logic, and know that the metric is calculated the same way every time. From there, they can expand their analysis, turning the dbt metrics into a starting point, rather than a dead end.
Learn more about what this integration means for the future of Modern BI.
Get our weekly data newsletter
Work-related distractions for data enthusiasts.


