
Mode Help
Explore and share data
Explorations
Overview
Create an Exploration to build one-off, personal analysis that doesn’t show up in or change the original report.
Create an Exploration
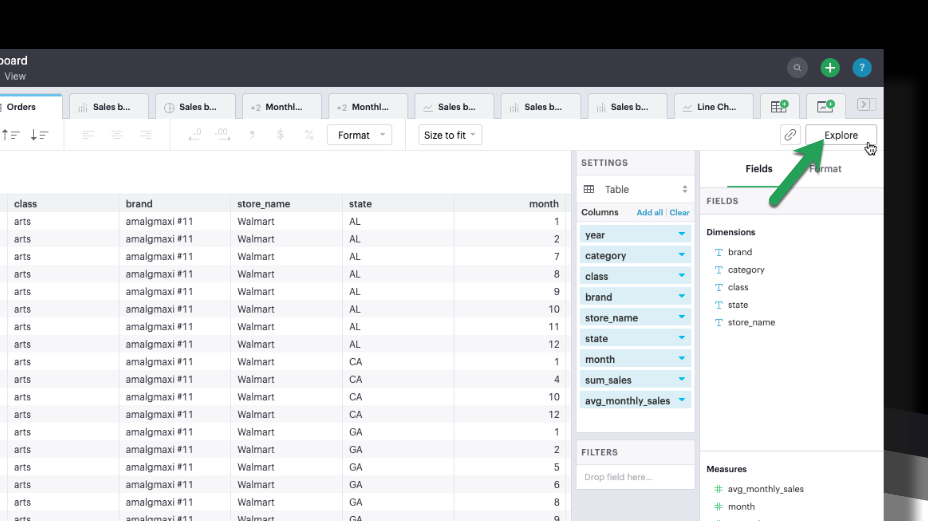
There are a few ways to begin exploring. From within the Chart editor context, click the Explore button in the toolbar of any built-in chart or table.
When viewing a Mode Report or Dashboard, hover over a visualization and click the Explore button, or click on a series to explore a more specific subset of the data.
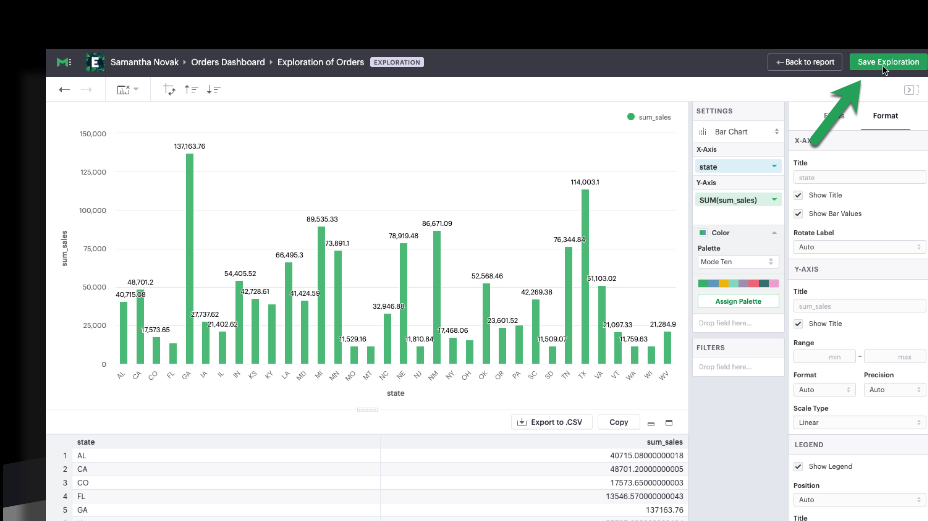
When exploring you can change the chart type, drag and drop from the list of available fields, sort, drill down, filter your data, and apply chart formatting. When you’re finished, save your analysis by clicking the Save Exploration button. When saving, you will be prompted to add a title and a description for your Exploration.
Navigating Explorations
Below, we've outlined some of the key elements that will help you find your way around Mode's Explorations.
When you begin exploring:

- ← Back to report - Directs you back to the report view
- Save Exploration - Saves a new Exploration
After you save your Exploration:

- Share - Copies the Exploration link to your clipboard
- New Exploration - Creates a new Exploration based on an existing Exploration
- Edit - Opens your Exploration in edit mode
- Details panel - View information about an Exploration such as: last run time, which report it was saved from, what query it references and which filter values were applied
When you're exploring:

- Gear icon
 - Access Exploration settings or delete the Exploration while in edit mode
 - View - When editing your Exploration, click this to open the view mode
- Fields and Format panels - Access the list of available fields in the dataset and choose from formatting options
Toolbar

- Undo/Redo - Allows you to navigate through changes
- Clear - Clears out an Exploration’s chart configuration, or its sort and filter settings
- Swap axes - Switch between a horizontal and vertical chart type configuration
- Quick sort - Sorts your discrete, categorical data by a measure in either ascending or descending order
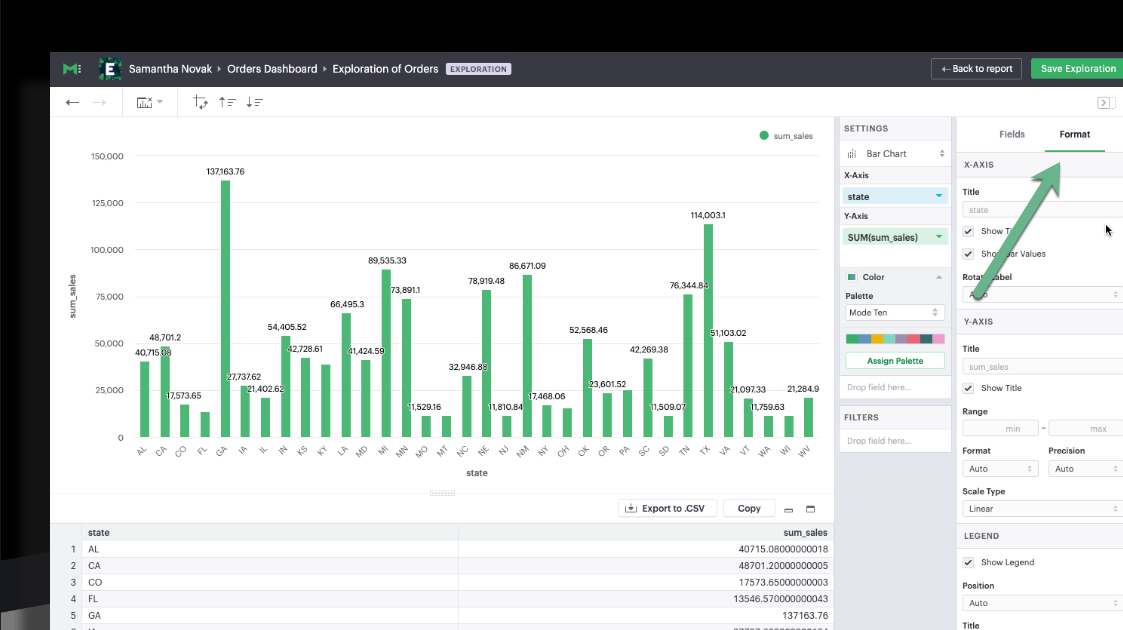
Formatting your Exploration
You can access general formatting options in the “Format” panel. You can customize labels, hide and show elements like titles, and control the placement of things like the legend from here.
Working with your data
Explorations are powered directly by data from SQL queries. Every time the data refreshes, you’ll see the latest list of available fields and your visualization will include the latest data. Qualitative data will show up as a blue field in the Dimensions section and will generate a blue pill when dragged to a chart. Quantitative data will show up as a green field in the Measures section and create a green pill when dragged to a chart.
Once you understand your list of fields, you can start dragging fields into the drop zones. Change how a pill is aggregated by clicking the pill's context menu.
Filters
When you explore in a report with filters, Mode will translate the relevant filters into your Exploration automatically. This is so the visualization will reflect what you were seeing on the report, and so that the filters will persist when you save your Exploration. Once you begin exploring, you can add or update filters.
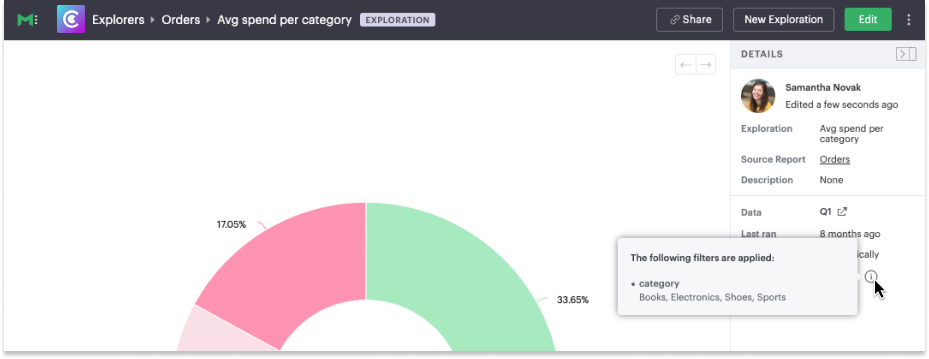
When viewing an Exploration, you can see what filters are applied by clicking on the filter’s tooltip in the Details panel.
Parameters
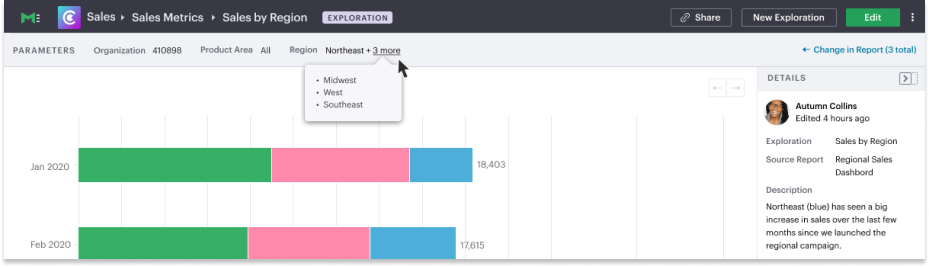
An Exploration will always reflect the latest report parameters. This means your Exploration’s data could change if someone updates the parameter values on the same report you originally explored from. At the top of your Exploration, you will see the current parameter values. Update them by returning to the report.
Copy charts from Explorations
Users can copy an Exploration into another Report.
- Copy chart to Mode clipboard: The copy to Mode clipboard icon is accessible via the toolbar, located on top of the Exploration.
- Paste chart from Mode clipboard: The paste from Mode clipboard action is available in the kebob menu for each data source in the chart designer. The paste and replace action is also available in the kebob menu for each visualization in the chart designer. The replace action can be undone using the back button on the chart toolbar. The fields that are required for the copied charts but are missing from the target data source will be displayed as red pills. The user can switch out the red pills with relevant fields from the target data source.
- Replace fields in the pasted chart: Users can drag fields directly on top of the field to be replaced in Visual Explorer and in Quick Chart dropzones that accept a single field. For Quick Chart dropzones that accept more than one field, the new field can be added to the shelf and the old field can be dragged out to be removed. The typeahead search in the dropzones can also be used to add the new fields.
Copy a chart from Explorations and paste in a Report
Copy a chart from Explorations and replace another chart in a Report
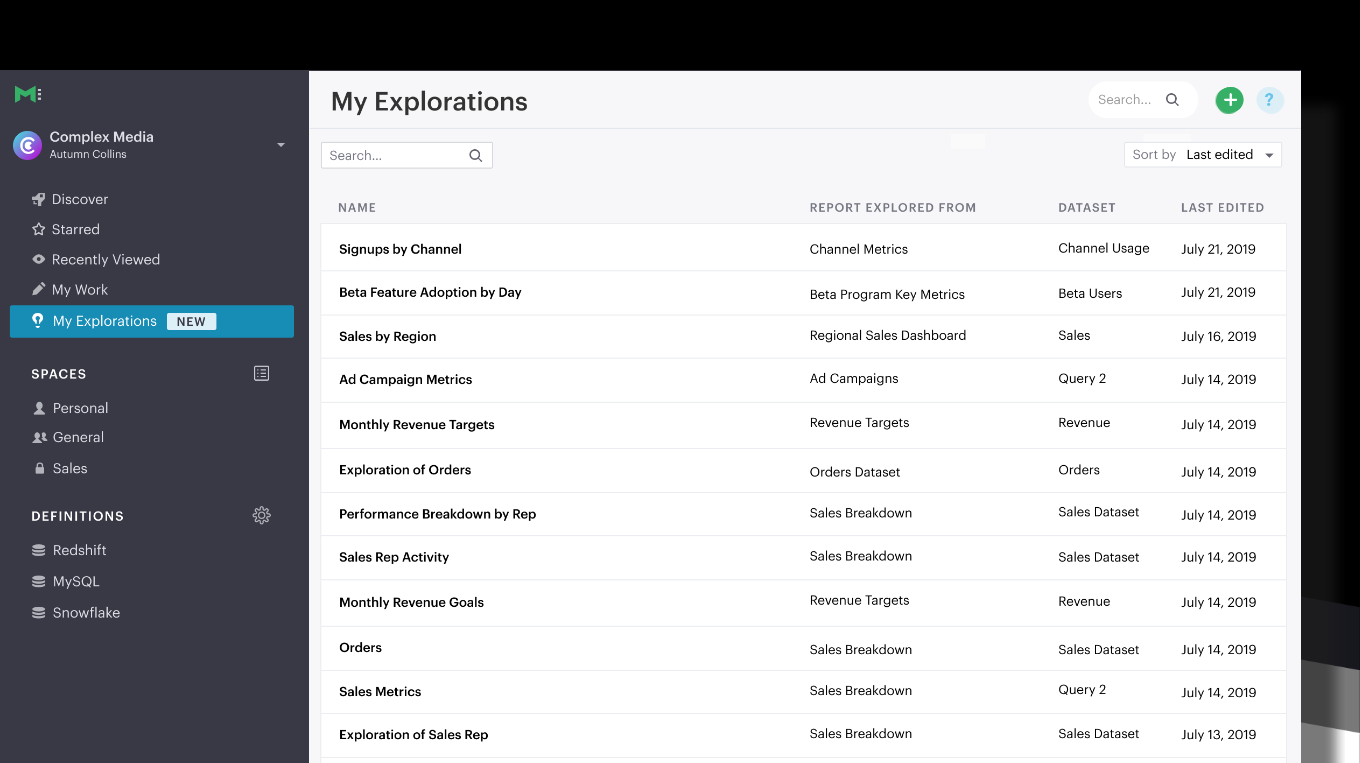
View saved Explorations
To return to any Explorations you’ve made and or view all of your saved Explorations, go to the My Explorations tab on the left side of your Mode home page. From here you can search and filter your Explorations, or view, edit, or delete an existing Exploration. Your list of Explorations is private and browsable only to you.
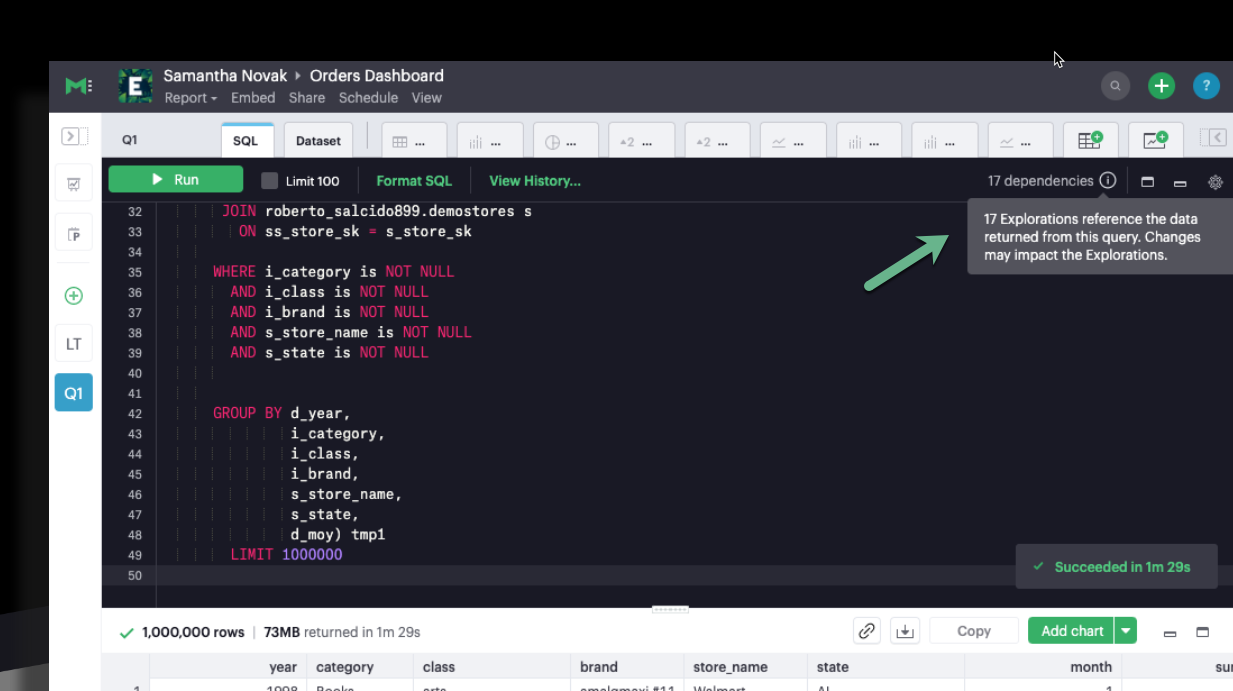
Reports powering Explorations
Members in your workspace can only create and view Explorations when they have permission to view the report. If a query in your report powers an Exploration, you will see a status indicator in the right corner of the SQL editor. The tooltip will tell you how many Explorations are powered by your query’s data.
FAQs
Q: Can I share my Exploration?
Yes. Once you save your Exploration, you can share the URL with others in your workspace. If they have permission to view the report, they can view your Exploration.
Q: Can other people edit my Exploration?
No. However, when you share your Exploration with other members of your workspace, they can create their own Exploration, personalized to them, starting with what you shared.
Q: Why did my Exploration’s data change?
By default, an Exploration will update automatically to show the latest successful run of the query powering it. If a Report runs on a schedule, or is manually refreshed, your Exploration will be refreshed simultaneously.
Q: What happens if I delete a query/report powering an Explorations?
Explorations are dependent on the Report and query result set powering them, and will also be deleted in the event that you delete the query or Report. If deleted, these Explorations will be removed from the My Explorations view in Collections, and navigating back to any existing URLs will result in a 404. If you’re worried about deleting someone else’s Explorations, we recommend archiving reports instead. That way, any Explorations that reference that report will continue to work.
Q: Can I save my Exploration against a specific query run/snapshot of the data?
Currently Explorations can only be saved against the most recent successful run and will update automatically to show the latest data.
Q: How do Explorations work with schedules?
Explorations will update along with Reports if you’ve set up a recurring run schedule. As for delivering an Exploration itself on a schedule (i.e, to Slack or email), you can’t currently share Explorations outside of Mode.
Q: What happens if the permissions change on a report being used by Explorations?
Members in your workspace can only create and view Explorations against Reports they have permission to view. If you lose access to view the underlying report your Exploration is saved against, you will not be able to access the Exploration until you regain view permissions for that Report.
Q: If I change or delete a chart in my Report, will any Explorations saved off of it change?
Explorations aren’t dependent or linked to visualizations themselves, but rather to the underlying data behind them. If you explore a pie chart in a dashboard for instance and it later changes to a donut chart type, your Exploration’s chart type will not be impacted.
Q: If I change a query in my report, what happens to the Explorations that use it?
Any Explorations that uses your query as their data source will update automatically to reflect the latest run. If you add new columns or fields, or change the names, those updates will show up in the field set. Similarly, if you remove any columns or fields, they will also be removed from Explorations.
Q: What happens if a query being used by Explorations breaks?
If a query run results in an error or fails to return, Explorations will continue to reference the latest successful run and will continue to work.
Was this article helpful?