Cohort Analysis: An Introductory Guide for Better Retention

Chioma Dunkley, Mode Team Writer
March 29, 2022
NaN minute read

When we know more about specific user groups and their behaviors, we can meet them with more meaningful messaging, guide them to features they need, and better understand where our product might need improvement. This type of analysis that lets us understand our users better is referred to as “behavioral analytics.” While there are many ways to gather useful customer data and behavioral analytics, in this article we will be focusing on one—cohort analysis. Let’s dive in!
What is Cohort Analysis?
First, let's define what a cohort is.
A cohort is simply a group of users who share similar characteristics. These characteristics can include acquisition date, demographic information (like age or location), user device, the marketing channel or campaign in which they were acquired, and other types of groupings.
You may often see cohorts sharing the same characteristics of time; for example, users who were acquired at the same time, users who purchased a product at the same time, or users who’ve subscribed at the same time. However, temporal or time-based cohorts aren’t the most valuable cohorts because they don’t tell you what to do next.
So then, what is cohort analysis?
Cohort analysis is the process of breaking up users into cohorts and examining their behavior and trends over time or over their customer lifecycle. It requires both the grouping of users and tracking them over time. As mentioned earlier, cohort analysis is a form of behavior analytics. It is also sometimes said to be a subset of segmentation and is sometimes used interchangeably with the term segmentation, but that’s a topic for another post.
Cohort analysis lets us see more
Because most analyses deal with grouping data, you may be asking, “How is a cohort analysis different from any other type of analysis?” Let’s take a look.
Below is a simple chart displaying the number of engaged users per month – a common way of analyzing growth metrics. (To view it, scroll within the embed.)
This chart shows us that there is an increase in engaged users as the month progresses. But it does not show us why we may be seeing this growth in engagement, nor does it show us who these users are that are engaging with our product.
A cohort analysis can give us more details on who users are and thus help us narrow why they may be engaging more or less with the product based on cohort attributes.
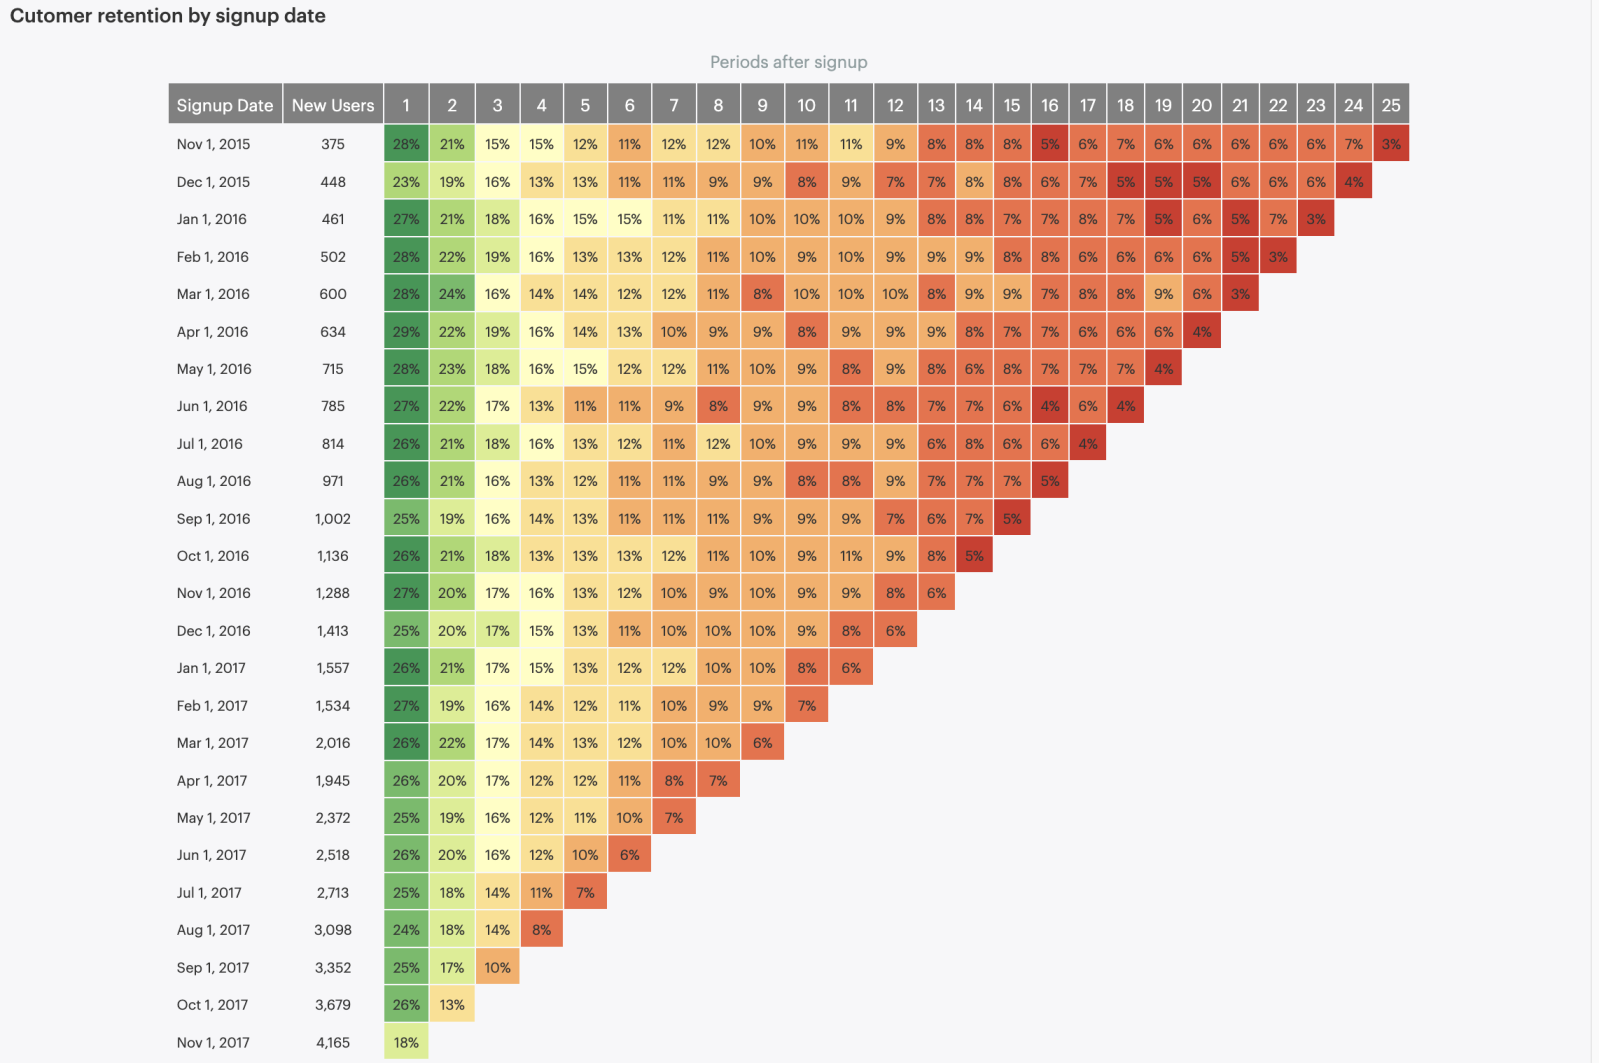
Now here is a cohort analysis looking at new user retention:

Each row denotes a cohort, broken up by their sign up date as seen in the left column. The following column to the right shows the exact number of users that joined that date. The remaining columns, 1-25, denote the number of weeks that have passed in that cohort's life cycle. Lastly, the number in each cell from left to right in columns 1-25, denotes the percentage of users in that cohort who’ve engaged each subsequent week.
From this chart, we can conclude a few things. First, we are seeing an increase in the number of new users but once we acquire these new users we see that there is a significant decline in how many of them return and engage with our product after week one and week two.
If you continue to examine the chart further cohort by cohort (row by row) you can notice other trends like the fact that new users that have joined from July 2017 and onward are showing lower product engagement percentages at a faster rate and seeing less retention.
With this cohort analysis, we not only see insights that the previous chart could not show, but it also tips us off that a good chunk of the user engagement that we saw in the first chart is correlated to the signup of new users.
A few notes:
The column “New Users” isn’t required to understand the trend that users drop engagement as the weeks progress, but it helps give us a more accurate picture of the size of each cohort.
When creating your own chart, you can determine how long you want to observe your customers and at which level of frequency (week, month, quarter, etc).
What are the benefits of cohort analysis?
So when is cohort analysis useful? What kinds of information can it tell you about your business?
The benefits of cohort analysis are many and can vary based on your use case, company needs, as well as the questions your team is looking to answer.
It allows you to track the customer life cycle of specific groups. By tracking groups of users, you can get a clearer view of how and when your customers engage with your product or business. This allows you to see customer lifetime value.
It can help you understand the long-term and current health of your business. By tracking users over time, you can see if your business is actually being successful at acquiring users and retaining them. You can also predict possible churn.
It can tip you off to whether or not changes in your site or product are affecting users. By tracking groups of users over time, you can zoom in and see if their change in behavior coincides with a launch of a new product feature or change to the website.
It can help your company make better and more informed decisions and predictions. By tracking users over time and examining a particular cohort’s behavior, you can take more strategic steps like developing a targeted campaign for your most valuable users all based on meaningful data.
Cohort analysis gives you a more detailed picture
When done right, cohort analysis can unearth valuable information about different user segments that can help go-to-market and product departments focus their efforts with nuanced insights. With Mode you can perform cohort analysis using both marketing data and product data for speedy insights. Give it a try.
Get our weekly data newsletter
Work-related distractions for data enthusiasts.


