


When it comes to distributing analysis, it can be helpful to put data where folks discover it over the natural course of their day. For some Mode customers, this means embedding reports into an internal wiki or team-specific tools like Salesforce or Zendesk. We just released a few new features to make embedded reports even more useful to people throughout your organization.
Run on page load
Rather than relying on schedules to keep embedded reports fresh, you can now configure embedded reports to run automatically each time someone loads the page it lives on. All you need to do is add ?run=now to the URL in the embed code.
To help manage database load, Mode won't start a new run of the same query until the previous one has finished. For example, if one person loads the page and kicks off the run, and then 99 other people load the same page before the run finishes, Mode won't run the report 100 times. Instead, it shows the first viewer’s run to all 100 people as soon as it is done running.
Define parameters in the embed code
If your report is built with query parameters, you can define these in the embed code as well. Let's say, for example, you've built a report that helps your team understand the deliciousness of burritos by state (data from FiveThirtyEight). Its query, which allows a viewer to select a state, looks like this:
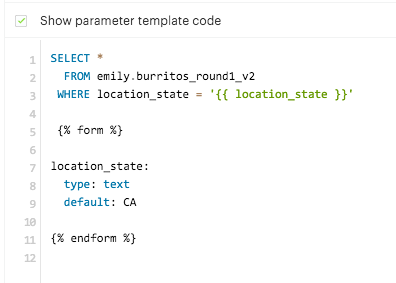
If you embed this report with ?run=now, it will show the default (California) each time. But what if you wanted a wiki page with graphs for a few different states? In the past, the only option would be to build two separate graphs. Now, you can save a lot of time by making just one report and passing query parameters into the embed. To pass a query parameter into the embed, grab the parameter name from your form code (in this case, “location_state”) and prepend it with “param_”. The new embed code:
<a href="https://modeanalytics.com/modeanalytics/reports/ad3a7a4ea30e/embed?run=now¶m_location_state=CA" class="mode-embed">Mode Analytics</a><script src="https://modeanalytics.com/embed/embed.js"></script>
Will result in this chart:
Now to show the Texas version of the graph, swap “TX” for “CA”:
<a href="https://modeanalytics.com/modeanalytics/reports/ad3a7a4ea30e/embed?run=now¶m_location_state=TX" class="mode-embed">Mode Analytics</a><script src="https://modeanalytics.com/embed/embed.js"></script>
And you'll get:
Together, these two new embedded report features enable you to power many embeds from one query, simplify schedules, and reduce the number of reports you need to maintain.
Here's more documentation if you'd like to set this up for your organization. Ping us on Intercom if you have questions—we're here to help!

