Get More From Your Salesforce Data: 4 SQL Queries to Write First

Sadavath Sharma, Data Scientist
August 16, 2018
NaN minute read

If your company is one of the thousands using Salesforce on a daily basis, their customer-relations management (CRM) tool is a treasure-trove of information for your business. This data provides a window into your potential and actual customers— which helps explain why it's one of the first third-party tools we see Mode customers integrating with their data warehouses.
If you're new to Salesforce, or new to your organization's Salesforce data, there's no better way to familiarize yourself with your company's schema than to build it out using SQL. (For a quick refresher on the way data is structured in Salesforce in general, check out this post.)
But even if you're well acquainted with how your company structures data in Salesforce, there's lots to be gained from recreating this reporting in SQL. Having your Salesforce data accessible in SQL gives you an easy way to extend and advance your sales analysis. Want to run some forecasts on revenue? It's easy to take your SQL report and model it in Python or R using a Notebook. Want to learn more about customer usage of your product? You can use SQL to join Salesforce data with product data.
In this post, we'll walk through a sample report replicating common Salesforce CRM reporting in SQL, so you can more easily audit, adjust, and extend that analysis. You'll find the queries we outline in this post collected in this sample report. To use it with your own data, just clone the report and adapt the column names as needed. (You'll find comments inline in the report to suggest places you'll likely need to edit it to adapt it to your own schema.)
Let's dive in!
Recreating reports using the opportunities table
Often, the first reports you’ll want to recreate are revenue-related, and that means calling on the opportunities table. In Salesforce, “opportunities” are just what they sound like: potential deals with buyers. This table contains information about every opportunity, including things like size (i.e. how much the deal is worth) and current stage (i.e. if the deal is in progress, if it’s been closed won, or if it’s been closed lost).
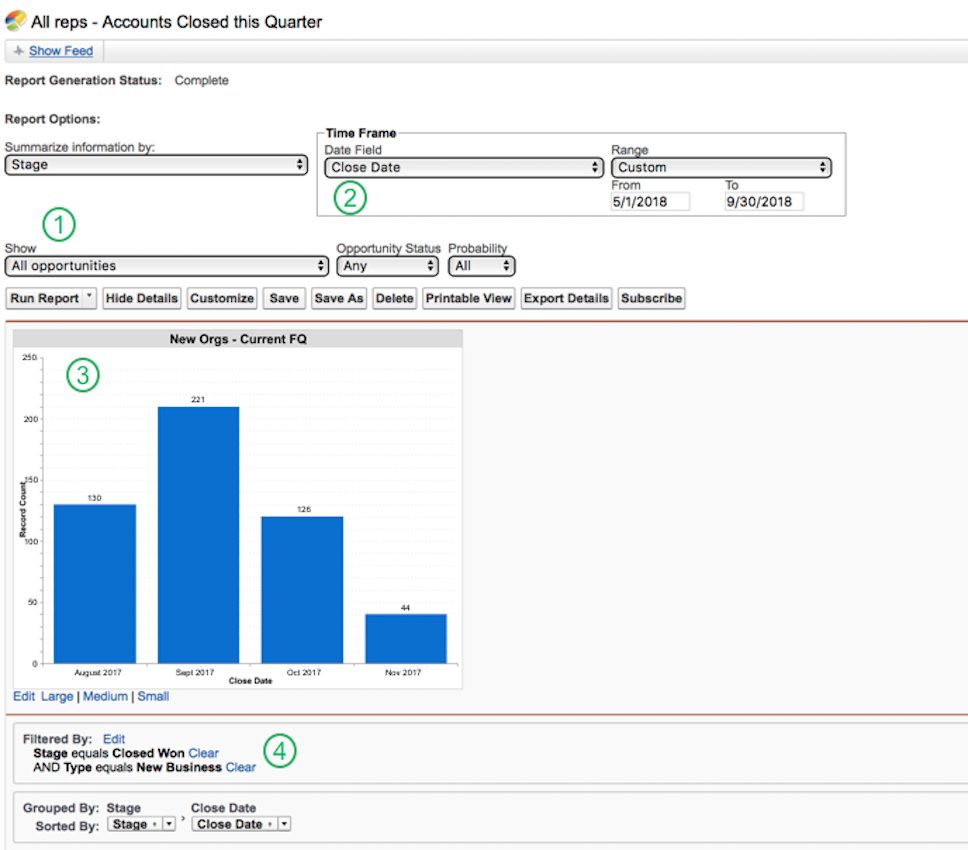
The example Salesforce report below shows the number of new accounts closed won by quarter. We’ll walk you through the menus and how each component translates to a SQL query. (You can follow along by opening the sample report in another window—see the query titled “New accounts closed won” to start.)

From the Report Options (1), you can see that this report shows opportunities at any stage and with any probability of closing. So let's start in SQL by querying the opportunities table wholesale:
SELECT *
FROM sadavath.opportunities
The Time Frame box (2) restricts the date range to the current quarter. WHERE and EXTRACT accomplish this in SQL:
SELECT *
FROM sadavath.opportunities
WHERE EXTRACT(quarter FROM close_date) = EXTRACT(quarter FROM CURRENT_DATE)
The chart (3) shows how the records are aggregated. You’re looking at the number of records by month. To show the times units as months in SQL, use EXTRACT, and to aggregate the opportunities, GROUP BY the 1st item and COUNT the opportunities in each month:
SELECT to_char(close_date, 'Month') AS Month,
       COUNT(*) AS opportunities
FROM sadavath.opportunities
WHERE EXTRACT(quarter FROM close_date) = EXTRACT(quarter FROM CURRENT_DATE)
GROUP BY 1
Finally, the Filtered By section (4) indicates that you’re looking at opportunities where the stage is Closed Won and the type is New Business. Simply add these conditions to the WHERE clause:
SELECT to_char(close_date, 'Month') AS Month,
       COUNT(*) AS opportunities
FROM sadavath.opportunities
WHERE EXTRACT(quarter FROM close_date) = EXTRACT(quarter FROM CURRENT_DATE)
  AND stage_name = 'Closed Won'
  AND type = 'Existing Business'
GROUP BY 1
And that’s it! This query will generate exactly the same data as shown in the Salesforce report above.
Below, we’ve included a couple other queries for common reports that also use the opportunities table.
New revenue this quarter
To see all new revenue from the current quarter (reproduced in the query called "New revenue this quarter" in the sample report):
SELECT SUM(total_value) AS amount
FROM sadavath.opportunities
WHERE EXRACT(quarter FROM close_date) = EXTRACT(quarter FROM CURRENT_DATE)
  AND stage_name = 'Closed Won'
  AND type = 'New Business'
New revenue by type
To see all revenue for the current quarter, broken down by type (i.e., new business, renewal, etc):
SELECT type,
       SUM(total_value) AS amount
FROM sadavath.sf_opportunities
WHERE extract(quarter FROM close_date) = extract(quarter FROM CURRENT_DATE)
  AND stage_name = 'Closed Won'
GROUP BY 1
See the query called "New revenue by type" in the sample report to adapt this for your own reporting.
Current pipeline
To keep tabs on the total amount of potential revenue in your sales pipeline:
SELECT stage_name,
       SUM(total_value) AS amount
FROM sadavath.sf_opportunities
WHERE extract(quarter FROM close_date) = extract(quarter FROM CURRENT_DATE)
  AND stage_name IN ('Negotiation',
                     'Trialing')
  AND type = 'Existing Business'
GROUP BY 1
See the query called "Current pipeline" in the sample report to adapt this yourself.
These four queries will help you build a solid foundation for reporting on sales opportunities, revenue, and pipeline in SQL. From here, the sky's the limit: you can link these reports to other common Salesforce tables (like users or accounts) for a more in-depth picture of your organization. You might want to link this data to other data stored in your warehouse, from product usage to site traffic. Or, you could generate forecasts using Python or R, as we've done in the sample report's accompanying Python Notebook--check it out for help getting started with forecasting sales data. For a more in-depth guide to forecasting in Python or R, check out our sample recipes for using the Prophet library in Python or R.Want more help getting to know your Salesforce data? We made a guide just for that. Download Understanding Salesforce CRM Data: A Complete Guide for Analysts for free!
Get our weekly data newsletter
Work-related distractions for data enthusiasts.


