


World events in 2020 put a big spotlight on data. From COVID maps to election updates to economy tracking, many of us kept refreshing data charts to get answers on what was coming next.
In a webinar last week, our data team and senior product manager came together to talk about the unique role that data played for them in 2020 and datasets that left an impression this year. Some made us smile and others left us with thought-provoking questions on current events.
In a quick recap, we spotlighted a few datasets below, but you can watch the full webinar here complete with rich conversation on data in the media (at 7:15), more interesting datasets, and of course, solid bantery commentary.
A few unique datasets from our conversation on data in 2020
1. What element of data (a technology or a statistic or an analysis) is going to have the most lasting impact in 5 years?
Spotlight dataset: The elimination of third-party cookies
Google Chrome’s elimination of cookies will have a significant effect on data for internet advertising. However, it’s still up in the air as to what exactly will happen.
The only certainty about the future is that the old forms of obtaining advertising data will be replaced with new collection methods. Perhaps a user opt-in for ad data might make advertising work on a consensual basis.
2. What did you find to be the most misinterpreted dataset, analysis, visualization, data technology, or data concept?
Spotlight dataset: U.S. still trails other countries in voter turnout
This chart compares the percentages of eligible voters vs. registered voters in countries around the world and raised broader questions about the differences in voter turnout between the U.S. and other countries. Our data crew discussed factors such as the electoral college and mandatory voting in other countries as possible answers as to why.
3. What did you see as an unnoticed, but valuable dataset, analysis, visualization, data technology, or data concept?
Spotlight dataset: Beyond Meat patty vs. Beef patty
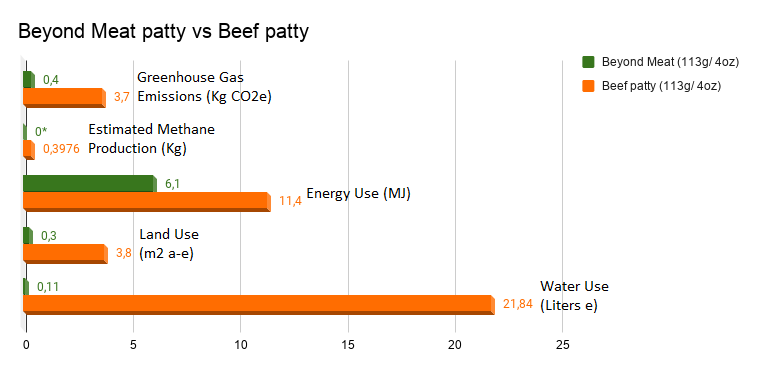
Is Beyond Meat actually better for the environment than actual meat? While this graph would seem to indicate it's better for the environment, it doesn't quite make an apples-to-apples comparison.
This article lays out the rationale for comparing sustainably-raised, grass-fed beef (vs. mass-produced meat) to Beyond Beef as two premium products, both of which are healthier and better for the environment.
4. What use of data made you smile in 2020?
Spotlight dataset: Wanna know Somefing
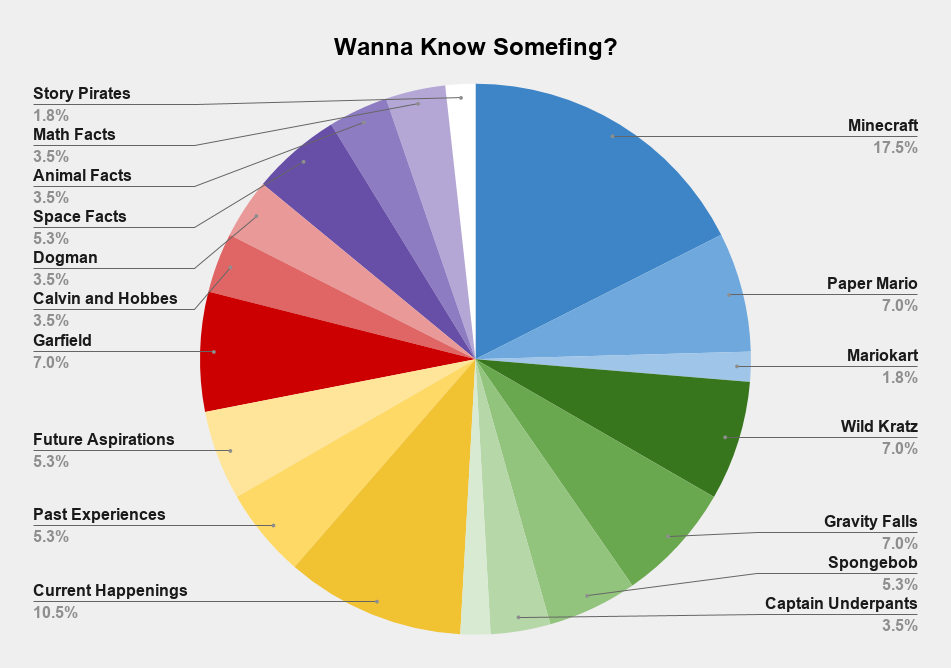
A more personal dataset featured on Reddit made the cut for this category. Organized by discussion topic, this pie chart shows seven days of worth of conversations a 6-year-old boy wanted to share with his father. While topics ranged from current happenings to Math facts to Minecraft, some of our team was glad to see that Calvin and Hobbes made the list.
We’re building our data community, join us for our next webinar
We enjoyed sharing our favorite data points with our data-loving community. Check back for new webinar updates and join us for our next data science wrap-up; we’re planning to have more casual gatherings on a quarterly basis.

