Mode's Diversity Report for Q1, 2022

Derek Steer, Co-founder & Chief Strategy Officer
June 9, 2022
NaN minute read

Having an inclusive culture and diverse team is important to us at Mode. To hold ourselves accountable to improve representation at all levels and departments, we’ve committed to publishing our diversity numbers each quarter.
Here are the self-reported diversity statistics of our team for Q1 of 2022.
*Note: Some of the percentages in the graphics will be slightly off due to design constraints. The numbers in the text are the most accurate representation.*
Self-reported diversity statistics at Mode
Self-reported racial identities at Mode
Asian - 20%, Black or African American - 14%, Latinx - 11%, Two or More Races - 5%, White - 43%, Decline to State - 7%

Self-reported gender identities at Mode
Female - 45% Male - 54% Nonbinary - 1%
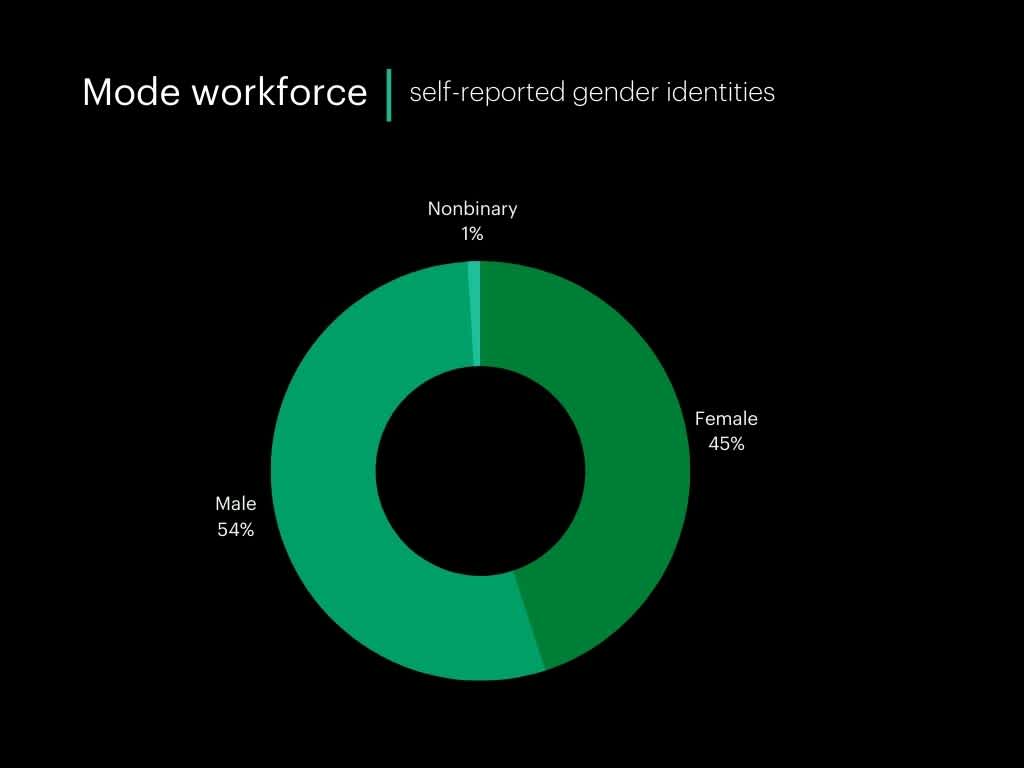
Self-reported racial identities of Mode management
Asian - 19%, Black or African American - 7%, Latinx - 10%, Two or More Races - 5%, White - 57%
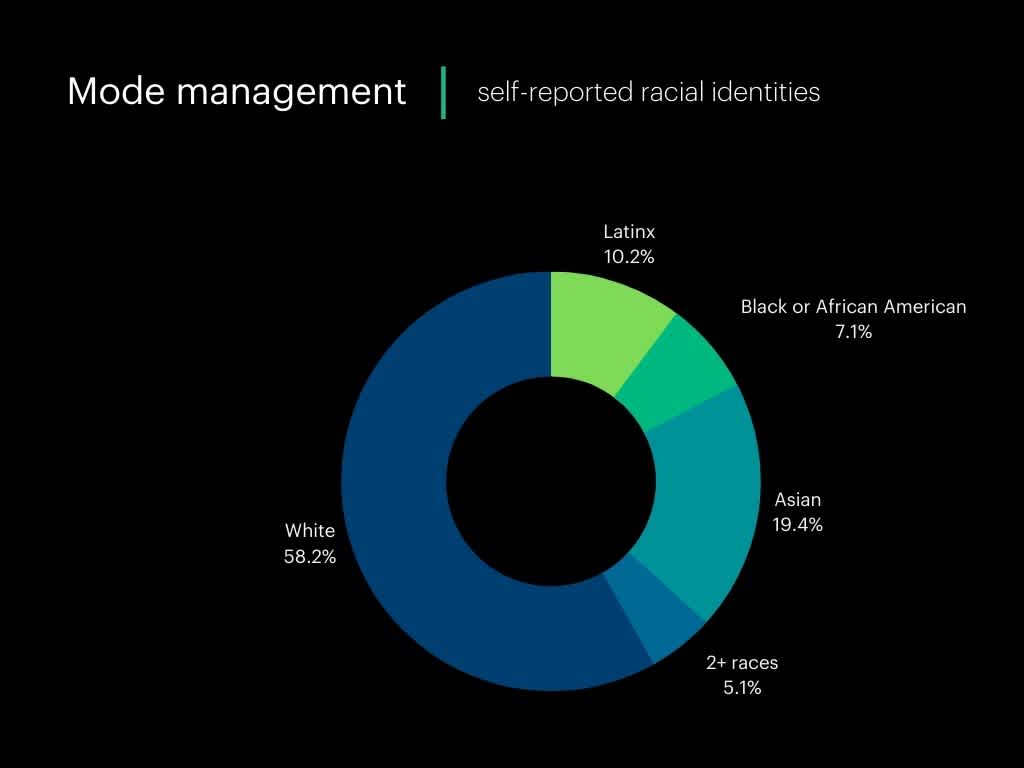
Self-reported gender identities of Mode management
Female - 43%, Male - 57%, Non-binary - 0%

Self-reported racial identities of Mode's technical team members
Asian - 25%, Black or African American - 11%, Latinx - 8%, Two or More Races - 2%, White - 46%, Decline to State - 7%
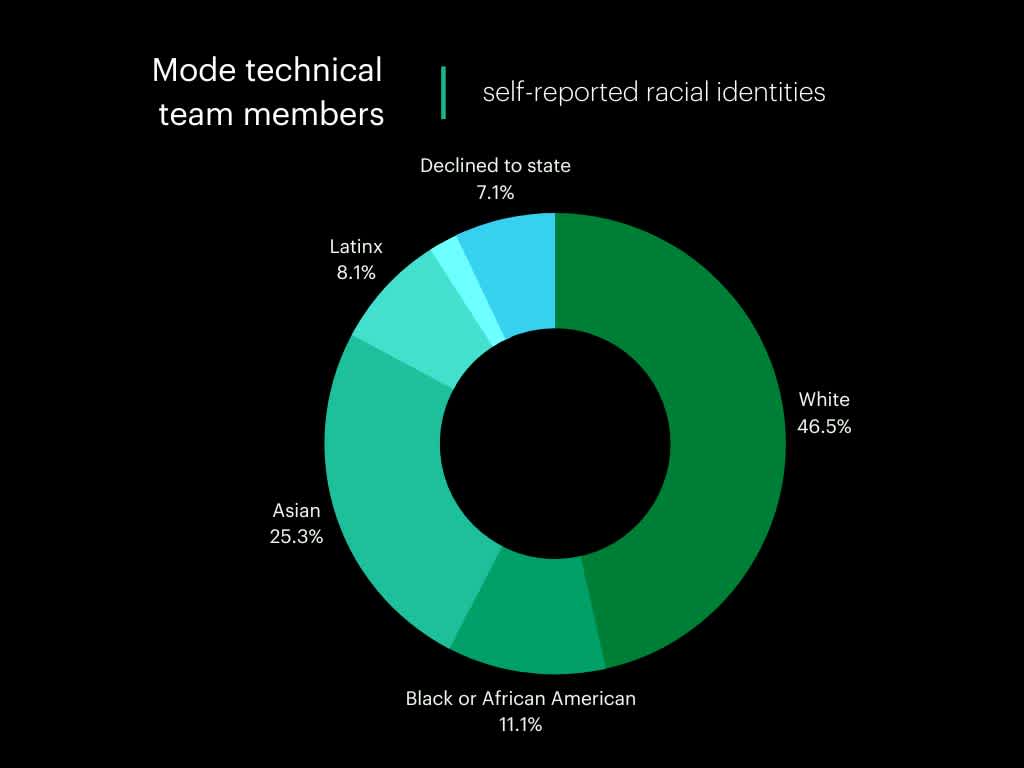
Self-reported gender identities of technical team members at Mode
Female - 28%, Male - 71%, Non-binary - 1%
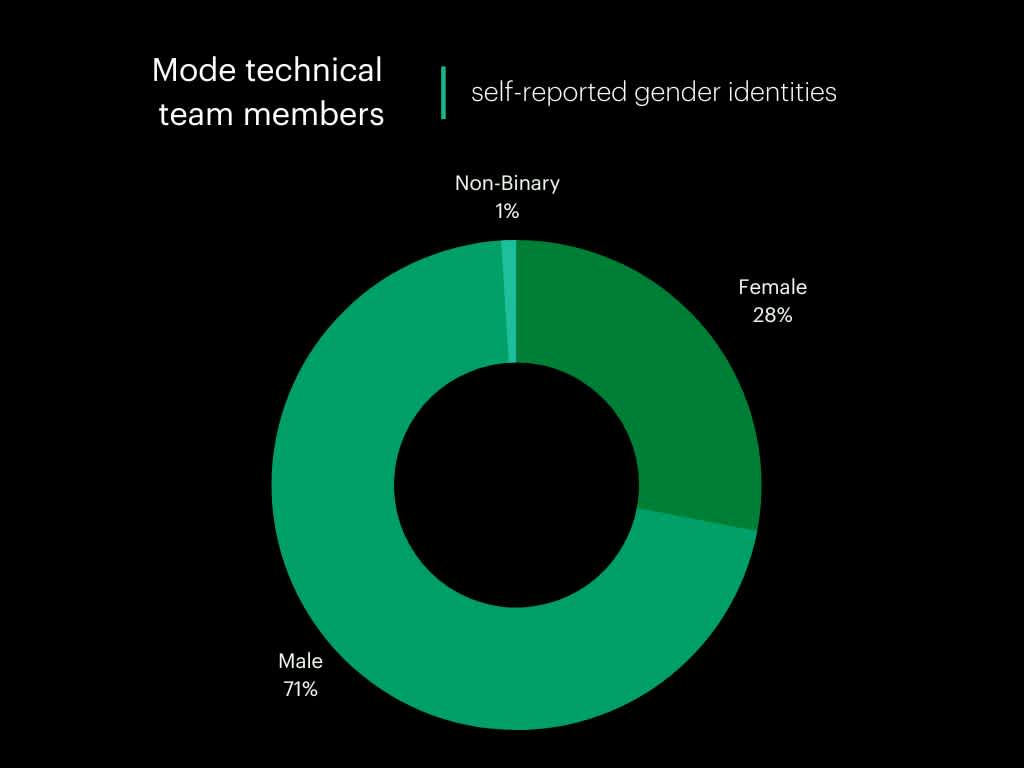
Self-reported diversity statistics of non-technical team members
Asian - 17%, American Indian or Alaska Native - 0%, Black or African American - 16% (as shown as Black due to formatting restrictions)* , Latinx - 12%, Two or More Races - 6%, White - 41%, Decline to State - 7% (as shown as DTS due to formatting restrictions)*

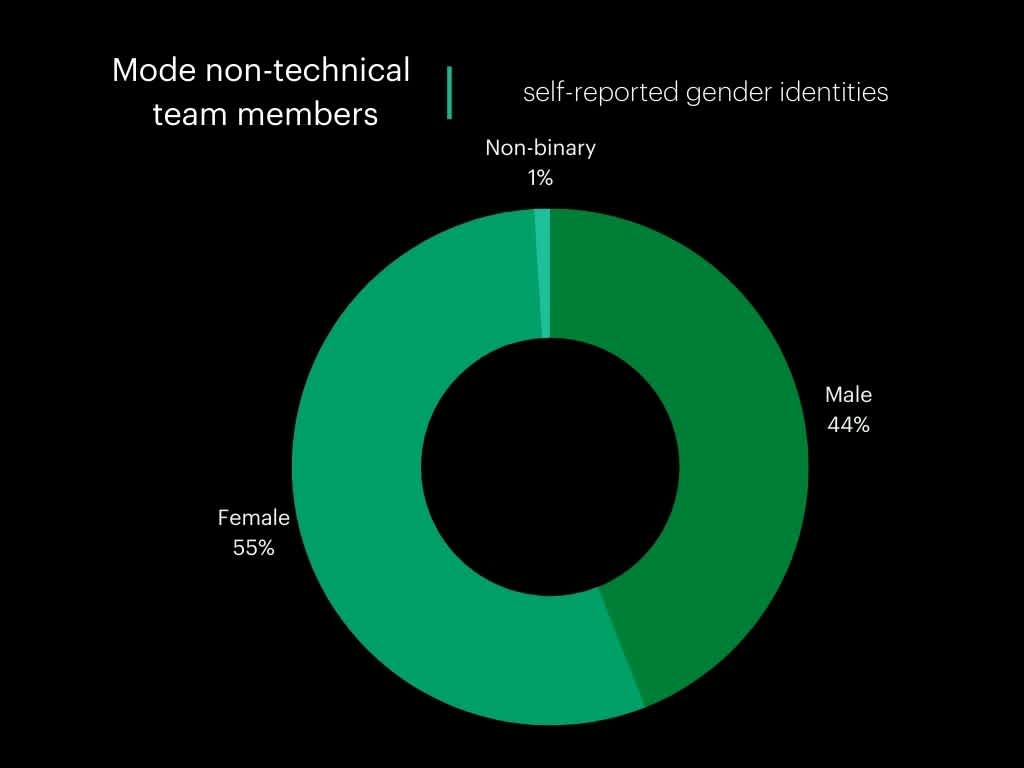
Self-reported gender identities of Mode non-technical team members
Female - 55%, Male - 44%, Non-binary - 1%
Related posts
- Mode’s 2021 Diversity Report for Q3 - Mode’s 2021 Diversity Report for Q2 - Our Stance on Racial Injustice
Get our weekly data newsletter
Work-related distractions for data enthusiasts.


