Sometimes, your customers need a little nudge to engage more deeply with your product.
This can happen for a whole host of reasons. Sometimes it's your product, and sometimes people just get distracted by things happening in real life.
And even if they do engage deeply, they may drift away over time. Enter reengagement emails. Maybe you decide to drive awareness of a feature they haven't interacted with yet, announce new functionality, or offer a promotional discount.
Well-constructed and well-timed interventions can give users a compelling reason to stick with your product, or return after a long absence. Right out of the box, most email marketing and in-app messaging platforms only track vanity metrics, like clicks and opens. It's great that your win-back email had a 33% open rate, but did people place more orders after receiving it?
Measuring the impact of an intervention
To gauge if your efforts are driving the intended user behavior, you need to measure the percent of users who completed that action before and after the intervention. The latter becomes your metric for impact—it could be the user churn rate, the average amount spent each day, or the number times a specific action is taken (messages sent, pages viewed), etc.
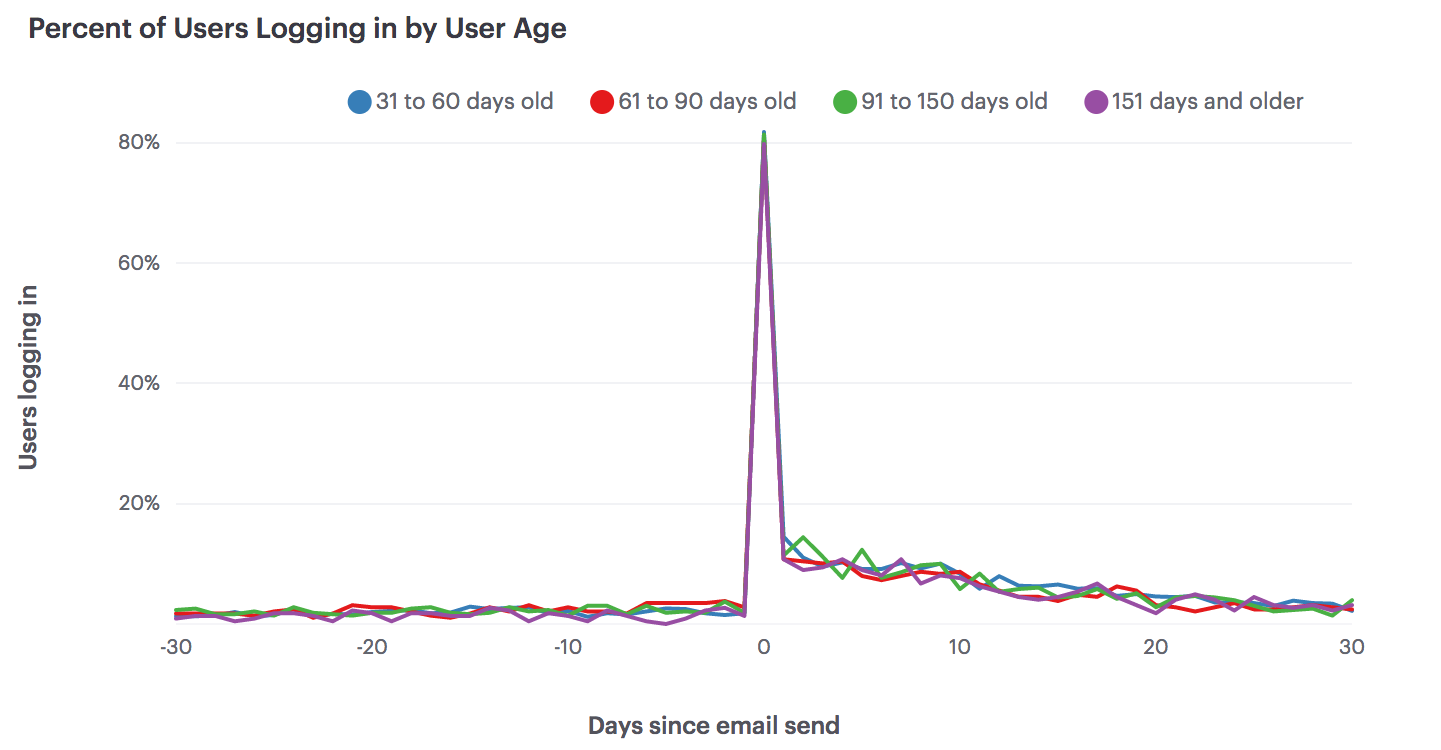
In this hypothetical scenario, a company sends out one win-back email to their users in a 60 day period. Their impact metric is the percent of email recipients who logged in each day. The graph below shows the 30 days before and after the intervention and the lines represent email recipients in different age cohorts. Hover over a line to see logins for a particular cohort on any given day.
Of course, this report (and tactic) shows a very simple version of reality. Marketers don't send out one-off emails once a quarter; they craft series of messages that go out on a schedule or are triggered when a user completes a particular action.
If this report were populated with real data, we'd expect to see several spikes from other engagement campaigns or some other factor entirely. However, there's a benefit to honing in on a particular intervention. With an equal amount of time before and after the event, it's easier to see if the intervention correlates with a signal in the noise.
Interpreting this chart
While this chart shows how engagement levels change after an intervention, the results aren't a true test of the intervention's effectiveness. That spike in logins could be caused by something else entirely.
This is particularly true in two cases. First, if the intervention event is triggered by some other user action, the change in engagement after the intervention event may reflect the change in user behavior that caused the intervention event to be triggered. For instance, suppose an e-commerce site emails an offer of a $10 gift card after the customer spends $100 dollars. If people spend more money after they receive the gift card, it may be because the gift card changed their behavior—but it’s more likely that customers got the gift card because they began spending more money on the site.
Second, interpreting changes before and after an intervention event can be tricky if that event occurs at the same time for all users. For example, if Uber offers a one-time promotion to deliver kittens, every Uber customer receives that promotion at the same time. Behavior changes after the promotion could be because of the kittens, or could be because of changes to the Uber app, to prices, or to the market after the promotion.
External events can also have an effect on behavior. During the holiday season, people may be using Uber more because they need to go on shopping trips or because they have a slew of holiday parties to attend. If an unexpected storm arrives in the week after kitten delivery day, people who primary walk or bike to work might take an Uber instead, leading to an unusual boost in total rides.
In other words, if the intervention occurs at the same time for everyone, it’s very difficult to determine if changes are caused by the intervention or by other factors that also affect all your customers at the same time.
Use this report with your data
We've open-sourced this report and the underlying SQL query so you can adapt it to your raw data. Although the report displays an email intervention and login events, you can examine whichever intervention and user actions make sense for your business.
All you need is a table of events and a table of users tables, as well as a table of intervention events (in this case, emails). This third table, which could be a list of emails and their recipients, promotions accepted, or unfulfilled deliveries, can often be subsets of an events table.
Once you have your tables formatted and your database hooked up to Mode, click “Results à la Mode” at the bottom of the above report, clone it, and plug in your data. This report has several adjustable variables.
- The intervention is defined in the third SELECT statement. This should be the event you believe caused change. It could be literally anything: an email send, a promotional discount, a product update, a pricing change.
- The action is defined in the second SELECT statement. This should be the type of event you were hoping to drive with the intervention. For instance, if the intervention was a promotional discount, you might measure total orders or money spent by day.
- The user age cohorts are defined in the last SELECT statement. Ages are defined by how old the user was on the day the intervention took place. You can adjust these age windows to fit what’s appropriate for your product.
- The time from event is also defined in the last SELECT statement. You can extend or shorten it to fit your needs.
For more a detailed explanation of how to apply this report to your data, check out this help doc.


