


The internet is awash in Venn diagrams of SQL JOINs and explanations of why they're necessary. Though it would be nice if we could answer every data question with a single table, more often than not, to get a complete picture, we need to combine different data sets.
This is why JOIN is such an important part of analysis in SQL—it's so important, in fact, that our interactive SQL tutorial has not one but ten separate lessons about when and how to use different kinds of JOINs.
But what if you're one of the many analysts or aspiring analysts who prefer to work in Python or R rather than in SQL? Though SQL has long been the industry standard for accessing relational data, nowadays, it's more and more common to do this same work in a scripting language like Python or R. And as we'll show in this post, if you “speak” a little Python or R, in many cases it's also easier to join with data using one of these languages.
In this post, we'll walk you through how to join datasets in SQL, Python, and R. We'll use some very simple, fictional datasets containing info about users and their events, or “likes” on a social media platform. This data has a typical structure, in that it stores user data separately from platform behavior. (For a more in-depth discussion of why data tends to be structured in this way, see that introductory SQL JOINs lesson we linked to above.)
Sample data
The data that we'll use in this post is borrowed from Patrik Spathon's helpful interactive SQL JOINs visualization, which you can check out here. The tables are very simple and contain the following data:
Events Table
| user_id | like |
|---|---|
| 3 | Stars |
| 1 | Climbing |
| 1 | Code |
| 6 | Rugby |
| 4 | Apples |
Users Table
| user_id | name |
|---|---|
| 1 | Patrik |
| 2 | Albert |
| 3 | Maria |
| 4 | Darwin |
| 5 | Elizabeth |
Now let's dive in, starting with a look at how to perform inner joins in SQL, Python, and R!
Inner Joins
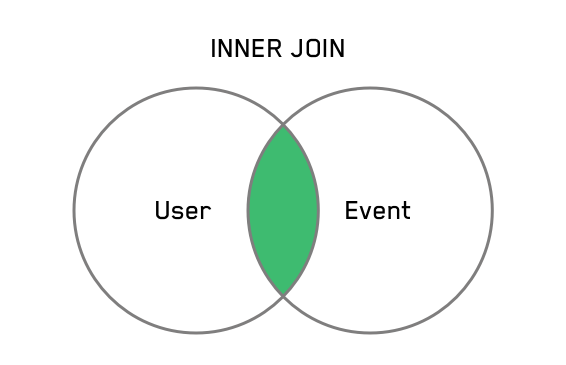
To analyze the data common to two tables, use an INNER JOIN. In mathematical terms, an inner join is the intersection of the two tables. (For a primer on INNER JOINs, check out this tutorial.)
In this example, we'll join our users data with our events data using the column they have in column, namely, “user_id.” Doing this via inner join means that users for whom we have no event data (that is, no “likes”) will be excluded from the results:
SELECT t1.name,
       t2.like
FROM sadavath.users t1
INNER JOIN sadavath.events t2
  ON t1.id = t2.user_id
You'll find that Patrik likes both code and climbing, and Maria likes stars. You won't see any results from Albert or Elizabeth because they haven't taken any actions in the platform (no likes from Albert and Elizabeth?!).
If you'd prefer to use Python for this same join, hop over to a Notebook and pull in your datasets to get started:
df1 = datasets["Users Table"]
df2 = datasets["Events Table"]
df2['id'] = df2.user_id
Then, you can use pandas to achieve the same result as the SQL JOIN above:
inner = pd.merge(df1, df2, on='id')
inner[['name','like']]
If you're more comfortable working in R, this join can also be achieved in an R Notebook with a few simple commands. First, pull in the tables you'd reference:
library(dplyr)
df1 <- datasets[["Users Table"]]
df2 = datasets[["Events Table"]]
df2['id'] <- df2['user_id']
Then select the overlapping data you'd like to see using the dplyr library:
inner <- merge(df1, df2)
select(inner, name, like)
Left Join
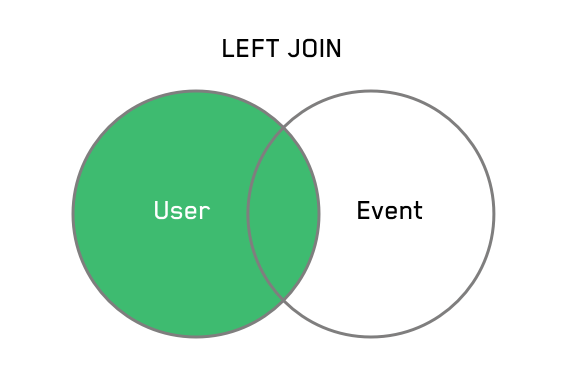
Now suppose you'd like to look at data for all the users on your platform. This example of a LEFT JOIN returns data about all users and their corresponding events. If the user has not taken a given action on the platform (here, “likes”), we'll see a NULL value for that user in that column; if the user has taken multiple actions, we'll see a row for each action.
SELECT t1.name,
       t2.event
FROM sadavath.users t1
LEFT JOIN sadavath.events t2
  ON t1.id = t2.user_id
As you can see if you look at the results of this query, all of the users are included (and Patrik is included twice), but in the rows for Albert and Elizabeth, we see the null value in the “likes” column.
In Python, you can achieve this same LEFT JOIN using pandas' merge function again, this time specifying left:
left = pd.merge(df1, df2, on='id', how='left')
left[['name','like']]
If you'd prefer to use R, you can once again use the dplyr library's left join:
left <- left_join(df1, df2)
select(left, name, like)
Right Join
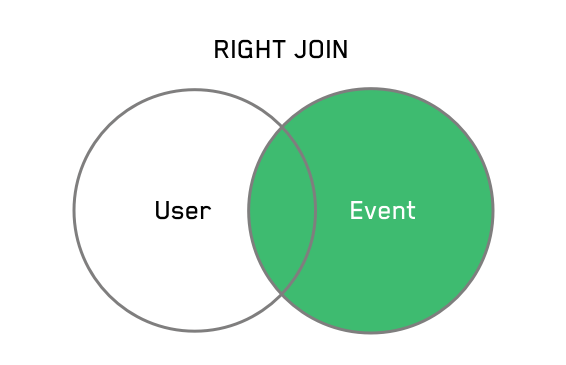
Conversely, it can be helpful to look at these two datasets from the perspective of events. Using a RIGHT JOIN, we can return all the likes with their corresponding user. If there isn't a matching user (perhaps an action is performed by an anonymous, logged out user), you'll see a NULL value in the user column for that event.
In SQL, it will look very similar to the last example, with “RIGHT” replacing “LEFT”:
SELECT t1.name,
       t2.like
FROM sadavath.users t1
RIGHT JOIN sadavath.events t2
  ON t1.id = t2.user_id
We learn that someone was shy about their passion for rugby, and has covertly liked it.
Similar to the previous example, we can merge right in pandas to achieve the same result:
right = pd.merge(df1, df2, on='id', how='right')
right[['name','like']]
Or in R, once again using dplyr, specify right:
right <- right_join(df1, df2)
select(right, name, like)
Outer Join with Union
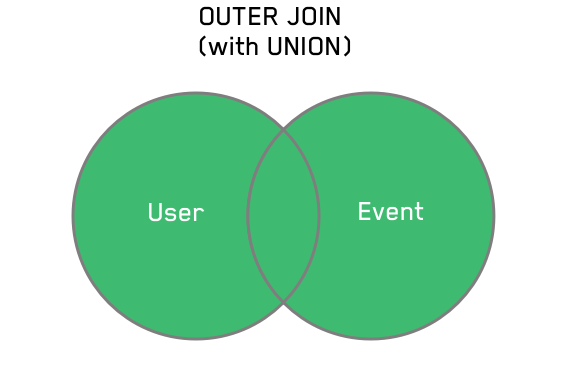
For a high-level view of all the data in two tables, you could use an OUTER JOIN with UNION. Essentially, this is both a LEFT JOIN and RIGHT JOIN combined to return all users, events, their overlaps, and nulls.
In SQL, you use both the former LEFT and RIGHT JOINs to achieve this result:
SELECT t1.name,
       t2.like
FROM sadavath.users t1
LEFT OUTER JOIN sadavath.events t2
  ON t1.id = t2.user_id
UNION
SELECT t1.name,
       t2.like
FROM sadavath.users t1
RIGHT OUTER JOIN sadavath.events t2
  ON t1.id = t2.user_id
This returns every user, their likes (or lack of them) and even a row reminding us that someone likes rugby (though we don't know who).
Using pandas, we can achieve the same result with fewer lines of code. Once again, use the merge function, this time specifying outer:
outer = pd.merge(df1, df2, on='id', how='outer')
outer[['name','like']]
R also has a specific command for outer joins. Once again with the dplyr library, you can return an OUTER JOIN like this:
outer <- merge(x = df1, y = df2, by = "id", all = TRUE)
select(outer, name, like)
OUTER JOINS with UNION are great when you've got a relatively simple dataset, like the example we've used in this post. As you JOIN more complicated datasets, though, it may be prudent to use OUTER JOINS without union to reduce your run time, or to bring together two datasets that don't share a column id (more on this in our FULL OUTER JOIN tutorial).
There are no shortage of options for JOINs in the language of your choice. With a complete understanding of the options you can leverage the language that works best for your analysis with ease and flexibility. For more resources to help weigh the benefits of SQL, Python or R for different analytical functions, check out a study of WINDOW functions, GROUP BY or the overlap between SQL and Python.

