Why Context is Queen for Data Teams & Stakeholders Defining Metrics Together

Emily Ritter, VP of Marketing
October 21, 2022
NaN minute read

If data teams are working to create a central data hub for their companies, they need partnership and accountability from their stakeholders (hey y’all!).
In this new era of Modern BI, context is queen. And that means clearing the path of all the muck that gets in the way of clarity around numbers and working together across teams. Stakeholders need to frame their metrics requests with business motivations and data teams need to give guidance on how the data will be structured and collected.
Imagine if we could approach business intelligence like a superorganism. A superorganism is a collective unit of individual organisms—think ants, coral, bees—where the division of labor is highly specialized. This is in fact the only way they can survive, with smaller groups (teams) focused on specific jobs; they need each other to complete workflows due to specialization in their roles.
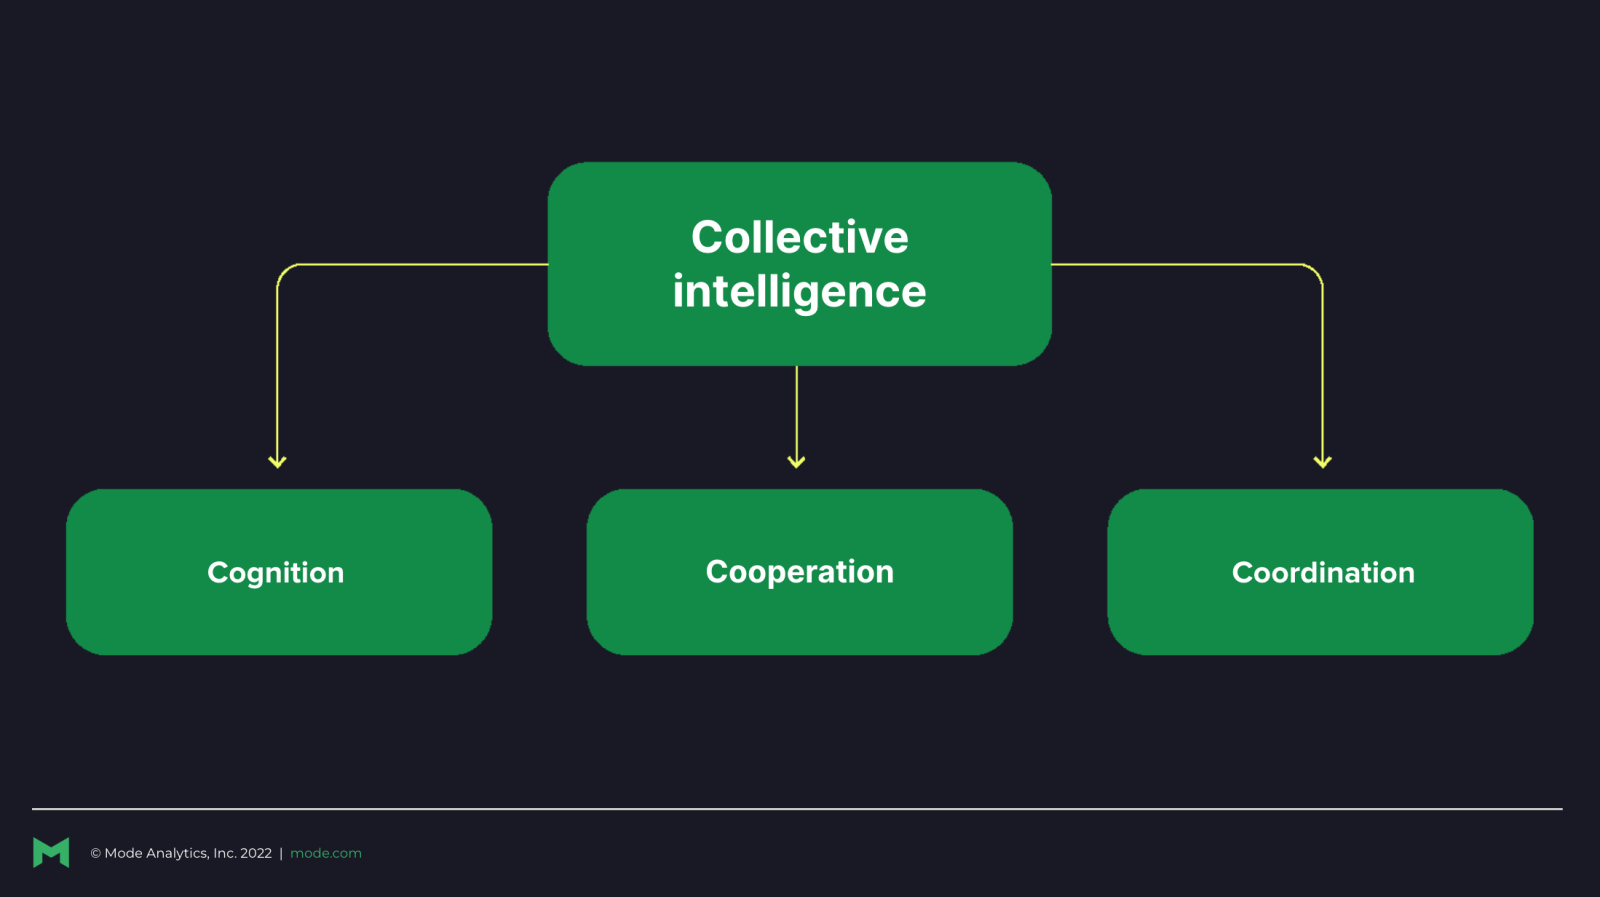
The thing about a Superorganism is that it has collective intelligence, and it turns out this is extremely relevant to organizations, especially as software becomes more and more powerful. Collective intelligence is “shared” or “group intelligence” that emerges from collaboration or collective efforts by specialists. It’s the kind of wisdom and knowledge that grows out of a group.
So, how do we get to a point where we can share and activate our collective intelligence? How can stakeholders and data teams understand and enhance each other’s knowledge at the table?
After working with data people most of my career, and ebbing and flowing as a “purple person,” here are a few tips that I shared at dbt’s Coalesce conference this Tuesday on how data teams and business stakeholders can collaborate together to get crystal clear on the metrics that are most important to them and then define them in dbt’s Semantic Layer, with Mode’s Integration.
What is Data Governance? Framework and Examples
The complete guide to a data governance strategy that ensures flexibility and safety.
How data teams and stakeholders can collaborate to build data that’s used across the org (modern BI)
As your company grows, your data grows. These frameworks and practices can help data teams and business stakeholders collaborate to define meaningful metrics.
1. Leverage the collective intelligence to arrive at metrics definitions
For an organization to excel, it’s about the group (the company) getting smarter together, and that means getting on the same page. To create a useful data hub (using Mode + dbt) you’ll want to tap into everyone’s knowledge and get all of the information out from various corners of the org to build from the same vision. This starts with clarifying conversations around the metrics that are being measured and how they’re being measured.
What does a clarifying conversation look like? Let’s take a common metric, like a marketing lead. It may seem intuitive at first glance, but when you really dive in to what the definition of a lead is, it gets trickier.
Is a lead a human? Is it an organization? Is a lead net new? What about leads that talked to your sales team once, went dark, and came back a year later—are those still considered the same as net new leads? Is every product sign-up a lead? What if it’s students using your product? It’s important to unpack and examine these details before locking in the definition of the metric. And just because you read a blog post from someone outlining a metric’s best practice, it doesn’t mean it works for your business.
The collective understanding of these metrics—the crystal clear definition—is what you’ll be codifying in dbt. These definitions will be unique at every single business, and they will change as the business evolves.

2. Slow down to go fast; after definitions, comes context
Defining metrics usually leads to follow-up questions. Beyond just a definition, you’ll want to be able to have information like how and why this metric is being measured today, if it all, and if there are any gaps in the measurement or data collection, etc. This next part is about the anticipation of what other business leaders will need to know about your metrics.
For example, let’s say you decide to use the dbt Semantic Layer to measure Cost per Lead (CPL). Your CMO sees it’s going up (maybe even wildly in fact, one week) and she wants to know why. Will you be able to answer? Did you collaborate with the data team effectively enough to have the different dimensions and measures you’ll need to explore the trends? Think: channels, regions, segments, demographics, ad units, landing page experiences, and beyond.
Here are a few questions that stakeholders and data teams should be reviewing to prepare:
Why this metric? Why now?
What are the follow-up questions we’ll want to answer once this metric is defined?
What’s one thing about this metric definition that might not be obvious on the surface?
How often should we plan to review this metric?
Get more from our template.
Metrics Definition Template
Use this template to define metrics with stakeholders.
Starting with “why” is usually the best. The business stakeholder should be responsible for clearly defining and sharing their desired state, while the data analyst can help clarify how the metric is being calculated and advise on the data structure that will be needed for the business person to answer their questions. Analysts can also help by ensuring that they have enough context and information to help build the right data set, and help create alignment with stakeholders on definitions and calculations.
3. Don't fear iteration; invite data teams into the planning room
Remember, your business is always going to be evolving, so iteration and regular review should be a part of the process. As you use your defined metrics, share feedback with your data team. What have you earned since using this metric? What decisions have you made with these metrics? What were the results? Let them know if you think the metrics are making sense. Do you think any definitions need to be changed or adjusted?
In addition to looking backwards, you’ll want to keep this collaboration moving forward (remember—we’re building a collective intelligence!). As you’re setting up new goals and company metrics, make sure your data folks are in the room as you’re planning new initiatives; this will allow them to see around the corner ahead of time to anticipate any nuances. Data is a team sport. Inviting them into frequent conversations will also help them start to understand the language of the domain expert.
Ready to start building out metrics in dbt?
Here are the starting metrics we recommend defining first:
ARR
Net Dollar Retention
Traffic or Leads
Gross Pipeline
DAU
Active Seats
Seat Adoption Rate
These practices are about slowing down to go fast. With intentional investment—collaboration—between data teams and domain experts, of metrics definitions, the business will be able to move faster and garner richer insights.
Bringing business teams into the fold can be invaluable. They don’t need to know the ins and outs of dbt, but they do need to be your partners in building, testing, and iterating on metrics. And they might know a lot more about the domain context needed to bring the metrics to life.
Mode is Modern Business Intelligence. That means it’s built around data teams and helps create a central hub for every business team to find useful, governed, and easy-to-interpret data. As the friendly front-end to your data stack, anyone can confidently self-serve relevant data and build their own reporting.
Mode’s dbt Semantic Layer Integration will be available to everyone soon. Learn how it will change the future of BI.
Read now

Best practices for automating reports in Mode
Data teams save time when they automate reports.
Get our weekly data newsletter
Work-related distractions for data enthusiasts.


