Filters: Fast, Easy Data Exploration

Emily Ritter, VP of Marketing
May 31, 2017
NaN minute read

A couple of weeks ago we announced a series of new code-free data exploration features to let *everyone* find answers hidden in data. The functionality is rolling out in four phases over the next couple of months. Phase one, Filters, is now live.
As the new functionality rolls out—filters, followed by drag-and-drop charts, drilldowns, and advanced sharing—analysts will continue to produce work in the exact same way they do now, using the easiest, most powerful toolset available: SQL and Python. Yesterday, this work produced static reports. Now, every report is an instant BI tool.
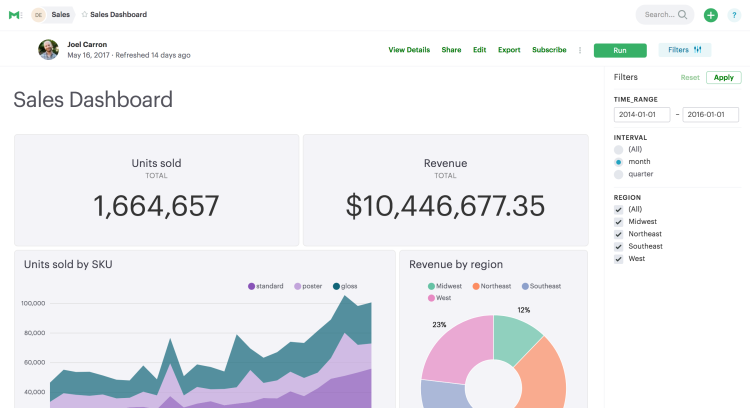
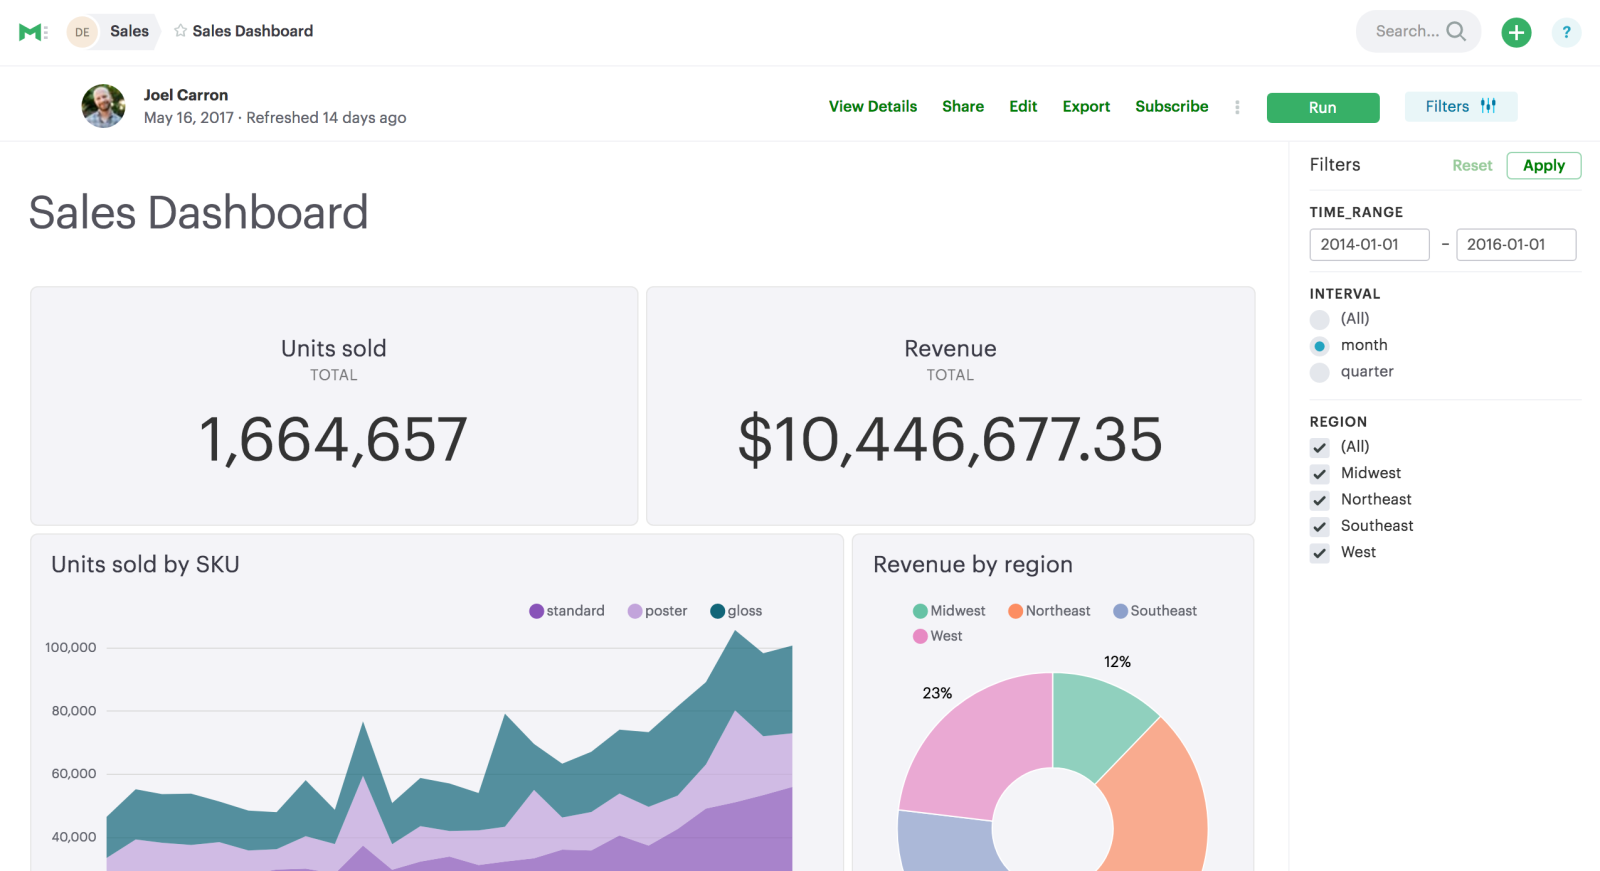
Filters let you quickly home in on a subset of a dashboard's data, without loading the database by re-running underlying queries.

Adding Filters to a Report
To jump right in to see how we added Filters to the dashboard above, open the report, click Clone (from the kebab menu next to Run), then click into the Report Builder.
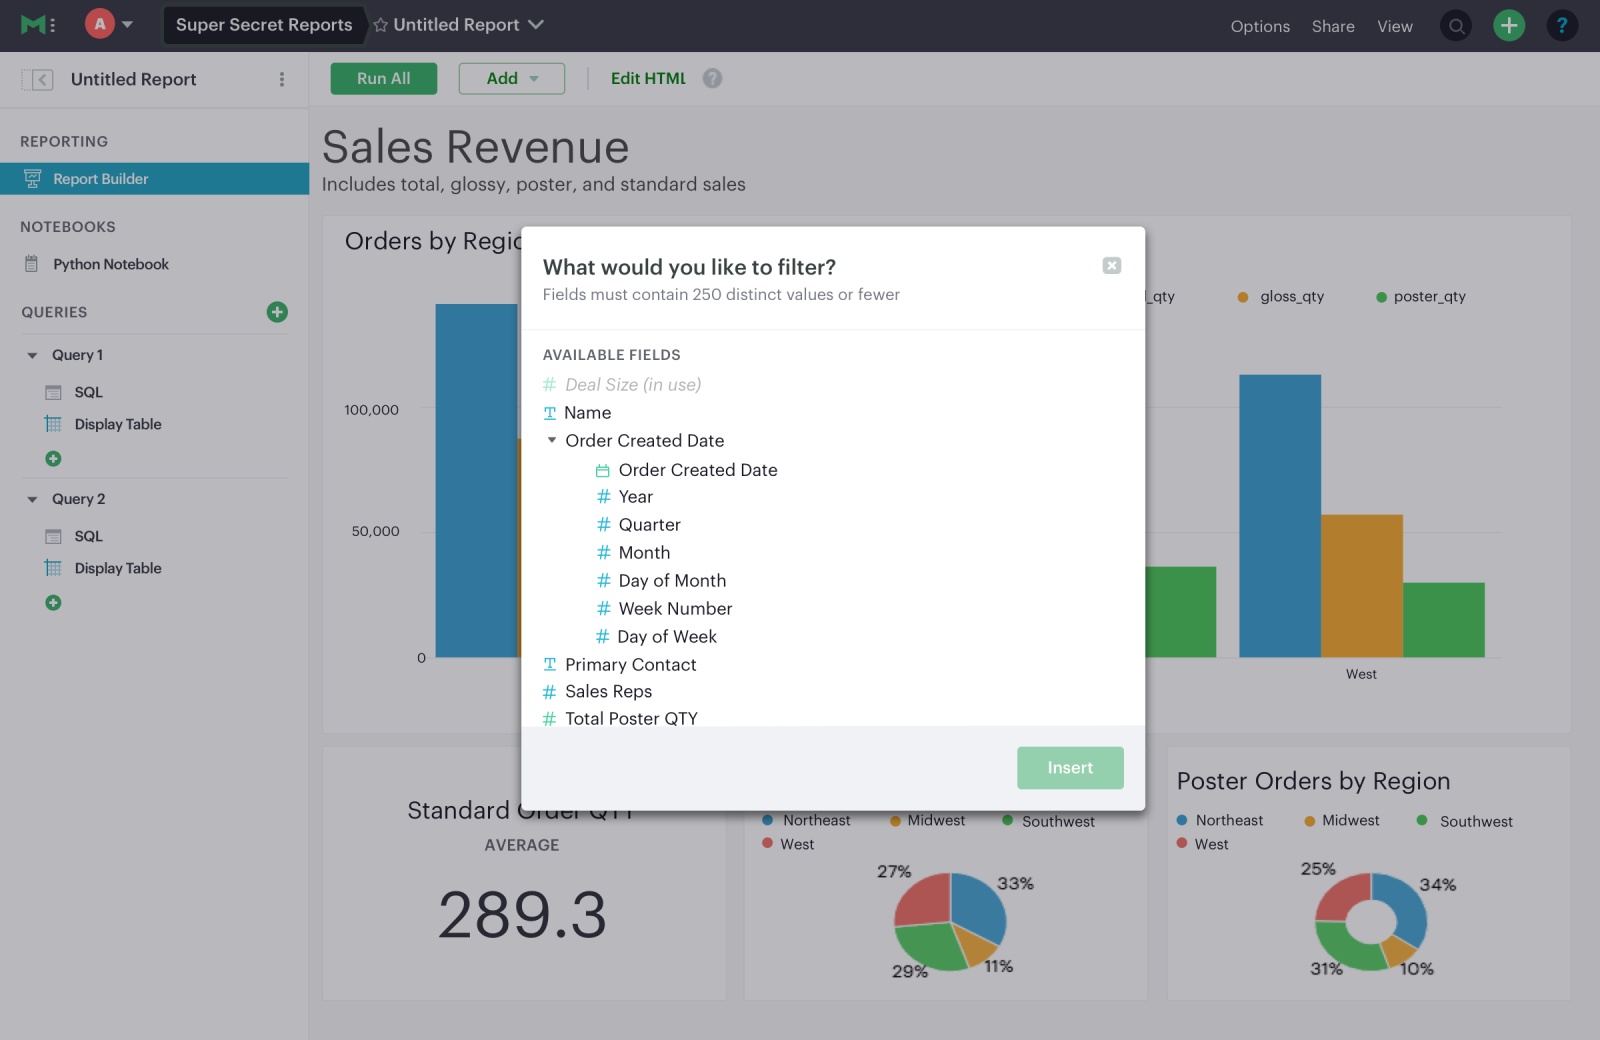
To start from scratch, create a new report, write a query or two and build a few charts. Then head over to the Report Builder and click Add Filter.
There you'll find a list of column names of all the query results in your report. Select a column name to use as a Filter. You can then pick the Filter type and set a default.

Pro-Tip: Column Aliases
Filters become extremely powerful when you use column aliases in your queries.
Let's say you're building a high-level performance dashboard. You've got a chart of new users, powered by one query where dates come from a column called activated_at. And another chart of revenue, powered by a query where dates come from a column called date.
In the Add Filter menu, you'd see both “activated_at” and “date”. To provide just one date range filter that impacts both charts, simply alias one of the columns, like activated_at AS date. Upon doing so, you'll see only “date” in the Add Filter menu and, when added to your report, will impact both charts.
Filters vs. Parameters in Mode
Using Parameters, someone viewing the report can modify the data that gets loaded into a report by re-running the report's underlying queries. Filters, on the other hand, only impact the data once it's in the report. In most cases, you'll want to use Filters instead of Parameters because they're faster to build, and make it easier for viewers to quickly iterate through ideas. When your data set is massive (like an event stream), a parameter is better suited as it can be used to load a reasonable amount of data into the report. Note: Reports can have both parameters and filters.
In most cases, you'll want to use Filters instead of Parameters because they're faster to build.
Works with White-Label Embeds
Filters are designed to work seamlessly with White-Label Embeds. Give exploratory power to customers right in your app or portal. Combined with custom themes, delivering branded, interactive embedded analytics experience is easier than ever.
See what else is new
We've got a lot of powerful new features rolling out—check back to see what's new! If you're interested in early access to drag-and-drop charts, drilldowns, and advanced sharing, let us know by submitting your request, here.
In the meantime, jump right in to add Filters to your organization's favorite reports.
As with all of our releases, we absolutely love your feedback and questions. Email us at hi@modeanalytics.com or click on the chat icon in the product to talk with our team.
Get our weekly data newsletter
Work-related distractions for data enthusiasts.


