


The best analysts know that charts alone are not always enough to inform decisions. Even the most amazing chart of all time can be left open to interpretation, risking a lost opportunity to communicate a key insight or recommendation.
A complete analysis, on the other hand, provides a comprehensive story—offering context, insights, and recommendations, all in one place. Even though analysis is built on data, words—not tables and charts—are what make it effective.
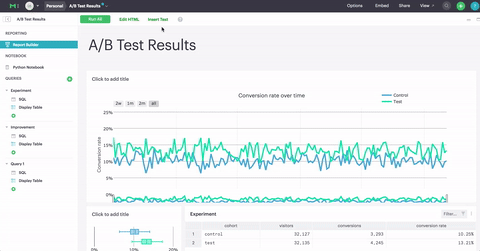
Mode's new text elements enable you to create and share more complete analyses by presenting charts and narratives side-by-side. Informative text, links, and images turn reports living in Mode into data stories that can be discovered and referenced again and again.
As simple as clicking a button
As you curate charts, pivot tables, and python output cells using the report builder, supplement the data with narratives, captions, and notes by clicking Insert Text at the top of your screen.
Add notes about your methodology, or even embed images to give a complete sense of what's going on. Plus, you can format your text however you'd like.
Data storytelling at work
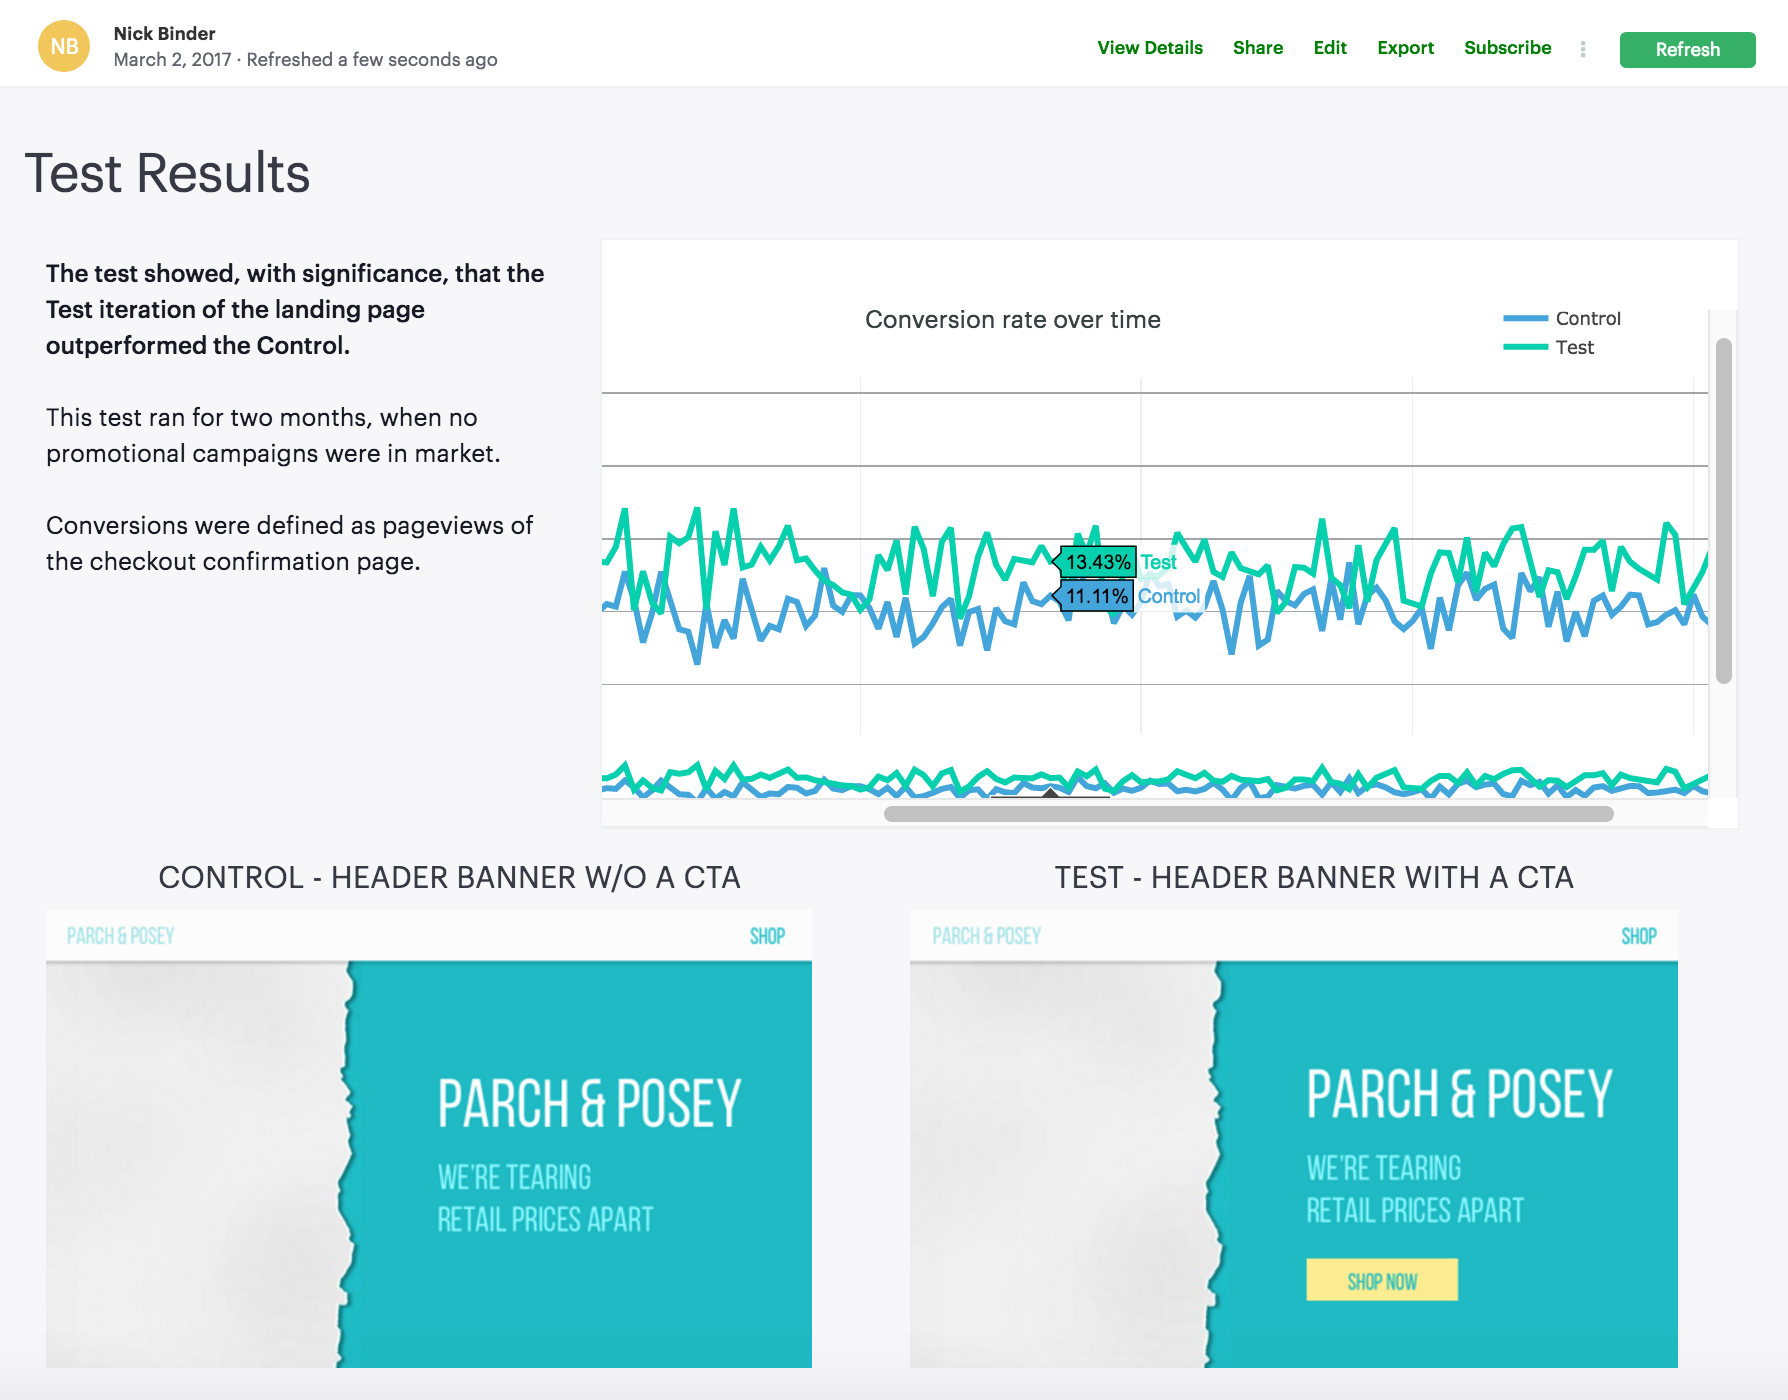
From one-off questions to complex analyses, any report can benefit from some extra context. Even the most straightforward A/B tests can gain from saving the background right alongside the results. How was success measured? What defines a conversion? Who was in each cohort? What did the tests even look like?!
Store all of this context alongside refreshable results, right in Mode. Teammates can turn to a central hub for answers, and immediately review the entire test in one glance. You'll avoid wasting time looking for an email or Google doc explaining the test's set up, or wondering if there's more recent test results.
Instead, you can provide coworkers live updates on performance, allowing them to make decisions quickly, and cutting out the back-and-forth.
Customizing Your Text Elements
As you write content, add images, and format text as code blocks, bullets, or numbered lists, we generate clean, easy-to-modify HTML. Open up the HTML Editor to check it out, and add additional styling to your reports.
Start Sharing Stories
Jump right in to Mode to try out the new text elements. Let us know if you have questions or feedback at hi@modeanalytics.com or reach out to us by opening a chat right in the product. We love hearing from you!

