


Head over to the Report Builder to check out a few new features that will make it easier to present a data story beautifully.
Rather than switching back and forth between the Editor and the Report Builder to add and edit charts, you can now take advantage of the new in-line editing features.
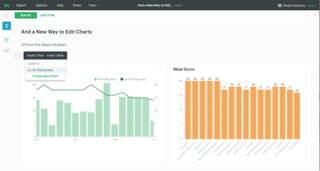
Add charts from the Report Builder
To add a new chart, hover your mouse just above the first chart or just below the bottom chart. A green “+” will appear, providing the option to select any of the charts not yet in the report.
Edit charts from the Report Builder
You can also edit charts in place. Click on the chart you'd like to modify and then click Edit. The chart options will slide open from the right side of the screen.
We hope you enjoy these updates. Keep your eyes peeled for some additional report options rolling out in the next few weeks.

