Modern Business Intelligence
Data at the speed of business
Mode helps you get data into every business decision, with an unmatched flexibility that scales with your organization as you grow.
Turn your data team into a force multiplier for business growth
The cycle of ad hoc analysis to self-
serve reporting and back again?
It all happens in Mode.
The cycle of ad hoc analysis to self- serve reporting and back again? It all happens in Mode.
The cycle of ad hoc analysis to self- serve reporting and back again? It all happens in Mode.
A fully integrated suite of analytical tools—for everyone
When most BI platforms say they’re built “for everyone,” they don’t actually mean the data experts. And that does everyone a disservice.
Mode believes “for everyone” means building a platform where business teams and data teams can collaborate. The result? Better decisions, faster.
By supporting ad hoc analysis alongside self-serve reporting, advanced analytics, and custom data apps, Mode becomes the central hub for your organization’s knowledge.
No more lost analysis. No more mismatched metrics across tools. No unwieldy, out-of-date data models. Just useful, meaningful data. For everyone.
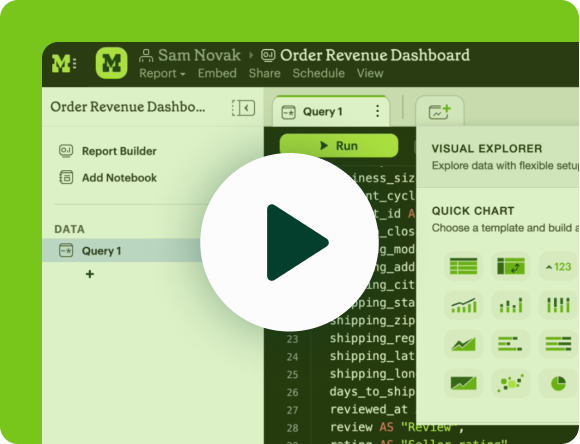
Take the tour, on your time
See what a fully integrated suite of analytical tools—for everyone—can do for your business during this product tour of Mode.
Fully stacked in your favor
Give everyone the tools they need to access the power of the modern data stack.
Modern BI
Bring your data to life and serve it up to people in myriad ways, all in Mode.
Raw Data
All your company’s data sources.
Ingestion
ELT’ed into your warehouse. By design, we don’t build connectors to SaaS tools.
Warehouse
Mode connects to most major data warehouses. Integrations
Transformation
Leverage metrics defined in the dbt Semantic Layer for enhanced scalability.
Capabilities you can count on
Improve decisions, big and small
Features
SQL editor
Dive right into your data using SQL and rapidly iterate through queries to deliver results.
Python & R notebooks
Load SQL results directly in the connected R and Python notebook to kick-start advanced analytics.
Visual exploration
Explore 100K+ datapoints visually, right in your browser. Then share the insightful explorations.
Writeups
Craft a report, complete with explorable charts, output cells, and a narrative to recommend what comes next.
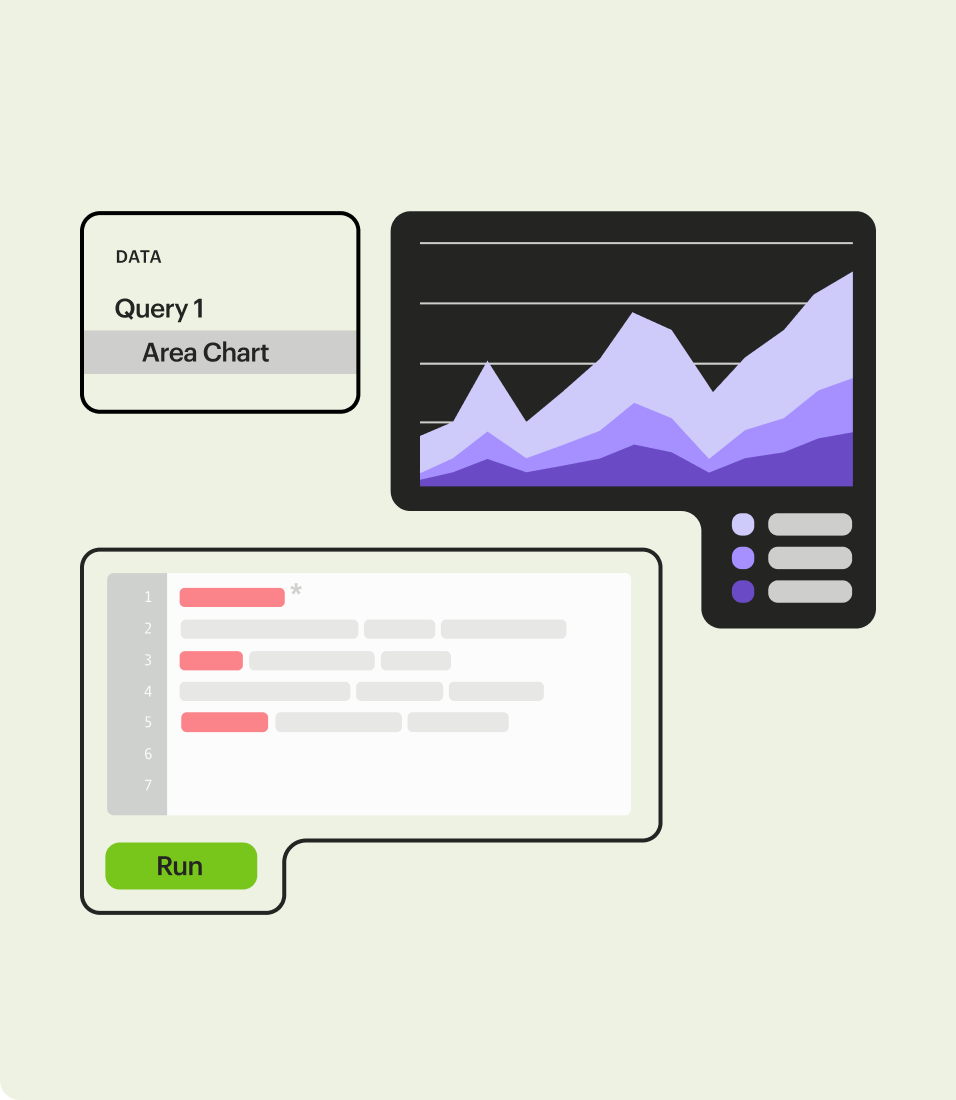
Governance, meet flexibility
Features
Reusable datasets
Build and maintain trusted, curated datasets to power every team's explorations, in record time.
Governed metrics
Define your most critical metrics in the dbt Semantic Layer and serve them up in Mode.
Visual data exploration
Use drag-and-drop tools to explore go-to data, right in your browser.
Interactive dashboards
Build dashboards that anyone can dive into when they've got a follow up question–no tickets required.
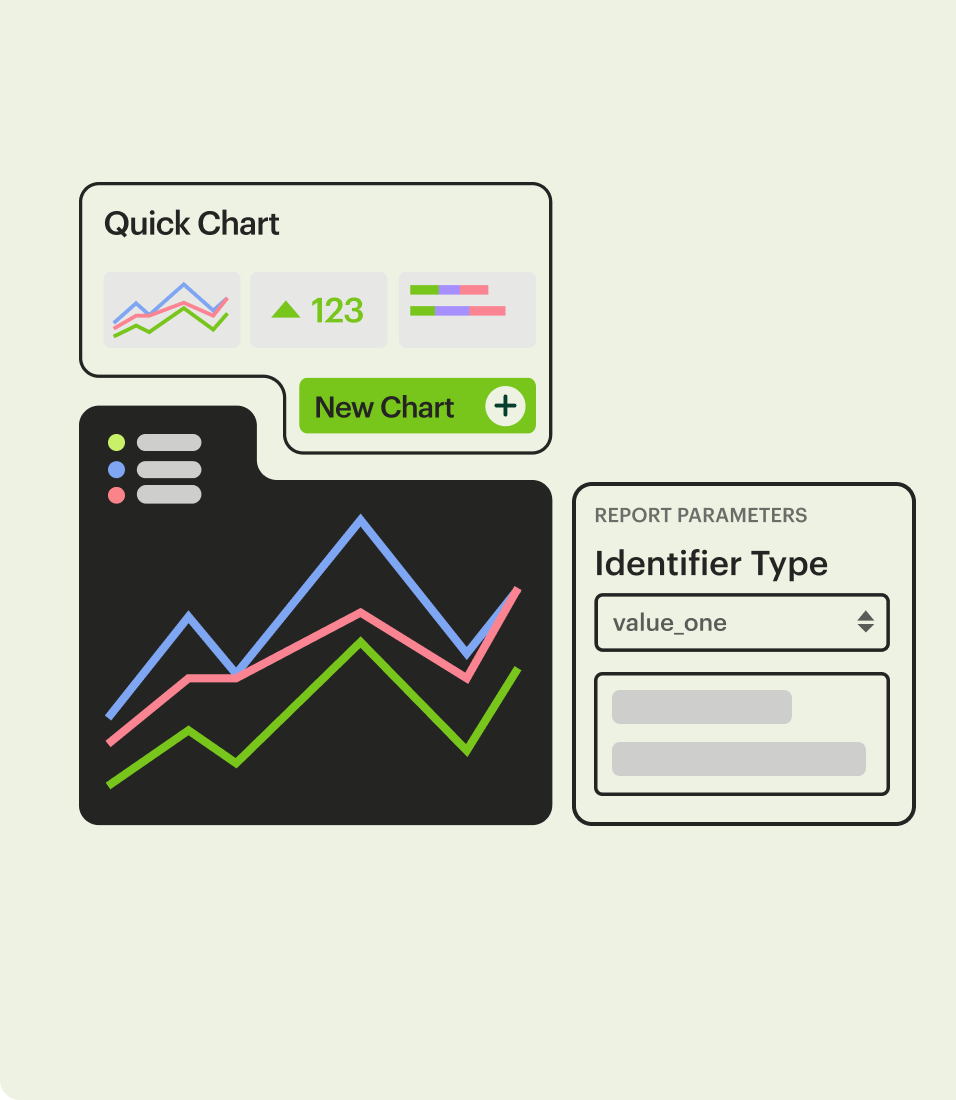
Inspire a deep dive, morning, noon, and night
Features
Drag-and-drop explorations
Let anyone click “Explore” to dive into a dashboard’s underlying data to find answers to follow up questions.
Powerful data visualizations
Build multi-faceted, multi-axis visuals, and present them side-by-side with advance analysis.
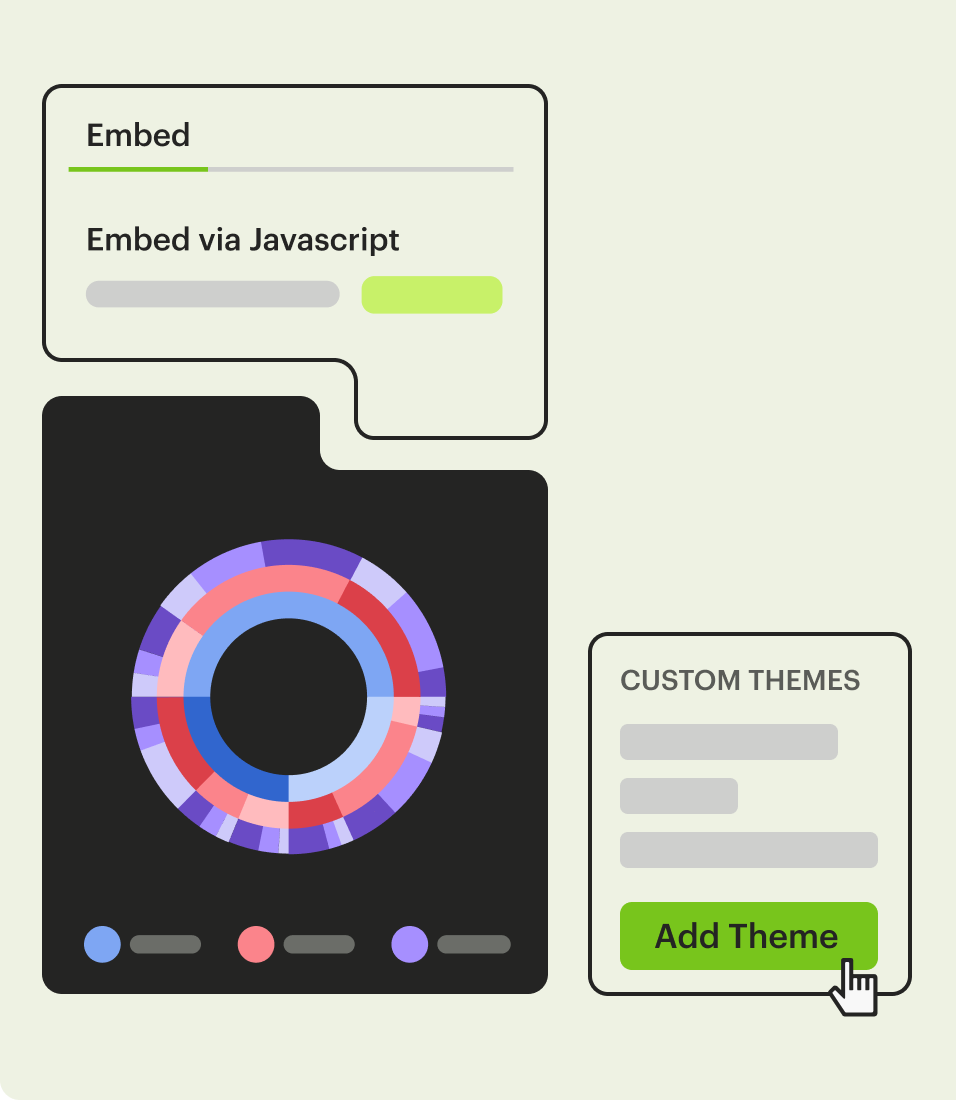
Custom themes
Import your organization’s colors and fonts so key metrics reporting is on brand.
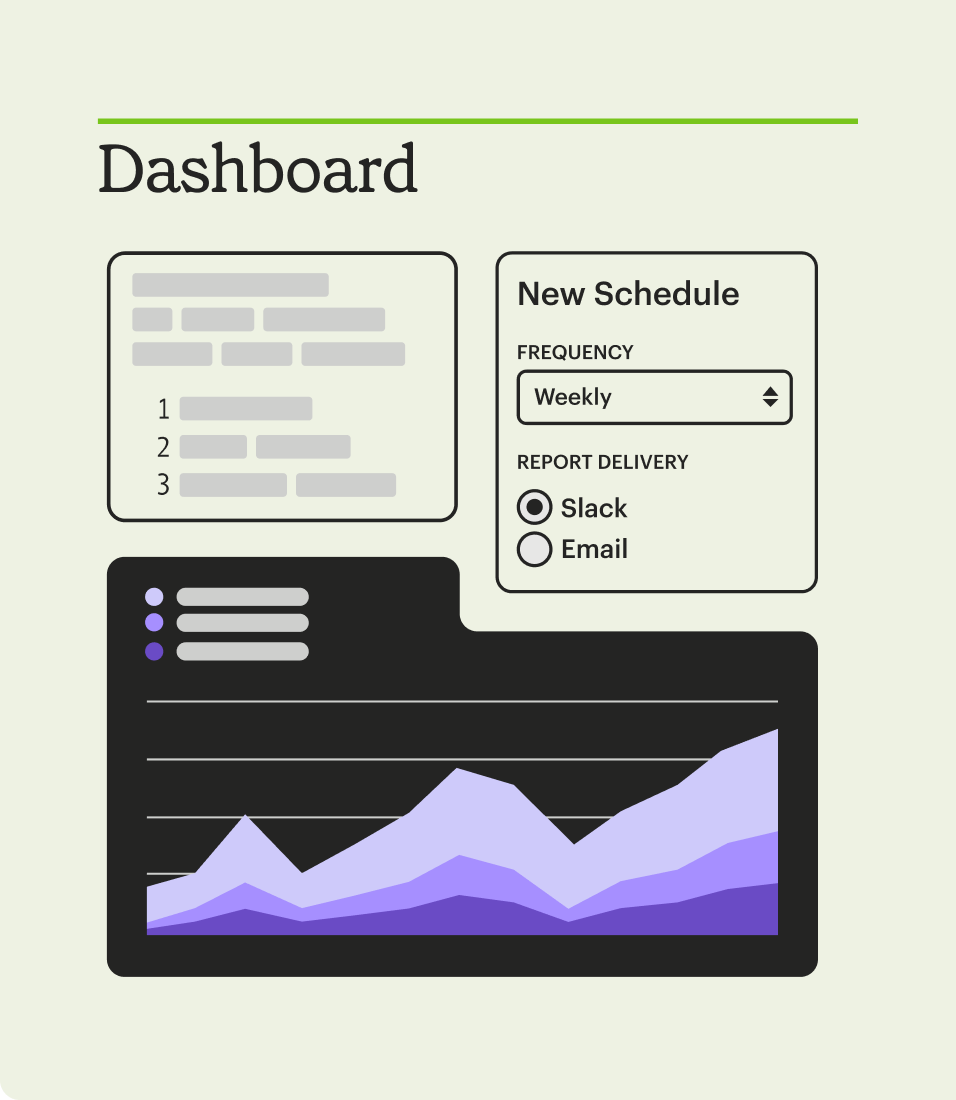
Schedules
Set your reporting to run at scheduled times, so updated data is ready when people need it most.
No limits to the insights you can provide.
Features
Python & R Notebooks
Analyze data with the support of 60+ of the world’s most popular R and Python libraries.
Curate and deliver output cells
Build dashboards powered by notebooks to provide instant access to advanced analytics.
No Dev Environment needed
Make it easier to get notebooks into everyone's hands.
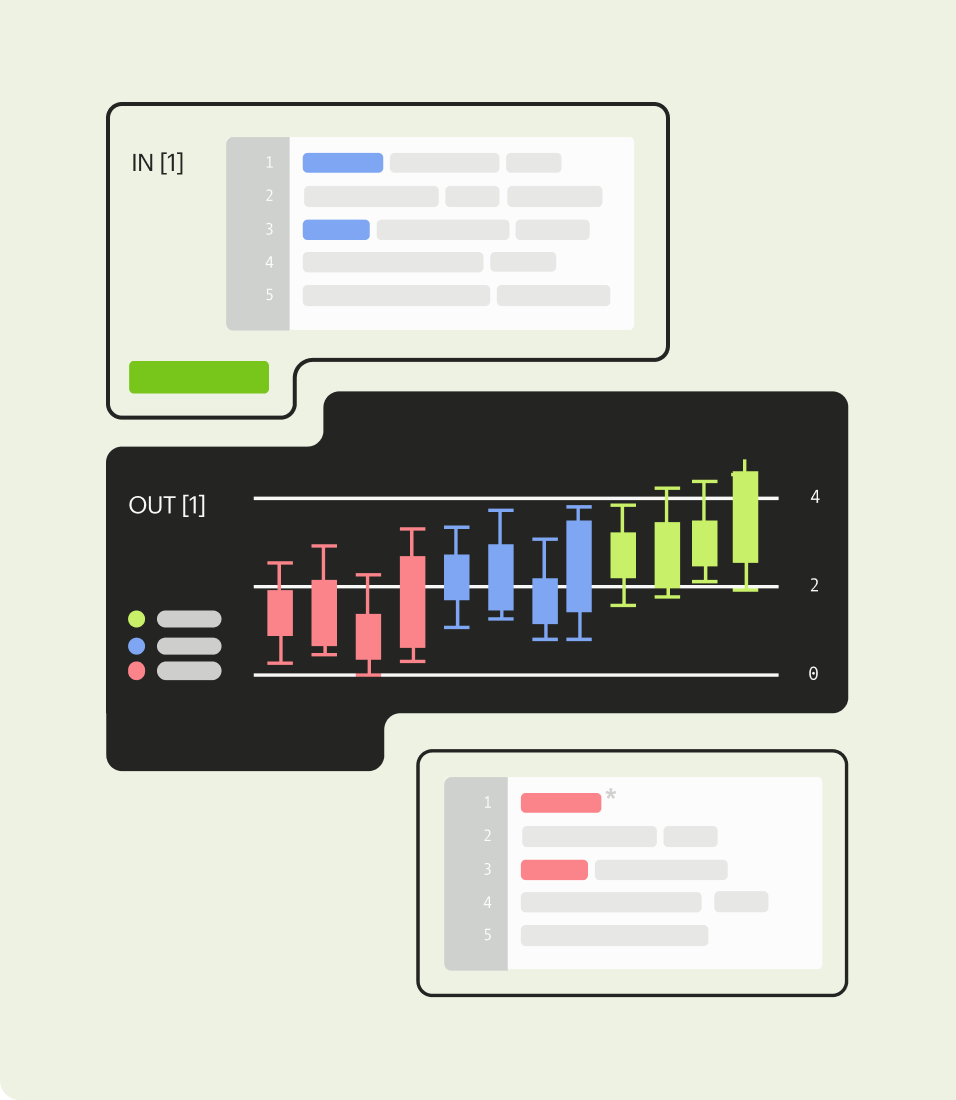
Build internal tools to power business processes.
Features
Complete customization
Use HTML, CSS, Javascript, APIs, and custom themes to tailor your internal data tools to your team's needs.
Parameters
Enable stakeholders to search and reframe data by their specific values.
Embedding
Easily embed reports anywhere in your existing internal tools, making them completely yours.
Bring together data experts and domain experts
Mode is the modern business intelligence platform that shifts how you and your team use data, helping you make better decisions, level up your company's data maturity, and grow your business faster.

Flexibility first
Designed around a data team's go-to workflow, there's nothing standing between you and better insights.

Power tools for all
Empower everyone to find their own answers by curating data that inspires confident self-serve reporting.

Source of truth
As the central hub for analysis, you'll spend less quibbling about who's number is right, and more time learning from the data–and each other.

Rapid ROI
Unlike traditional BI, you can be up-and-running on Mode in minutes. 12+ months of BI implementation is a thing of the past.
Grows with you
From an employee wearing the analyst hat part time, to hundreds of analysts partnering with thousands of employees, Mode is designed to scale with you.
How Mode scales
Identity management & provisioning
Granular access controls
Query-level search
Collections for content management
Semantic layer integrations
Connections to popular data warehouses
Reusable datasets
Ecosystem partnerships
Scheduled report runs
Automatic email & Slack updates
Embedded analytics
Programmatic APIs

Trusted and secure
Secure by design
Mode is built on a strong foundation of data security and privacy that keeps your data safe.

Award-winning support
When you need them, our team of experts is just a quick chat away.

At Condé Nast, we are delivering data products, not just dashboards. We make sure what we are building is not just for a few data analysts, but for everyone.

