Visual Explorer Guides
Funnel
This example will walk you through how to create a funnel chart, which is great for capturing and tracking stages in a process.
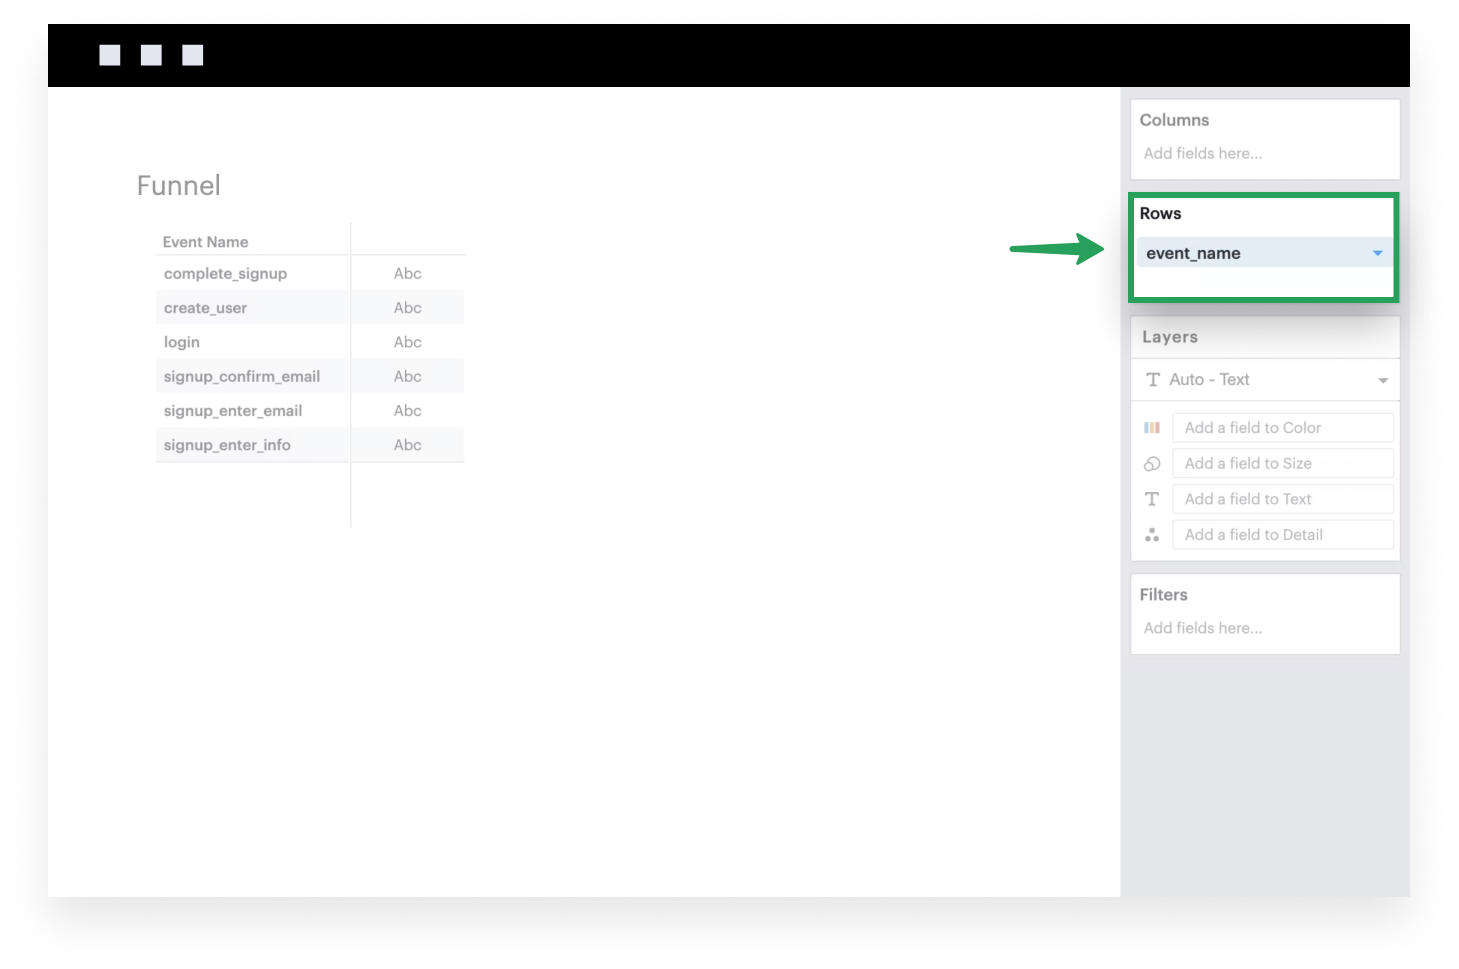
- Add a discrete field to Rows. This field should represent the various stages of a process that you’re trying to track.
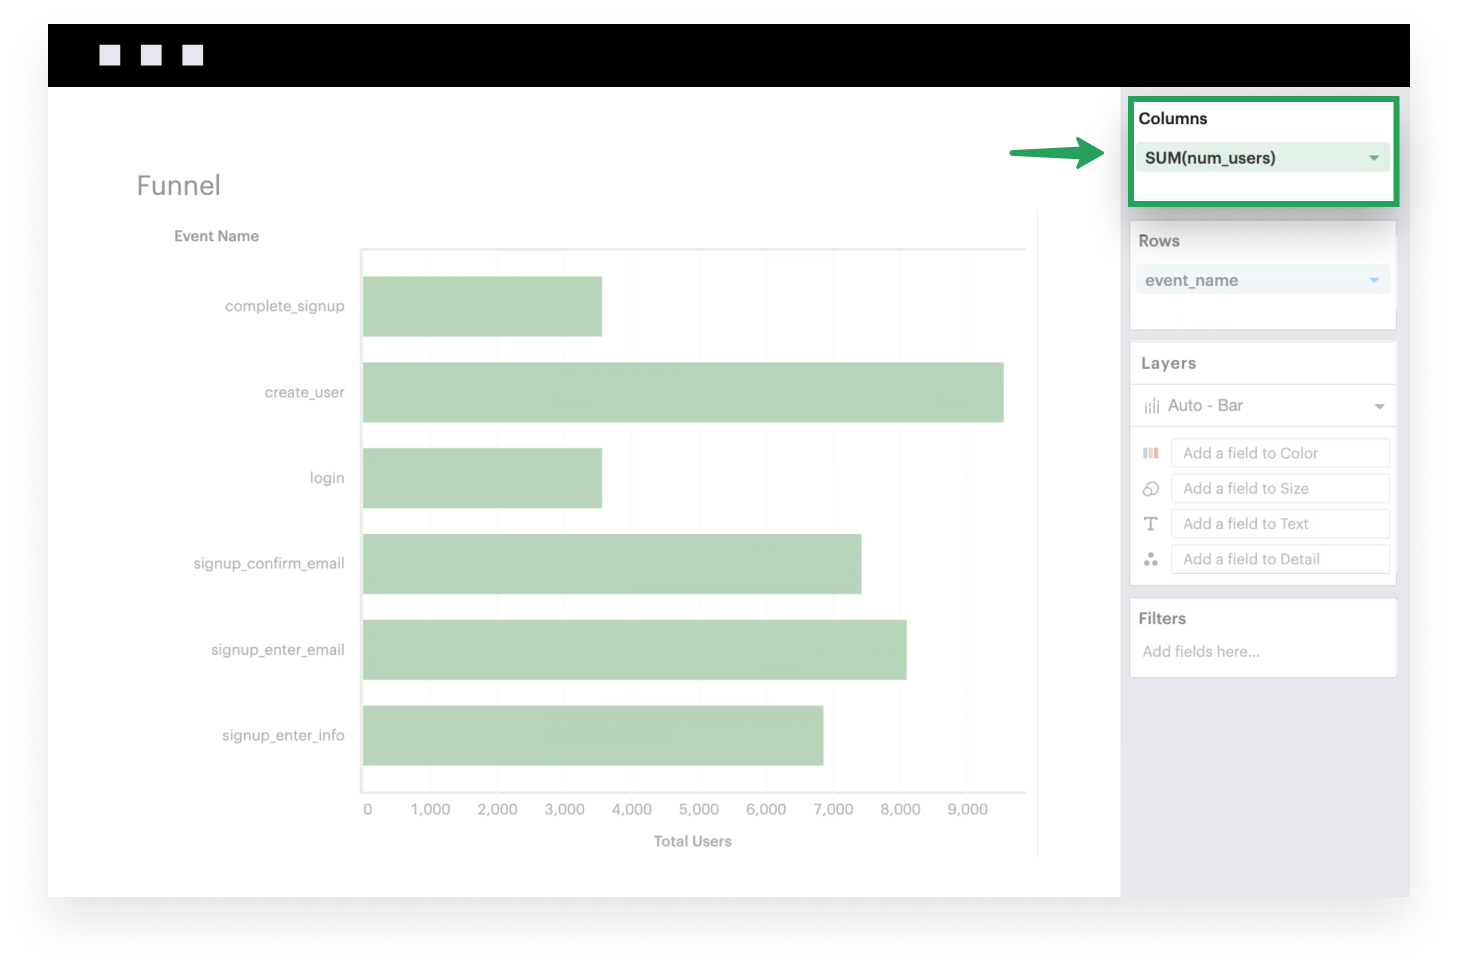
- Add a continuous, aggregated field to Columns. This is the metric that you’re tracking in your funnel analysis.
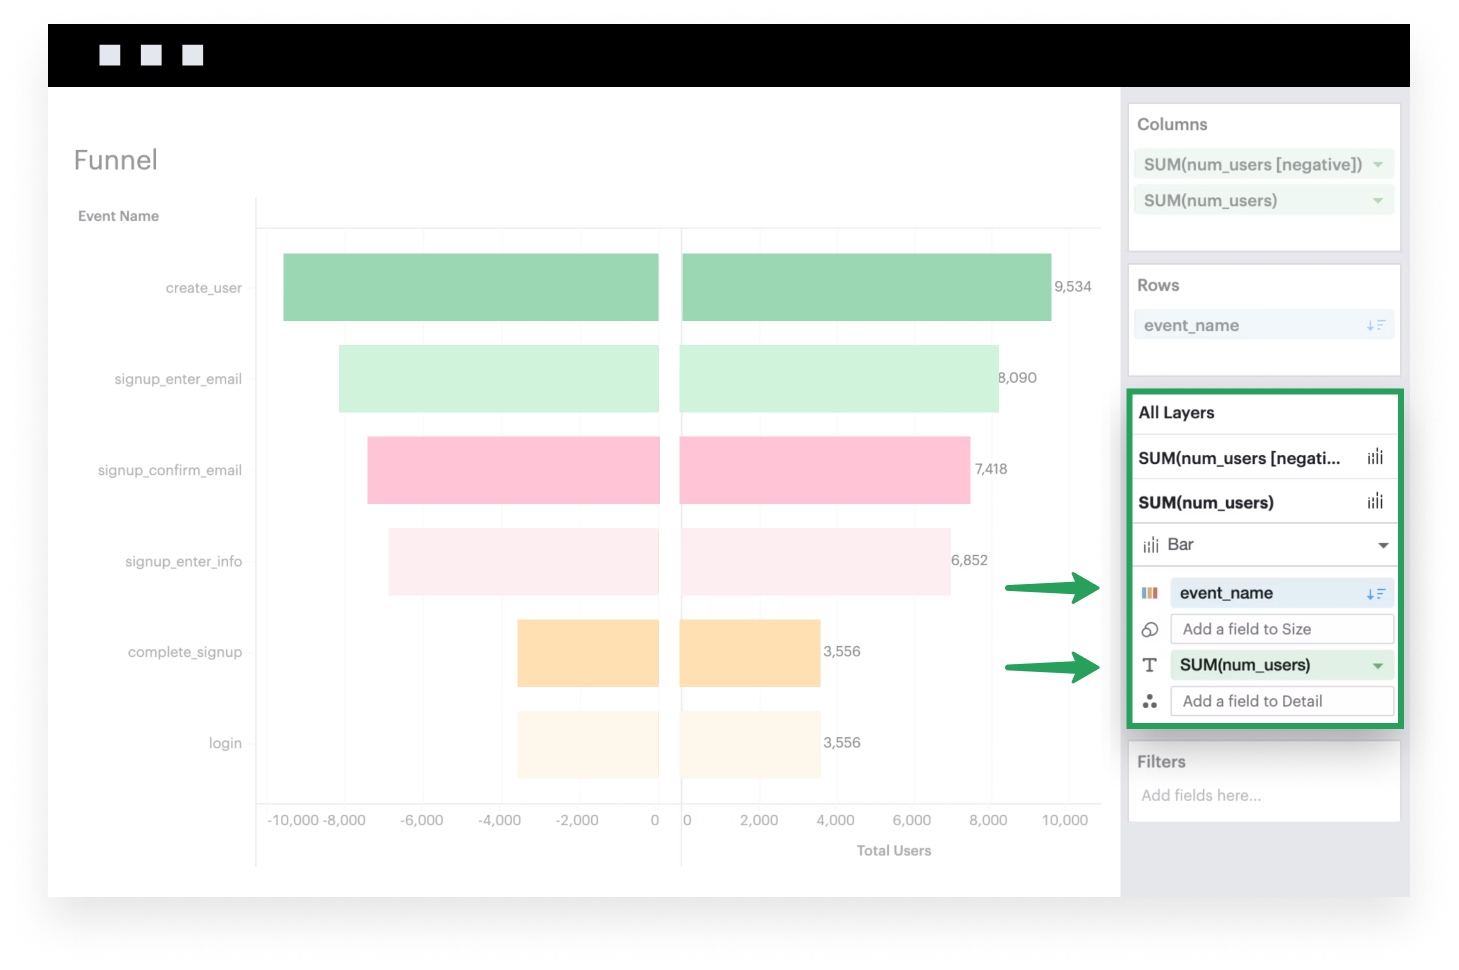
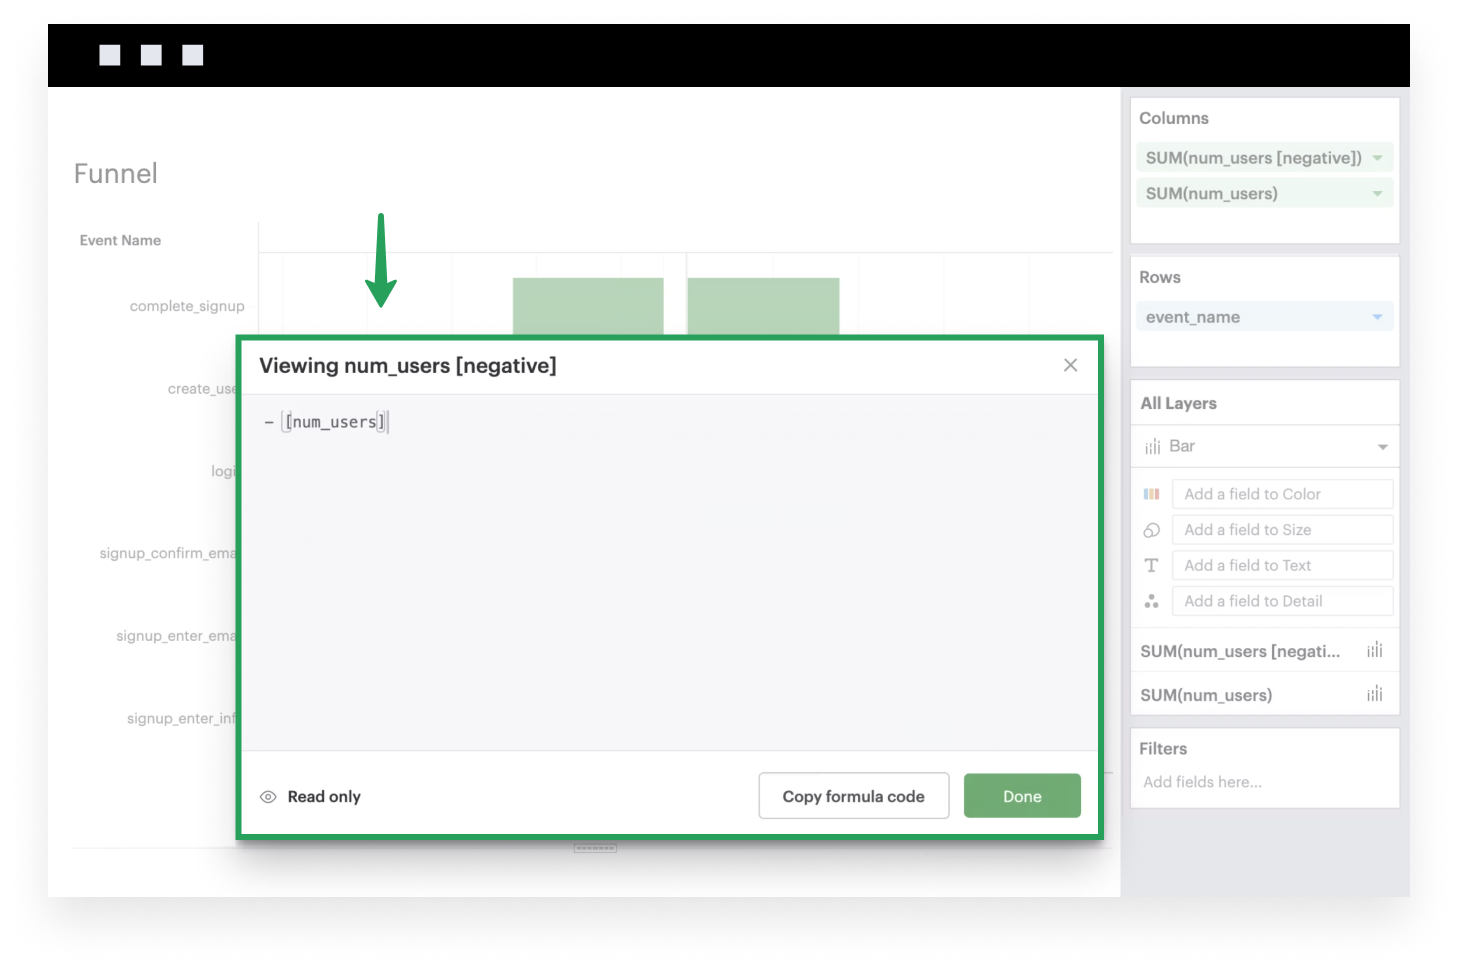
- Create a calculated field that is the negative of the metric above, and add this calculated field to Columns above the previous metric. This is used to mirror the values of your metric.
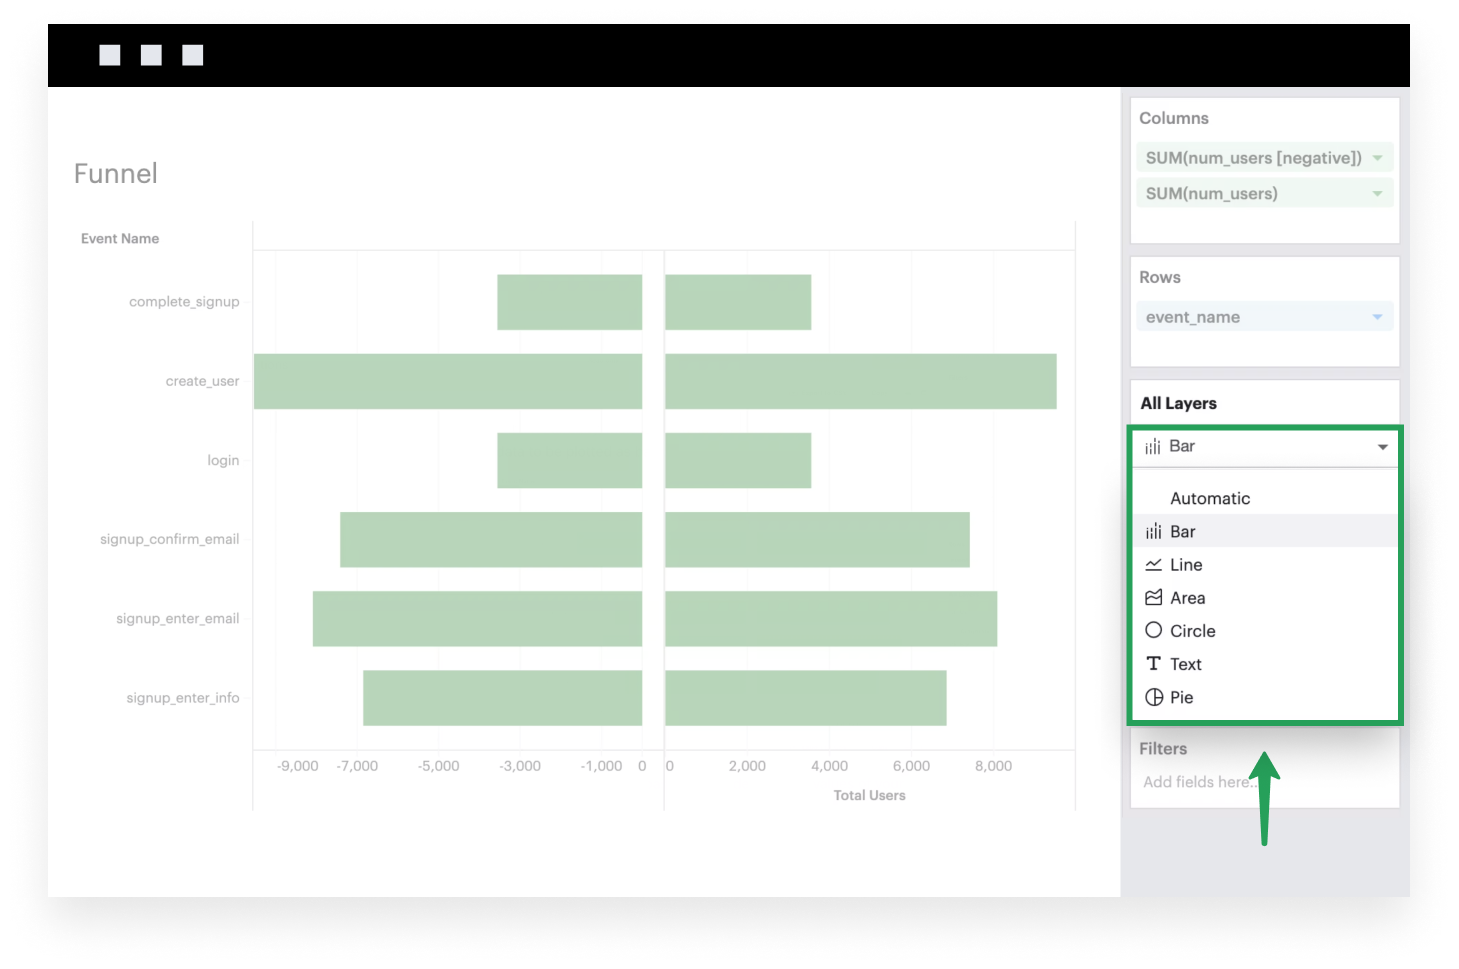
- If it isn’t already, make sure to set your Mark Type to Bar because you want your data to be plotted as bars.
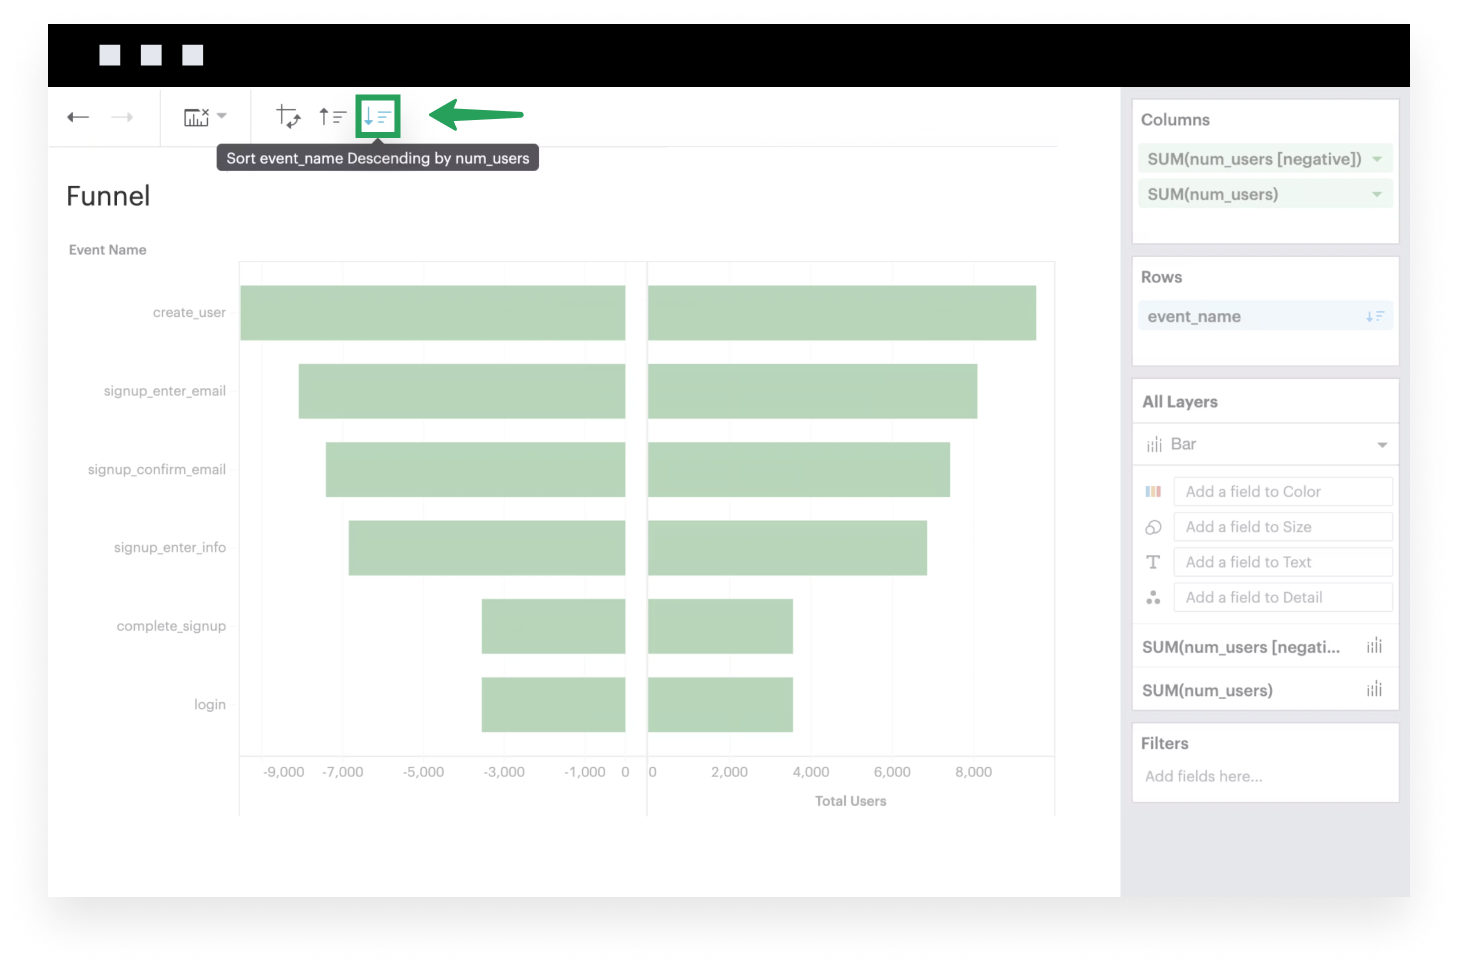
- Sort your visualization based on the descending values of your metric.
- Optionally, you can add a field to the Color channel to distinctly color stages in your funnel and add labels to showcase specific values.