
Python Tutorial
Learn Python for business analysis using real-world data. No coding experience necessary.
Start Now
Mode Studio
The Collaborative Data Science Platform
Pandas .values_count() & .plot()
Starting here? This lesson is part of a full-length tutorial in using Python for Data Analysis. Check out the beginning.
Goals of this lesson
In this lesson, you'll learn how to analyze and visualize real web traffic data using a DataFrame. More specifically, you'll learn how to:
By the end of this Python lesson, you'll be able to quickly count and compare records across a large dataset. You'll be able to look at web traffic data and compare traffic landing on various pages with statistics and visualizations.
Loading data into Mode Python notebooks
Mode is an analytics platform that brings together a SQL editor, Python notebook, and data visualization builder. Throughout this tutorial, you can use Mode for free to practice writing and running Python code.
For this lesson, you’ll be using web traffic data from Watsi, an organization that allows people to fund healthcare costs for people around the world. To access the data, you’ll need to use a bit of SQL. Here’s how:
- Log into Mode or create an account.
- Navigate to this report and click Duplicate. This will take you to the SQL Query Editor, with a query and results pre-populated.
- Click Python Notebook under Notebook in the left navigation panel. This will open a new notebook, with the results of the query loaded in as a dataframe.
- The first input cell is automatically populated with
datasets[0].head(n=5). Run this code so you can see the first five rows of the dataset.
datasets[0] is a list object. Nested inside this list is a DataFrame containing the results generated by the SQL query you wrote. To learn more about how to access SQL queries in Mode Python Notebooks, read this documentation.
Now you’re all ready to go.
The value of web traffic data
As you analyze web traffic data in these next few lessons, it's important to keep in mind why you're analyzing this data. Web traffic data presents significant value to a business. The practice of web analytics focuses on assessing and improving the company's traffic and engagement by analyzing and understanding how people view and traverse the website.
Generally, the main goals of web analytics are:
- To find and monitor trends, such the ratio of mobile pageviews to desktop pageviews
- To find and monitor outliers, such as significant traffic from one referrer
- To measure change over time of metrics (key measurements set by the company) such as the rate of inbound traffic from direct email campaigns
These are what you should be hunting for in the data. As a data analyst or data scientist, you might be responsible for these types of analyses on your company's web traffic data. Learnings from this data could potentially inform business decisions, such as where to increase spending on ads, when to send promotional emails, and what kinds of blog posts to publish.
Getting oriented with the data
This lesson uses data from Watsi. For a data dictionary with more information, click here.
Since you’ll be using pandas methods and objects, import the pandas library. Then, give the DataFrame a variable name and use the .head() method to preview the first five rows.
import pandas as pd
data = datasets[0] # assign SQL query results to the data variable
data = data.fillna('') # replace missing values with '' as in the previous lesson
data.head()
| referrer | timestamp | title | url | user_agent | user_id | referrer_domain | website_section | platform | |
|---|---|---|---|---|---|---|---|---|---|
| 0 | https://www.google.com/ | 2016-02-05 00:48:23 | Watsi | Fund medical treatments for people aro... | https://watsi.org/ | Mozilla/5.0 (Macintosh; Intel Mac OS X 10_10_4... | CHAROLETTE S | Desktop | ||
| 1 | https://themeteorchef.com/snippets/making-use-... | 2016-02-24 23:12:10 | Watsi | The Meteor Chef | https://watsi.org/team/the-meteor-chef | Mozilla/5.0 (Windows NT 6.1; WOW64) AppleWebKi... | WARREN Q | themeteorchef.com | team | Desktop |
| 2 | https://watsi.org/ | 2015-12-25 17:59:35 | Watsi | Give the gift of health with a Watsi G... | https://watsi.org/gift-cards | Mozilla/5.0 (Macintosh; Intel Mac OS X 10_11_1... | MITCHEL O | watsi.org | gift-cards | Desktop |
| 3 | 2016-02-05 21:19:30 | Watsi | Fund medical treatments for people aro... | https://watsi.org/ | Mozilla/5.0 (Macintosh; Intel Mac OS X 10_11_2... | MICHEL O | Desktop | |||
| 4 | https://watsi.org/fund-treatments | 2016-02-14 19:30:08 | Watsi | Fund medical treatments for people aro... | https://watsi.org/ | Mozilla/5.0 (Macintosh; Intel Mac OS X 10_10_2... | ANDREE N | watsi.org | Desktop |
Counting with .value_counts()
In this lesson, you'll be working with the Watsi pageview data, which we first saw in the last lesson. In the previous lesson, you selected rows, columns, and records in that dataset. But how many times does a particular value appear in the same column? Simply counting is often the fastest way to get information about a dataset in order to start formulating hypotheses—it's something you'll do at the beginning or nearly every exploratory analysis.
For categorical columns such as title, referrer_domain, website_section, or platform, you can aggregate the number of times each value occurred using the .value_counts() method. This will technically work for columns containing numerical values as well, but there are better ways to handle that (covered in later lessons).
Say you want to know what the titles of Watsi’s web pages are and how many pageviews each one received. You’ll need to select the title column data[‘title’], then count the number of times each value occurred in the dataset using .value_counts(). To keep things simple, start by looking at the top 20 most viewed pages (the first 20 rows of the output generated by using .value_counts()):
data['title'].value_counts()[:20]
Watsi | Fund medical treatments for people around the world                                             1268
Watsi | Fund a medical treatment on Watsi. 100% of your donation directly funds a medical treatment.     606
Watsi | About Us                                                                                         276
Watsi | Join Watsi's Universal Fund                                                                      151
Watsi | How Watsi works                                                                                   93
Watsi | Reddit Uplifting News                                                                             61
Watsi | From Burma to the Bay Area and beyond: Inside a year of health at Watsi                           55
Watsi | Give the gift of health with a Watsi Gift Card                                                    52
Watsi | Donor Settings                                                                                    41
Watsi | Frequently Asked Questions                                                                        32
Watsi                                                                                                     32
Watsi | Pledge your birthday on Watsi                                                                     32
Watsi | Chase's 29th Birthday                                                                             32
Watsi | Start a chain of connections on Watsi                                                             30
The surprising role of Netflix in global health                                                           30
Watsi | Contact Us                                                                                        27
Saying yes                                                                                                25
Watsi | Our Funders                                                                                       20
The Toast That Traveled 3,000 Miles                                                                       17
Meet Chase!                                                                                               16
Name: title, dtype: int64
Counting values is also a common operation in SQL. To get the same result as the above, you could use this query. Note that value_counts() automatically orders the results in descending order by count:
SELECT title, COUNT(*) as cnt
  FROM tutorial.watsi_events
 GROUP BY title
 ORDER BY cnt DESC
 LIMIT 20
Python code execution and objects
Okay, back to Python. Let's break down the line of code you ran most recently:
data['title'].value_counts()[:20]
In Python, this statement is executed from left to right, meaning that the statements layer on top, one by one.
data['title']Select the "title" column. This results in a Series..value_counts()Counts the values in the "title" Series. This results in a new Series, where the index is the "title" and the values are how often each occurred. The series is ordered in descending order from most frequently occurring title.[:20]Selects the first 20 most-frequently occurring titles from the last Series, created by.value_counts(). This results in yet another Series—the one which is finally displayed.
As you learned in the first lesson, everything in Python is an object, so each of these steps would give you an object. In this case, each of the objects is a Series. But as you might have noticed, it can be useful to combine the statements on the same line.
Here's a detailed breakdown so you can see how each part of the line evaluates:
data['title'] # Step 1
0    Watsi | Fund medical treatments for people aro...
1                              Watsi | The Meteor Chef
2    Watsi | Give the gift of health with a Watsi G...
3    Watsi | Fund medical treatments for people aro...
4    Watsi | Fund medical treatments for people aro...
Name: title, dtype: object
data['title'].value_counts() # Step 2
Watsi | Fund medical treatments for people around the world                                             1268
Watsi | Fund a medical treatment on Watsi. 100% of your donation directly funds a medical treatment.     606
Watsi | About Us                                                                                         276
Watsi | Join Watsi's Universal Fund                                                                      151
Watsi | How Watsi works                                                                                   93
Name: title, dtype: int64
data['title'].value_counts()[:20] # Step 3
Watsi | Fund medical treatments for people around the world                                             1268
Watsi | Fund a medical treatment on Watsi. 100% of your donation directly funds a medical treatment.     606
Watsi | About Us                                                                                         276
Watsi | Join Watsi's Universal Fund                                                                      151
Watsi | How Watsi works                                                                                   93
Watsi | Reddit Uplifting News                                                                             61
Watsi | From Burma to the Bay Area and beyond: Inside a year of health at Watsi                           55
Watsi | Give the gift of health with a Watsi Gift Card                                                    52
Watsi | Donor Settings                                                                                    41
Watsi | Frequently Asked Questions                                                                        32
Watsi                                                                                                     32
Watsi | Pledge your birthday on Watsi                                                                     32
Watsi | Chase's 29th Birthday                                                                             32
Watsi | Start a chain of connections on Watsi                                                             30
The surprising role of Netflix in global health                                                           30
Watsi | Contact Us                                                                                        27
Saying yes                                                                                                25
Watsi | Our Funders                                                                                       20
The Toast That Traveled 3,000 Miles                                                                       17
Meet Chase!                                                                                               16
Name: title, dtype: int64
Re-running cells
When you start writing more complicated operations, it can be helpful to build step by step as demonstrated above with the breakdown of data['title'].value_counts()[:20]. Start with the first statement, then add the methods and functions on top in that cell, one by one. As you add each one, you have two options:
- add a new cell for every step
- add to the same cell and re-run it to inspect the output.
It comes down to personal preference. If you're exploring, it may be easiest (and easier to read later) to edit a cell and rerun it. Keep in mind that, as you learned in the first lesson, you should always be able to run your notebook from top to bottom and achieve the desired results. Make sure as you re-run cells that they still work properly in order.
Visualizing data with .plot()
Visualizing data is useful because it allows you to see relationships in data in a fast, intuitive way. It's especially helpful in exploring data and deciding what to dig into next, because it can point to places where there may be significant patterns. In pandas, the .plot() method allows you to create a number of different types of charts with the DataFrame and Series objects.
Bar charts
Bar charts are a visual way of presenting grouped data for comparison. You can visualize the counts of page visits with a bar chart from the .plot() method. To define the type of plot you want, you’ll use give .plot() a keyword called kind=. In this case, you can use the keywords bar or barh (for horizontal bar chart). For other keywords to adjust the size, color, title, and more, see the documentation. Additional charting features are also covered in an upcoming lesson.
Let's plot the most visited Watsi pages for comparison. Because Python performs these steps from left to right, you can add .plot() method to the right of your previous line of code in order to visualize the results:
data['title'].value_counts()[:20].plot(kind='barh')

Among Watsi pages that people landed on, the most popular page is the homepage.
What you're looking at here is the distribution of frequently visited pages—a display of several possible values in the title column and how often they occur.
As you can see, traffic volume was significantly lower for the 2nd highest-ranking page than for the top page. The drop from the second to the third is pretty substantial as well. Five pages down the list and traffic is looking pretty small by comparison. This is called a logarithmic or long tail distribution. It's a common pattern on the web, where the most popular pages will be visited much more frequently than the next popular page (in this case, 2 times more).
Practice Problem
What were the 15 most popular website sections? Bonus Points for creating a plot!
View Solution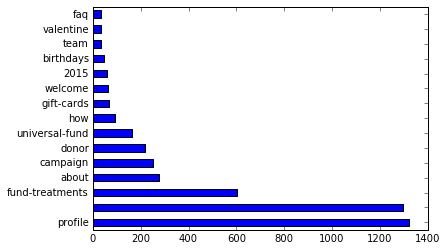
Practice Problem
What websites most commonly referred users to Watsi's pages? Create a frequency distribution bar chart.
Hint: referrer_domain is a simplified version of the
referrer column. Domains like "google.co.uk" and
"google.com" have been grouped under "google". Note that "t.co" is
Twitter's link shortener, so those referrals are from Twitter.
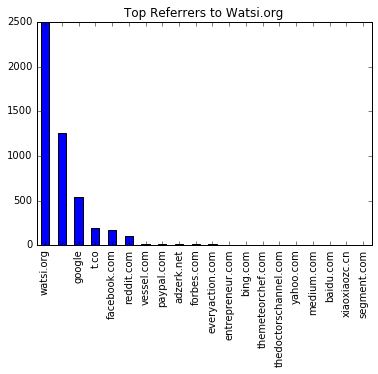
Missing data!
Notice the second highest bar in the chart? It's missing a label. This is because the referrer column is missing values. This isn't because we failed to record where those page views came from, but rather, we don't know the source of those page views. Maybe someone received a text message with a link, or typed it straight into the browser. We can't know for sure. But we do happen to know that Watsi gets significant traffic from email they send out directly, and from other types of social sharing. If you were an analyst for Watsi, this would be a great place to dig deeper, find other useful data, and investigate where this mysterious website traffic is coming from.
Practice Problem
When people visited Watsi, what devices were they using? Plot the relative counts of pageviews from each platform.
View Solution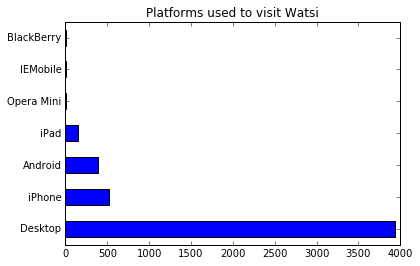
Lesson summary:
In this lesson, you learned to:
- Count values with
.values_count() - Plot bar charts with
.plot()
In the next lesson, you'll learn how to filter and view subsets of data.
Next Lesson
Filtering Data in Python with Boolean Indexes