


In 2015, people used Mode to answer thousands of questions. As we looked back on the year, we were curious about trends across companies. Despite folks from a wide variety of business types—SaaS and retail and healthcare and myriad others—using Mode to make data more accessible, we wondered if there were common themes. How did people use data to improve their businesses?
We dove in and made a word cloud to find out if there were common words in report titles.
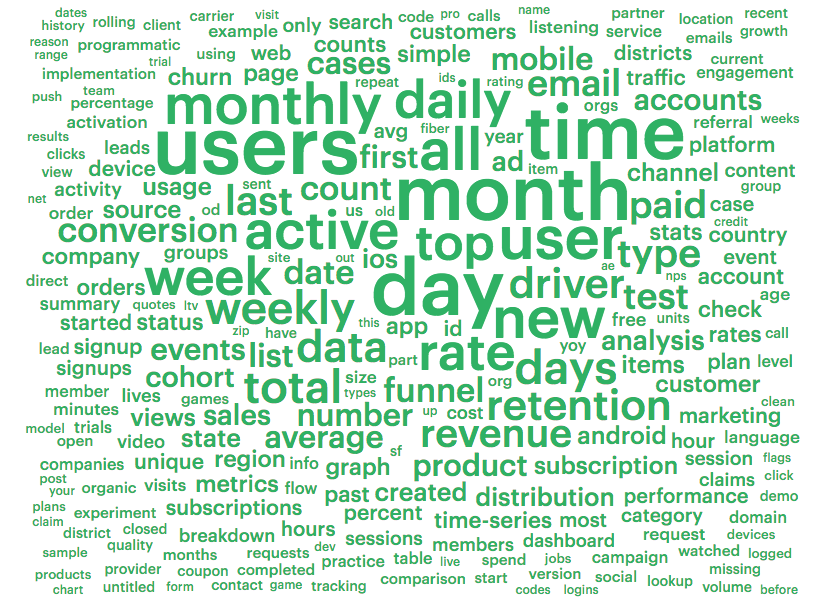
We can glean a lot from this word cloud, but a few things stick out at first glance. Some of the most frequently used words describe time periods, like “month” or “weekly,” or high-level metrics like “retention” or “revenue.” You can connect the dots to see some pretty common business measures: daily active users, monthly retention rate, etc. These are the kinds of metrics people across a company look at every day, the things you see projected on big screens around an office or during all-hands meetings.
But for every KPI tracked, there are countless investigations that uncover areas for improvement. When a metric drastically changes, analysts zoom in and look at the data on a granular level.
That's what we did here, too. The above word cloud answered one question—“What are the most frequently used words in Mode report titles?”—and spurred us to ask another—“If we picked one word, which words are most often associated with it?”
We ended up choosing signups, leads, and retention because they're often where a bunch of teams' goals overlap. For instance, product and sales are obviously concerned with retention, but marketing reengagement campaigns and attentive customer support can impact retention, too. When people examine a metric through multiple lenses, it leads to a bounty of rich questions.
What data investigations await you this year? Take a gander at these word clouds and get inspired.
Beyond funneldamentals
Signups are a hallmark of growth. From this word cloud we can see that Mode users aren't just interested in the quantity of users moving through the funnel. They want to know if these users are valuable.
Signup
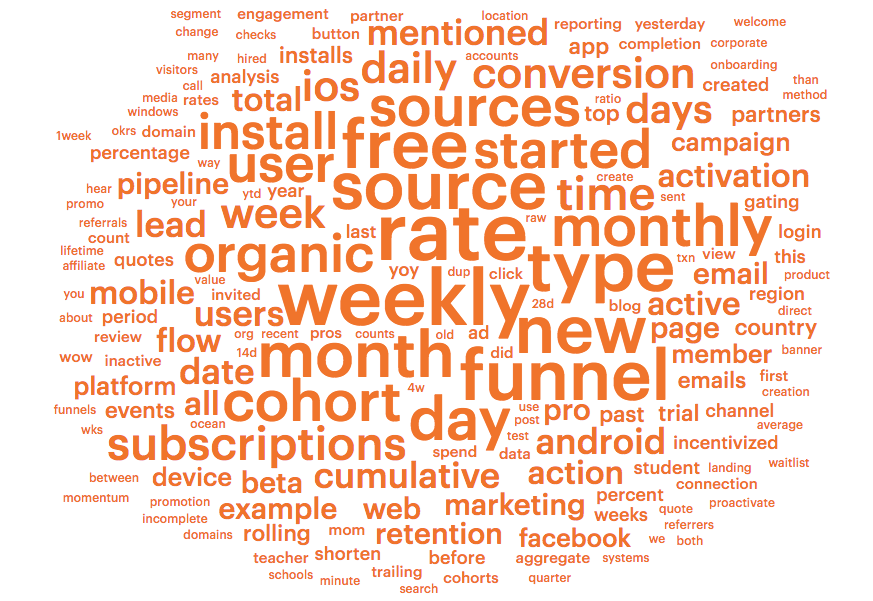
Signup source is one such criterion. For instance, which acquisition methods had good ROI: Facebook ads, email campaigns, or organic traffic?
Analysts also want to know what actions people take after signing up. This makes sense since signups don't necessarily become customers. If someone signs up for a free trial, what do they do next? Do they upgrade their account, subscribe to a newsletter, invite their friends, or install the app? And does taking any of these actions kick them into the next stage of the sales funnel? Which actions indicate that it's time for the sales team to reach out?
Ultimately, what milestones matter after signup?
Using SQL to find SQLs
“Leads” can apply to a wide variety of things, but this word cloud is decidedly sales-centric (looking at you, Salesforce). In particular, it seems like Mode users are using these reports to determine what makes for a sales qualified lead (the other kind of SQL).
Leads
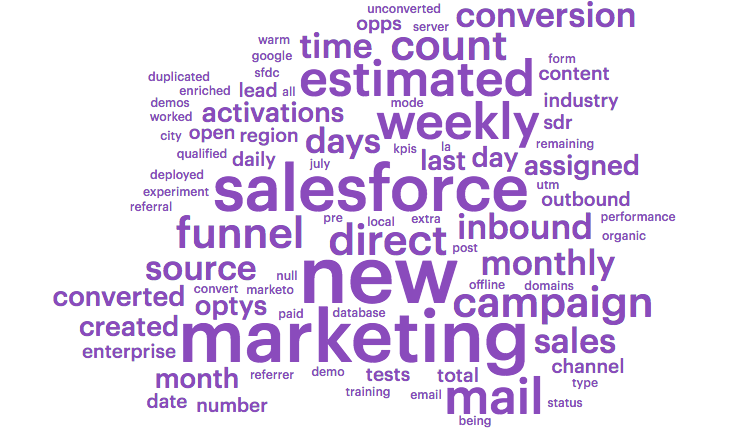
While the “signup” cloud is associated with words that describe users, “leads” bubbles up sales cycle terms—“SDR,” “assigned,” “created”—and SaaS jargon—“converted,” “qualified.”
Many of these terms indicate that Mode customers are focused on dividing leads into different buckets to determine if their leads are any good. Did this lead come in through an organic or referral channel? Is it inbound or outbound? How big is the potential deal? Is it enterprise? More importantly, is this lead qualified, and how likely is it to convert?
The presence of “Salesforce” and “Marketo” indicate that people are piping in data from lead management tools to do deeper CRM analysis in Mode. This can happen when the dashboards in such tools inspire more complex questions than they're built to answer.
A cohort of cohorts
No retention analysis is complete without cohorts. In order to start investigating retention, folks often use a rolling retention rate to gauge the baseline. To get more granular, analysts create reports to segment users into cohorts by the week or month they signed up. Then it's possible to see how those cohorts retain over time.
Retention
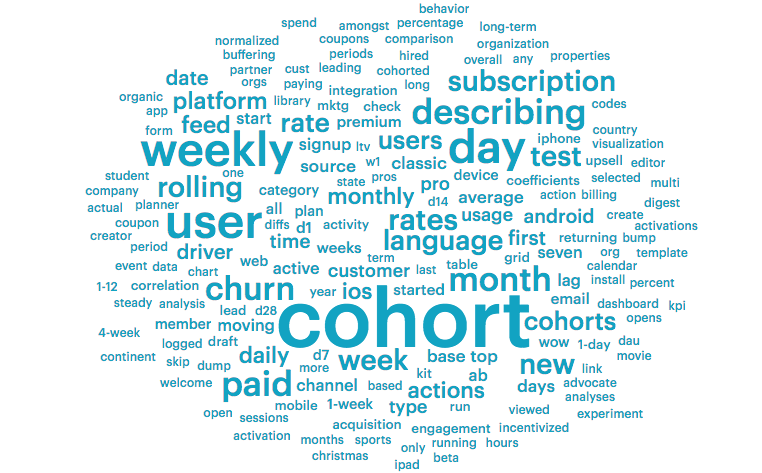
But this word cloud also reveals that people are looking at different types of cohorts—ones based on user demographics instead of acquisition date. While acquisition cohorts allow you to monitor your retention, demographic cohorts help you figure out which users to acquire.
For instance, the presence of “device,” “IOS,” “Android,” and “iPad” indicates that analysts are dividing users into cohorts by device type to see if there's a correlation between that and retention.
Other retention factors are less obvious, like “buffering.” It would be easy to assume that, for a video-based company, users with slower internet would churn sooner. But cohorting users by buffering speed would tell you for sure.
New year, new queries
Here's to the analysts with insatiable curiosity! We're honored that you choose to do your detective work in Mode. There's a ton of exciting updates in the works to help you make an even bigger impact this year. Stay tuned.

